Old Lyme, Connecticut (CT) income map, earnings map, and wages data
The median household income in Old Lyme, CT in 2022 was $115,718, which was 23.6% greater than the median annual income of $88,429 across the entire state of Connecticut. Compared to the median income of $68,386 in 2000 this represents an increase of 40.9%. The per capita income in 2022 was $75,707, which means an increase of 45.3% compared to 2000 when it was $41,386.
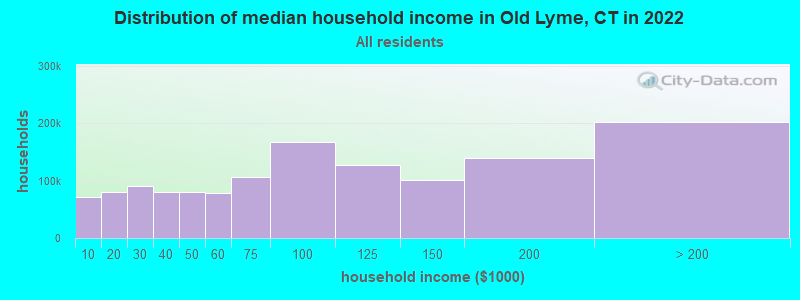
Income statistics for all residents
Median household income in Old Lyme, CT in 2022:| Old Lyme: | $115,719 |
| Connecticut: | $88,429 |
Change in median household income between 2000 and 2022:| Old Lyme, Connecticut: | +69.2% |
| Connecticut: | +64.0% |
Number of households with income < $10k:| Old Lyme: | 5.2% (47,134) |
| State: | 5.1% (72,746) |
Number of households with income $10k - 20k:| Old Lyme: | 5.8% (53,151) |
| Connecticut: | 5.7% (81,643) |
Number of households with income $20k - 30k:| Old Lyme: | 6.6% (60,162) |
| Connecticut: | 6.5% (92,844) |
Number of households with income $30k - 40k:| Old Lyme: | 5.9% (53,991) |
| State: | 5.9% (83,934) |
Number of households with income $40k - 50k:| Old Lyme: | 5.9% (53,646) |
| Connecticut: | 5.8% (83,025) |
Number of households with income $50k - 60k:| Old Lyme: | 5.8% (52,602) |
| State: | 5.7% (81,788) |
Number of households with income $60k - 75k:| Old Lyme: | 8.1% (73,703) |
| State: | 8.1% (115,651) |
Number of households with income $75k - 100k:| Old Lyme: | 12.6% (115,107) |
| State: | 12.6% (180,173) |
Number of households with income $100k - 125k:| Old Lyme: | 9.8% (89,610) |
| State: | 9.9% (141,231) |
Number of households with income $125k - 150k:| Old Lyme: | 7.8% (71,562) |
| Connecticut: | 7.9% (112,826) |
Number of households with income $150k - 200k:| Old Lyme: | 10.7% (97,891) |
| Connecticut: | 10.8% (154,641) |
Number of households with income > $200k:| Old Lyme: | 16.0% (146,243) |
| State: | 16.3% (233,133) |
Aggregate household income in Old Lyme in 2022: $13,004,509,250
Median family income in Old Lyme in 2022:| Old Lyme: | $135,341 |
| State: | $115,183 |
Median non-family income in Old Lyme in 2022:| Old Lyme: | $63,601 |
| Connecticut: | $50,964 |
Change in median non-family income between 2000 and 2022:| Old Lyme, Connecticut: | +71.5% |
| Connecticut: | +65.1% |
Median per capita income in Old Lyme in 2022:| Old Lyme: | $75,707 |
| State: | $51,581 |
Change in median per capita income between 2000 and 2022:| Old Lyme, Connecticut: | +82.9% |
| State: | +79.3% |
Income statistics for White residents
Median household income in Old Lyme, CT in 2022:| Old Lyme: | $114,828 |
| State: | $96,890 |
Change in median household income between 2000 and 2022:| Old Lyme, Connecticut: | +69.4% |
| State: | +68.5% |
Number of households with income < $10k:| Old Lyme: | 4.2% (25,115) |
| Connecticut: | 4.2% (42,265) |
Number of households with income $10k - 20k:| Old Lyme: | 4.9% (28,876) |
| State: | 4.8% (48,323) |
Number of households with income $20k - 30k:| Old Lyme: | 5.8% (34,340) |
| State: | 5.7% (57,716) |
Number of households with income $30k - 40k:| Old Lyme: | 5.4% (31,787) |
| Connecticut: | 5.3% (53,827) |
Number of households with income $40k - 50k:| Old Lyme: | 5.3% (31,655) |
| State: | 5.3% (53,301) |
Number of households with income $50k - 60k:| Old Lyme: | 5.6% (32,943) |
| State: | 5.5% (55,690) |
Number of households with income $60k - 75k:| Old Lyme: | 7.9% (47,078) |
| Connecticut: | 8.0% (80,329) |
Number of households with income $75k - 100k:| Old Lyme: | 12.7% (75,437) |
| State: | 12.7% (128,070) |
Number of households with income $100k - 125k:| Old Lyme: | 10.0% (59,236) |
| State: | 10.0% (101,210) |
Number of households with income $125k - 150k:| Old Lyme: | 8.0% (47,556) |
| State: | 8.0% (81,250) |
Number of households with income $150k - 200k:| Old Lyme: | 11.8% (69,927) |
| State: | 11.8% (119,527) |
Number of households with income > $200k:| Old Lyme: | 18.4% (109,467) |
| State: | 18.6% (187,875) |
Aggregate household income in Old Lyme in 2022: $9,759,315,824
Median family income in Old Lyme in 2022:| Old Lyme: | $137,219 |
| Connecticut: | $128,955 |
Number of families with income < $10k:| Old Lyme: | 1.5% (35) |
| State: | 1.9% (11,537) |
Number of families with income $10k - 20k:| Old Lyme: | 1.3% (29) |
| State: | 1.8% (11,289) |
Number of families with income $20k - 30k:| Old Lyme: | 1.8% (43) |
| State: | 3.0% (18,506) |
Number of families with income $30k - 40k:| Old Lyme: | 2.9% (68) |
| State: | 2.9% (18,160) |
Number of families with income $40k - 50k:| Old Lyme: | 2.3% (54) |
| Connecticut: | 3.9% (24,550) |
Number of families with income $50k - 60k:| Old Lyme: | 3.1% (73) |
| State: | 4.3% (26,723) |
Number of families with income $60k - 75k:| Old Lyme: | 6.5% (153) |
| State: | 7.1% (44,075) |
Number of families with income $75k - 100k:| Old Lyme: | 9.1% (213) |
| Connecticut: | 12.5% (77,679) |
Number of families with income $100k - 125k:| Old Lyme: | 6.7% (158) |
| State: | 11.1% (69,086) |
Number of families with income $125k - 150k:| Old Lyme: | 11.1% (262) |
| Connecticut: | 9.6% (59,616) |
Number of families with income $150k - 200k:| Old Lyme: | 16.9% (397) |
| State: | 15.7% (97,890) |
Number of families with income > $200k:| Old Lyme: | 36.9% (866) |
| State: | 26.3% (163,417) |
Median non-family income in Old Lyme in 2022:| Old Lyme: | $64,418 |
| Connecticut: | $54,067 |
Change in median non-family income between 2000 and 2022:| Old Lyme, Connecticut: | +73.7% |
| Connecticut: | +68.7% |
Median per capita income in Old Lyme in 2022:| Old Lyme: | $79,449 |
| State: | $59,916 |
Change in median per capita income between 2000 and 2022:| Old Lyme, Connecticut: | +92.1% |
| State: | +90.2% |
Income statistics for Black or African American residents
Number of households with income < $10k:| Old Lyme: | 6.8% (16,664) |
| State: | 6.8% (9,494) |
Number of households with income $10k - 20k:| Old Lyme: | 7.9% (19,313) |
| Connecticut: | 7.9% (11,003) |
Number of households with income $20k - 30k:| Old Lyme: | 10.8% (26,407) |
| State: | 10.8% (15,045) |
Number of households with income $30k - 40k:| Old Lyme: | 8.2% (20,187) |
| State: | 8.2% (11,501) |
Number of households with income $40k - 50k:| Old Lyme: | 7.4% (18,283) |
| State: | 7.4% (10,416) |
Number of households with income $50k - 60k:| Old Lyme: | 7.5% (18,490) |
| Connecticut: | 7.5% (10,534) |
Number of households with income $60k - 75k:| Old Lyme: | 8.0% (19,736) |
| State: | 8.0% (11,244) |
Number of households with income $75k - 100k:| Old Lyme: | 9.6% (23,467) |
| State: | 9.6% (13,370) |
Number of households with income $100k - 125k:| Old Lyme: | 10.2% (25,001) |
| Connecticut: | 10.2% (14,244) |
Number of households with income $125k - 150k:| Old Lyme: | 8.0% (19,739) |
| State: | 8.0% (11,246) |
Number of households with income $150k - 200k:| Old Lyme: | 7.7% (18,828) |
| State: | 7.7% (10,727) |
Number of households with income > $200k:| Old Lyme: | 7.9% (19,458) |
| State: | 7.9% (11,086) |
Median per capita income in Old Lyme in 2022:| Old Lyme: | $63,022 |
| State: | $36,289 |
Change in median per capita income between 2000 and 2022:| Old Lyme, Connecticut: | +115.2% |
| Connecticut: | +117.5% |
Income statistics for Asian residents
Median household income in Old Lyme, CT in 2022:| Old Lyme: | $195,136 |
| State: | $110,568 |
Change in median household income between 2000 and 2022:| Old Lyme, Connecticut: | +110.1% |
| Connecticut: | +79.5% |
Number of households with income < $10k:| Old Lyme: | 7.1% (6,402) |
| State: | 7.1% (4,245) |
Number of households with income $10k - 20k:| Old Lyme: | 3.5% (3,148) |
| State: | 3.5% (2,087) |
Number of households with income $20k - 30k:| Old Lyme: | 4.1% (3,716) |
| Connecticut: | 4.1% (2,464) |
Number of households with income $30k - 40k:| Old Lyme: | 4.1% (3,738) |
| State: | 4.1% (2,478) |
Number of households with income $40k - 50k:| Old Lyme: | 3.3% (2,991) |
| Connecticut: | 3.3% (1,983) |
Number of households with income $50k - 60k:| Old Lyme: | 3.9% (3,511) |
| State: | 3.9% (2,328) |
Number of households with income $60k - 75k:| Old Lyme: | 7.0% (6,376) |
| Connecticut: | 7.0% (4,228) |
Number of households with income $75k - 100k:| Old Lyme: | 11.5% (10,423) |
| State: | 11.5% (6,911) |
Number of households with income $100k - 125k:| Old Lyme: | 10.2% (9,240) |
| Connecticut: | 10.2% (6,127) |
Number of households with income $125k - 150k:| Old Lyme: | 8.5% (7,660) |
| State: | 8.5% (5,079) |
Number of households with income $150k - 200k:| Old Lyme: | 12.4% (11,212) |
| State: | 12.4% (7,434) |
Number of households with income > $200k:| Old Lyme: | 24.4% (22,111) |
| State: | 24.4% (14,661) |
Aggregate household income in Old Lyme in 2022: $19,064,298
Median family income in Old Lyme in 2022:| Old Lyme: | $193,021 |
| State: | $134,548 |
Number of families with income $30k - 40k:| Old Lyme: | 12.2% (11) |
| Connecticut: | 3.8% (1,652) |
Number of families with income $75k - 100k:| Old Lyme: | 26.1% (24) |
| State: | 11.0% (4,844) |
Number of families with income $100k - 125k:| Old Lyme: | 25.1% (23) |
| Connecticut: | 10.5% (4,621) |
Number of families with income $150k - 200k:| Old Lyme: | 36.5% (33) |
| State: | 14.2% (6,237) |
Median per capita income in Old Lyme in 2022:| Old Lyme: | $136,220 |
| Connecticut: | $55,295 |
Change in median per capita income between 2000 and 2022:| Old Lyme, Connecticut: | +103.6% |
| State: | +97.8% |
Income statistics for Hispanic or Latino residents
Median household income in Old Lyme, CT in 2022:| Old Lyme: | $98,928 |
| State: | $60,275 |
Change in median household income between 2000 and 2022:| Old Lyme, Connecticut: | +67.8% |
| State: | +87.9% |
Number of households with income < $10k:| Old Lyme: | 8.7% (34,160) |
| State: | 8.7% (18,584) |
Number of households with income $10k - 20k:| Old Lyme: | 9.1% (35,356) |
| State: | 9.1% (19,235) |
Number of households with income $20k - 30k:| Old Lyme: | 8.9% (34,905) |
| State: | 8.9% (18,989) |
Number of households with income $30k - 40k:| Old Lyme: | 7.5% (29,349) |
| State: | 7.5% (15,967) |
Number of households with income $40k - 50k:| Old Lyme: | 8.7% (33,943) |
| Connecticut: | 8.7% (18,466) |
Number of households with income $50k - 60k:| Old Lyme: | 6.9% (27,032) |
| State: | 6.9% (14,706) |
Number of households with income $60k - 75k:| Old Lyme: | 8.9% (34,719) |
| State: | 8.9% (18,888) |
Number of households with income $75k - 100k:| Old Lyme: | 13.5% (52,697) |
| State: | 13.5% (28,669) |
Number of households with income $100k - 125k:| Old Lyme: | 8.2% (32,046) |
| State: | 8.2% (17,434) |
Number of households with income $125k - 150k:| Old Lyme: | 6.5% (25,278) |
| State: | 6.5% (13,752) |
Number of households with income $150k - 200k:| Old Lyme: | 6.6% (25,943) |
| Connecticut: | 6.6% (14,114) |
Number of households with income > $200k:| Old Lyme: | 6.4% (25,054) |
| State: | 6.4% (13,630) |
Aggregate household income in Old Lyme in 2022: $11,038,346
Median family income in Old Lyme in 2022:| Old Lyme: | $145,516 |
| State: | $68,336 |
Number of families with income < $10k:| Old Lyme: | 4.1% (18) |
| State: | 5.2% (7,456) |
Number of families with income $10k - 20k:| Old Lyme: | 5.6% (24) |
| Connecticut: | 6.0% (8,616) |
Number of families with income $20k - 30k:| Old Lyme: | 7.5% (32) |
| Connecticut: | 8.9% (12,680) |
Number of families with income $30k - 40k:| Old Lyme: | 9.0% (39) |
| State: | 8.5% (12,090) |
Number of families with income $40k - 50k:| Old Lyme: | 6.4% (27) |
| State: | 8.8% (12,624) |
Number of families with income $50k - 60k:| Old Lyme: | 7.7% (33) |
| Connecticut: | 8.4% (11,924) |
Number of families with income $60k - 75k:| Old Lyme: | 9.6% (41) |
| Connecticut: | 8.9% (12,677) |
Number of families with income $75k - 100k:| Old Lyme: | 13.0% (56) |
| Connecticut: | 14.3% (20,457) |
Number of families with income $100k - 125k:| Old Lyme: | 5.8% (25) |
| State: | 8.2% (11,720) |
Number of families with income $125k - 150k:| Old Lyme: | 11.5% (50) |
| Connecticut: | 8.2% (11,729) |
Number of families with income $150k - 200k:| Old Lyme: | 8.7% (37) |
| State: | 7.1% (10,096) |
Number of families with income > $200k:| Old Lyme: | 11.3% (49) |
| State: | 7.4% (10,622) |
Median non-family income in Old Lyme in 2022:| Old Lyme: | $67,380 |
| State: | $36,714 |
Change in median non-family income between 2000 and 2022:| Old Lyme, Connecticut: | +73.9% |
| State: | +90.0% |
Median per capita income in Old Lyme in 2022:| Old Lyme: | $45,070 |
| Connecticut: | $28,507 |
Change in median per capita income between 2000 and 2022:| Old Lyme, Connecticut: | +80.3% |
| State: | +117.2% |
Income statistics for American Indian and Alaska Native residents
Number of households with income < $10k:| Old Lyme: | 8.4% (739,906) |
| State: | 10.2% (340) |
Number of households with income $10k - 20k:| Old Lyme: | 9.4% (825,716) |
| Connecticut: | 8.5% (283) |
Number of households with income $20k - 30k:| Old Lyme: | 8.5% (746,870) |
| State: | 9.4% (314) |
Number of households with income $30k - 40k:| Old Lyme: | 9.1% (800,180) |
| Connecticut: | 10.1% (337) |
Number of households with income $40k - 50k:| Old Lyme: | 8.3% (733,979) |
| State: | 13.4% (447) |
Number of households with income $50k - 60k:| Old Lyme: | 7.8% (692,081) |
| Connecticut: | 3.1% (104) |
Number of households with income $60k - 75k:| Old Lyme: | 9.8% (862,648) |
| Connecticut: | 5.6% (188) |
Number of households with income $75k - 100k:| Old Lyme: | 12.6% (1,113,540) |
| State: | 13.4% (447) |
Number of households with income $100k - 125k:| Old Lyme: | 9.4% (832,706) |
| Connecticut: | 9.5% (317) |
Number of households with income $125k - 150k:| Old Lyme: | 5.6% (498,537) |
| State: | 3.9% (131) |
Number of households with income $150k - 200k:| Old Lyme: | 6.0% (525,553) |
| State: | 6.3% (212) |
Number of households with income > $200k:| Old Lyme: | 5.2% (454,896) |
| State: | 6.8% (228) |
Median per capita income in Old Lyme in 2022:| Old Lyme: | $159,933 |
| Connecticut: | $25,355 |
Change in median per capita income between 2000 and 2022:| Old Lyme, Connecticut: | +45.9% |
| State: | +39.4% |
Income statistics for Multirace residents
Number of households with income < $10k:| Old Lyme: | 6.0% (8,139) |
| State: | 6.0% (7,457) |
Number of households with income $10k - 20k:| Old Lyme: | 8.1% (11,066) |
| Connecticut: | 8.1% (10,139) |
Number of households with income $20k - 30k:| Old Lyme: | 7.0% (9,497) |
| State: | 7.0% (8,702) |
Number of households with income $30k - 40k:| Old Lyme: | 6.9% (9,327) |
| Connecticut: | 6.9% (8,546) |
Number of households with income $40k - 50k:| Old Lyme: | 7.0% (9,508) |
| State: | 7.0% (8,712) |
Number of households with income $50k - 60k:| Old Lyme: | 5.9% (8,001) |
| State: | 5.9% (7,331) |
Number of households with income $60k - 75k:| Old Lyme: | 8.5% (11,606) |
| State: | 8.5% (10,634) |
Number of households with income $75k - 100k:| Old Lyme: | 14.1% (19,209) |
| State: | 14.1% (17,600) |
Number of households with income $100k - 125k:| Old Lyme: | 9.9% (13,515) |
| State: | 9.9% (12,383) |
Number of households with income $125k - 150k:| Old Lyme: | 7.2% (9,736) |
| Connecticut: | 7.2% (8,921) |
Number of households with income $150k - 200k:| Old Lyme: | 8.8% (11,920) |
| Connecticut: | 8.8% (10,922) |
Number of households with income > $200k:| Old Lyme: | 10.6% (14,458) |
| State: | 10.6% (13,247) |
Median per capita income in Old Lyme in 2022:| Old Lyme: | $32,210 |
| Connecticut: | $32,794 |
Change in median per capita income between 2000 and 2022:| Old Lyme, Connecticut: | +95.5% |
| Connecticut: | +117.2% |
Income statistics for other residents
Number of households with income < $10k:| Old Lyme: | 8.9% (4) |
| State: | 9.0% (8,596) |
Number of households with income $10k - 20k:| Old Lyme: | 8.9% (4) |
| State: | 10.2% (9,773) |
Number of households with income $20k - 30k:| Old Lyme: | 8.9% (4) |
| State: | 9.1% (8,691) |
Number of households with income $30k - 40k:| Old Lyme: | 8.9% (4) |
| State: | 7.8% (7,447) |
Number of households with income $40k - 50k:| Old Lyme: | 6.7% (3) |
| Connecticut: | 8.2% (7,860) |
Number of households with income $50k - 60k:| Old Lyme: | 6.7% (3) |
| Connecticut: | 6.0% (5,757) |
Number of households with income $60k - 75k:| Old Lyme: | 8.9% (4) |
| State: | 9.3% (8,942) |
Number of households with income $75k - 100k:| Old Lyme: | 15.6% (7) |
| State: | 14.3% (13,700) |
Number of households with income $100k - 125k:| Old Lyme: | 6.7% (3) |
| Connecticut: | 7.2% (6,906) |
Number of households with income $125k - 150k:| Old Lyme: | 6.7% (3) |
| Connecticut: | 6.5% (6,215) |
Number of households with income $150k - 200k:| Old Lyme: | 6.7% (3) |
| State: | 6.1% (5,865) |
Number of households with income > $200k:| Old Lyme: | 6.7% (3) |
| State: | 6.3% (6,065) |
Aggregate household income in Old Lyme in 2022: $6,417,102
Median family income in Old Lyme in 2022:| Old Lyme: | $200,884 |
| State: | $67,610 |
Number of families with income $75k - 100k:| Old Lyme: | 100.0% (37) |
| Connecticut: | 15.7% (10,362) |
Median per capita income in Old Lyme in 2022:| Old Lyme: | $59,160 |
| State: | $29,353 |