Northwest Benton, Washington (WA) income map, earnings map, and wages data
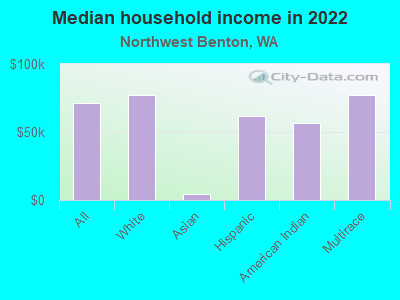
The median household income in Northwest Benton, WA in 2022 was $71,624, which was 27.5% less than the median annual income of $91,306 across the entire state of Washington. Compared to the median income of $39,396 in 2000 this represents an increase of 45.0%. The per capita income in 2022 was $27,744, which means an increase of 45.7% compared to 2000 when it was $15,073.
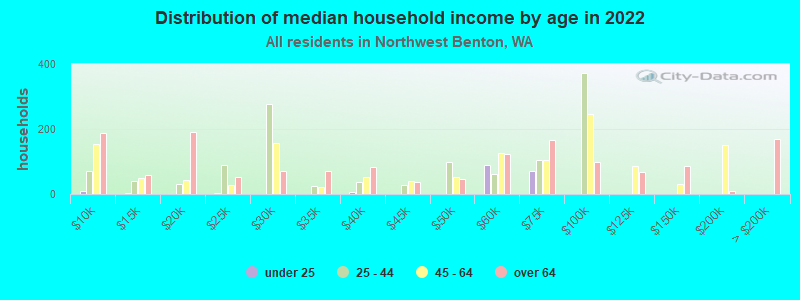
Income statistics for all residents
Median household income in Northwest Benton, WA in 2022:| Northwest Benton: | $71,624 |
| Washington: | $91,306 |
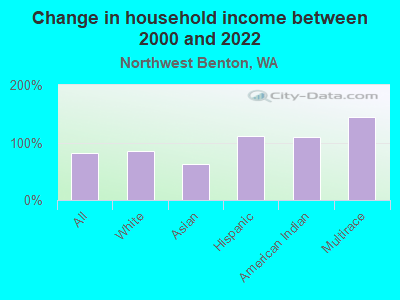
Change in median household income between 2000 and 2022:| Northwest Benton, Washington: | +81.8% |
| State: | +99.5% |
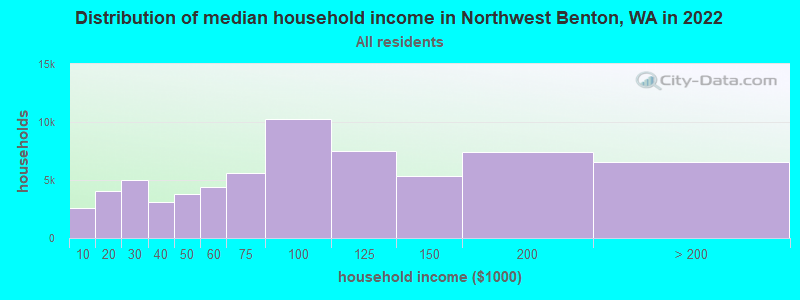
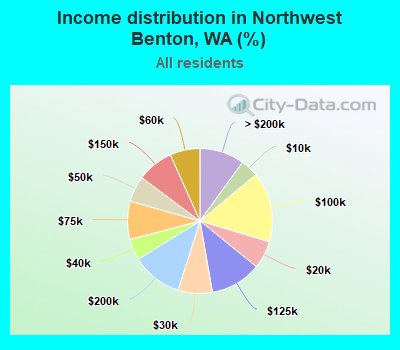
Number of households with income < $10k:| Northwest Benton: | 4.0% (2,624) |
| State: | 4.5% (139,331) |
Number of households with income $10k - 20k:| Northwest Benton: | 6.2% (4,058) |
| State: | 5.0% (154,508) |
Number of households with income $20k - 30k:| Northwest Benton: | 7.6% (5,001) |
| State: | 5.4% (166,555) |
Number of households with income $30k - 40k:| Northwest Benton: | 4.7% (3,102) |
| State: | 5.5% (170,324) |
Number of households with income $40k - 50k:| Northwest Benton: | 5.8% (3,792) |
| State: | 6.0% (183,941) |
Number of households with income $50k - 60k:| Northwest Benton: | 6.7% (4,380) |
| State: | 6.1% (187,395) |
Number of households with income $60k - 75k:| Northwest Benton: | 8.5% (5,584) |
| Washington: | 8.7% (266,771) |
Number of households with income $75k - 100k:| Northwest Benton: | 15.7% (10,260) |
| State: | 13.1% (404,672) |
Number of households with income $100k - 125k:| Northwest Benton: | 11.4% (7,479) |
| Washington: | 11.0% (337,911) |
Number of households with income $125k - 150k:| Northwest Benton: | 8.1% (5,308) |
| Washington: | 8.0% (244,934) |
Number of households with income $150k - 200k:| Northwest Benton: | 11.3% (7,380) |
| State: | 10.5% (323,812) |
Number of households with income > $200k:| Northwest Benton: | 10.0% (6,545) |
| State: | 16.2% (499,799) |
Aggregate household income in Northwest Benton in 2022: $673,753,706
Median family income in Northwest Benton in 2022:| Northwest Benton: | $79,106 |
| State: | $109,192 |
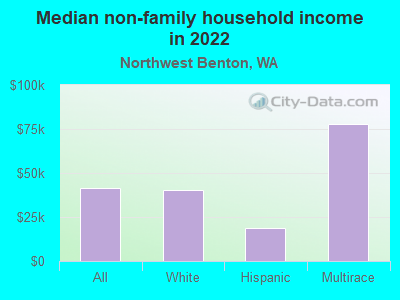
Median non-family income in Northwest Benton in 2022:| Northwest Benton: | $41,216 |
| Washington: | $57,299 |
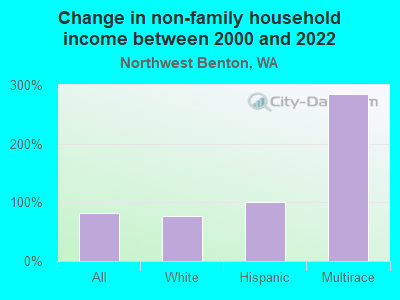
Change in median non-family income between 2000 and 2022:| Northwest Benton, Washington: | +81.5% |
| Washington: | +94.9% |
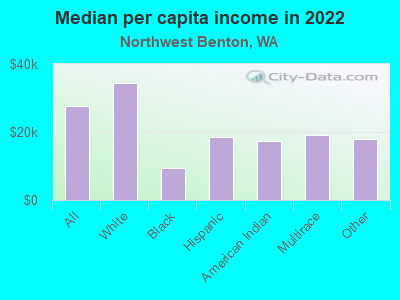
Median per capita income in Northwest Benton in 2022:| Northwest Benton: | $27,744 |
| State: | $50,764 |
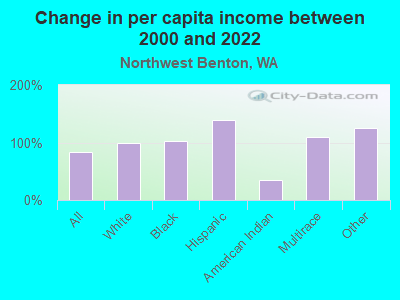
Change in median per capita income between 2000 and 2022:| Northwest Benton, Washington: | +84.1% |
| State: | +121.0% |
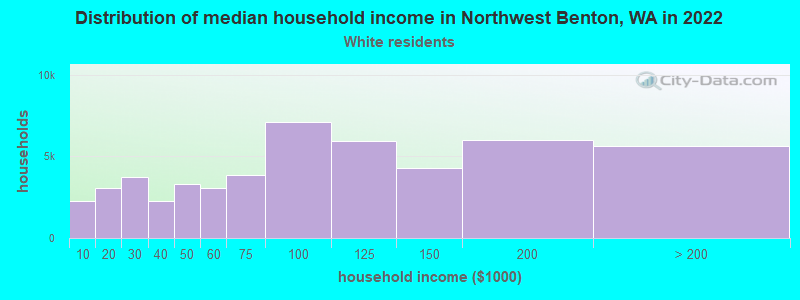
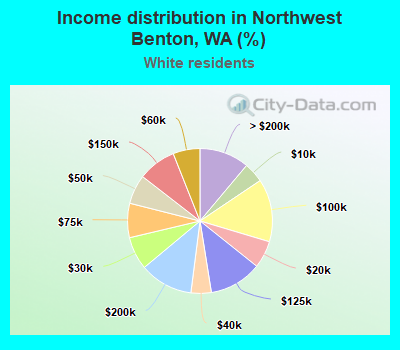
Income statistics for White residents
Median household income in Northwest Benton, WA in 2022:| Northwest Benton: | $77,054 |
| Washington: | $91,916 |
Change in median household income between 2000 and 2022:| Northwest Benton, Washington: | +85.2% |
| State: | +95.4% |
Number of households with income < $10k:| Northwest Benton: | 4.5% (2,267) |
| Washington: | 4.3% (95,850) |
Number of households with income $10k - 20k:| Northwest Benton: | 6.1% (3,082) |
| Washington: | 4.8% (106,421) |
Number of households with income $20k - 30k:| Northwest Benton: | 7.4% (3,726) |
| State: | 5.5% (122,860) |
Number of households with income $30k - 40k:| Northwest Benton: | 4.5% (2,297) |
| Washington: | 5.4% (119,627) |
Number of households with income $40k - 50k:| Northwest Benton: | 6.5% (3,315) |
| State: | 5.9% (132,276) |
Number of households with income $50k - 60k:| Northwest Benton: | 6.0% (3,038) |
| Washington: | 6.1% (136,212) |
Number of households with income $60k - 75k:| Northwest Benton: | 7.7% (3,876) |
| State: | 8.8% (196,086) |
Number of households with income $75k - 100k:| Northwest Benton: | 14.0% (7,107) |
| State: | 13.4% (299,192) |
Number of households with income $100k - 125k:| Northwest Benton: | 11.8% (5,956) |
| State: | 11.3% (252,209) |
Number of households with income $125k - 150k:| Northwest Benton: | 8.5% (4,305) |
| Washington: | 7.9% (175,962) |
Number of households with income $150k - 200k:| Northwest Benton: | 11.9% (6,034) |
| State: | 10.7% (239,156) |
Number of households with income > $200k:| Northwest Benton: | 11.1% (5,631) |
| State: | 16.1% (359,917) |
Aggregate household income in Northwest Benton in 2022: $460,889,006
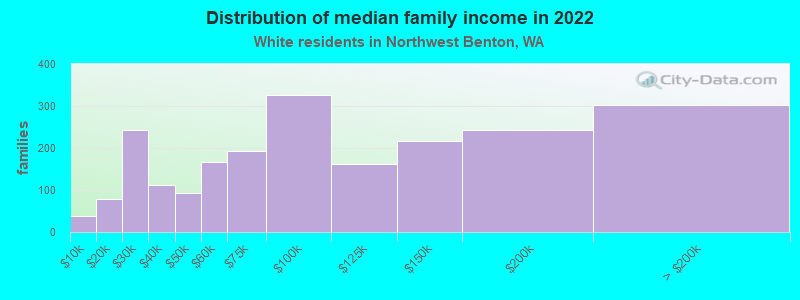
Median family income in Northwest Benton in 2022:| Northwest Benton: | $93,017 |
| Washington: | $112,511 |
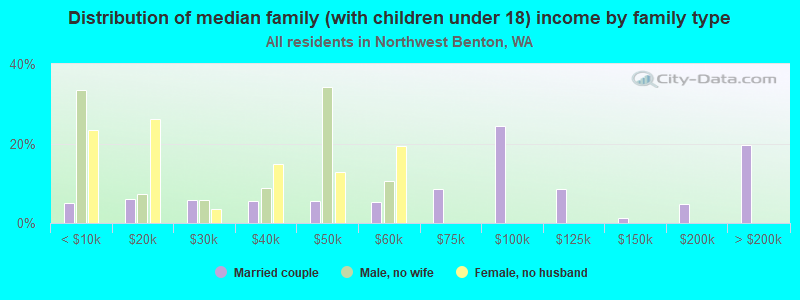
Number of families with income < $10k:| Northwest Benton: | 1.8% (39) |
| State: | 2.4% (33,676) |
Number of families with income $10k - 20k:| Northwest Benton: | 3.6% (79) |
| State: | 2.0% (28,228) |
Number of families with income $20k - 30k:| Northwest Benton: | 11.1% (242) |
| State: | 2.9% (39,288) |
Number of families with income $30k - 40k:| Northwest Benton: | 5.1% (111) |
| State: | 3.6% (50,190) |
Number of families with income $40k - 50k:| Northwest Benton: | 4.3% (93) |
| State: | 4.6% (63,009) |
Number of families with income $50k - 60k:| Northwest Benton: | 7.7% (167) |
| State: | 5.0% (69,270) |
Number of families with income $60k - 75k:| Northwest Benton: | 8.9% (193) |
| Washington: | 8.2% (112,369) |
Number of families with income $75k - 100k:| Northwest Benton: | 15.0% (327) |
| State: | 14.1% (194,214) |
Number of families with income $100k - 125k:| Northwest Benton: | 7.4% (162) |
| Washington: | 13.2% (182,184) |
Number of families with income $125k - 150k:| Northwest Benton: | 10.0% (216) |
| Washington: | 9.5% (130,928) |
Number of families with income $150k - 200k:| Northwest Benton: | 11.2% (243) |
| Washington: | 13.7% (188,621) |
Number of families with income > $200k:| Northwest Benton: | 13.9% (302) |
| State: | 20.8% (285,982) |
Median non-family income in Northwest Benton in 2022:| Northwest Benton: | $40,459 |
| Washington: | $56,103 |
Change in median non-family income between 2000 and 2022:| Northwest Benton, Washington: | +76.3% |
| Washington: | +87.7% |
Median per capita income in Northwest Benton in 2022:| Northwest Benton: | $34,537 |
| Washington: | $55,212 |
Change in median per capita income between 2000 and 2022:| Northwest Benton, Washington: | +99.1% |
| Washington: | +123.8% |
Income statistics for Black or African American residents
Number of households with income < $10k:| Northwest Benton: | 7.2% (2,107) |
| State: | 7.2% (8,014) |
Number of households with income $10k - 20k:| Northwest Benton: | 8.0% (2,342) |
| State: | 8.0% (8,904) |
Number of households with income $20k - 30k:| Northwest Benton: | 7.4% (2,158) |
| Washington: | 7.4% (8,207) |
Number of households with income $30k - 40k:| Northwest Benton: | 5.6% (1,636) |
| State: | 5.6% (6,220) |
Number of households with income $40k - 50k:| Northwest Benton: | 9.5% (2,783) |
| State: | 9.5% (10,585) |
Number of households with income $50k - 60k:| Northwest Benton: | 7.3% (2,124) |
| State: | 7.3% (8,078) |
Number of households with income $60k - 75k:| Northwest Benton: | 8.7% (2,552) |
| Washington: | 8.7% (9,704) |
Number of households with income $75k - 100k:| Northwest Benton: | 12.9% (3,764) |
| State: | 12.9% (14,315) |
Number of households with income $100k - 125k:| Northwest Benton: | 7.7% (2,259) |
| Washington: | 7.7% (8,592) |
Number of households with income $125k - 150k:| Northwest Benton: | 8.9% (2,588) |
| State: | 8.9% (9,840) |
Number of households with income $150k - 200k:| Northwest Benton: | 7.6% (2,218) |
| State: | 7.6% (8,434) |
Number of households with income > $200k:| Northwest Benton: | 9.1% (2,649) |
| Washington: | 9.1% (10,075) |
Median per capita income in Northwest Benton in 2022:| Northwest Benton: | $9,442 |
| State: | $38,209 |
Change in median per capita income between 2000 and 2022:| Northwest Benton, Washington: | +102.3% |
| State: | +115.3% |
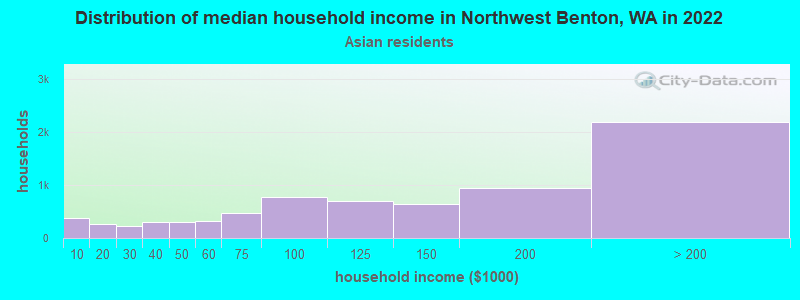
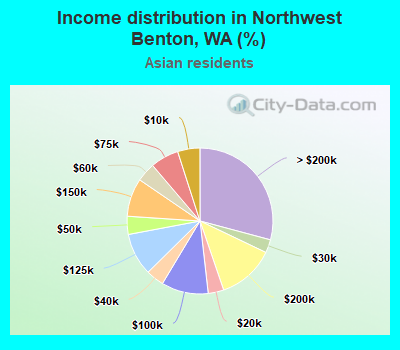
Income statistics for Asian residents
Median household income in Northwest Benton, WA in 2022:| Northwest Benton: | $4,061 |
| State: | $125,692 |
Change in median household income between 2000 and 2022:| Northwest Benton, Washington: | +62.5% |
| Washington: | +164.5% |
Number of households with income < $10k:| Northwest Benton: | 4.9% (370) |
| State: | 4.9% (14,099) |
Number of households with income $10k - 20k:| Northwest Benton: | 3.5% (260) |
| State: | 3.5% (9,873) |
Number of households with income $20k - 30k:| Northwest Benton: | 2.9% (219) |
| Washington: | 2.9% (8,352) |
Number of households with income $30k - 40k:| Northwest Benton: | 4.0% (300) |
| State: | 4.0% (11,415) |
Number of households with income $40k - 50k:| Northwest Benton: | 4.0% (301) |
| State: | 4.0% (11,421) |
Number of households with income $50k - 60k:| Northwest Benton: | 4.2% (318) |
| State: | 4.2% (12,100) |
Number of households with income $60k - 75k:| Northwest Benton: | 6.3% (471) |
| State: | 6.3% (17,903) |
Number of households with income $75k - 100k:| Northwest Benton: | 10.4% (780) |
| State: | 10.4% (29,663) |
Number of households with income $100k - 125k:| Northwest Benton: | 9.4% (706) |
| State: | 9.4% (26,839) |
Number of households with income $125k - 150k:| Northwest Benton: | 8.5% (636) |
| State: | 8.5% (24,200) |
Number of households with income $150k - 200k:| Northwest Benton: | 12.6% (948) |
| Washington: | 12.6% (35,976) |
Number of households with income > $200k:| Northwest Benton: | 29.2% (2,187) |
| State: | 29.2% (83,109) |
Median family income in Northwest Benton in 2022:| Northwest Benton: | $4,279 |
| State: | $143,595 |
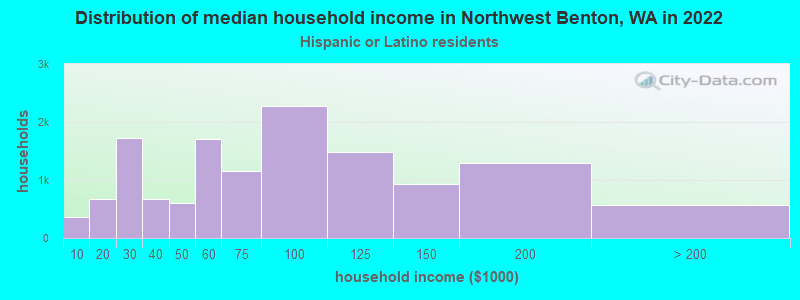
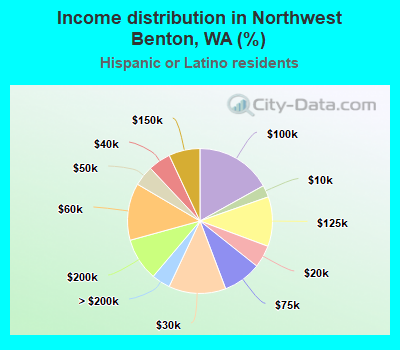
Income statistics for Hispanic or Latino residents
Median household income in Northwest Benton, WA in 2022:| Northwest Benton: | $61,820 |
| State: | $74,770 |
Change in median household income between 2000 and 2022:| Northwest Benton, Washington: | +110.9% |
| Washington: | +128.3% |
Number of households with income < $10k:| Northwest Benton: | 2.7% (358) |
| State: | 4.9% (14,456) |
Number of households with income $10k - 20k:| Northwest Benton: | 5.0% (676) |
| State: | 5.3% (15,449) |
Number of households with income $20k - 30k:| Northwest Benton: | 12.8% (1,717) |
| Washington: | 6.8% (20,016) |
Number of households with income $30k - 40k:| Northwest Benton: | 5.0% (679) |
| State: | 7.7% (22,548) |
Number of households with income $40k - 50k:| Northwest Benton: | 4.5% (607) |
| State: | 7.3% (21,450) |
Number of households with income $50k - 60k:| Northwest Benton: | 12.7% (1,715) |
| Washington: | 7.7% (22,744) |
Number of households with income $60k - 75k:| Northwest Benton: | 8.5% (1,149) |
| State: | 10.5% (30,737) |
Number of households with income $75k - 100k:| Northwest Benton: | 16.9% (2,278) |
| State: | 14.9% (43,843) |
Number of households with income $100k - 125k:| Northwest Benton: | 11.1% (1,490) |
| Washington: | 11.1% (32,554) |
Number of households with income $125k - 150k:| Northwest Benton: | 7.0% (936) |
| State: | 7.4% (21,624) |
Number of households with income $150k - 200k:| Northwest Benton: | 9.6% (1,285) |
| State: | 7.3% (21,360) |
Number of households with income > $200k:| Northwest Benton: | 4.2% (561) |
| State: | 9.2% (27,055) |
Aggregate household income in Northwest Benton in 2022: $226,565,645
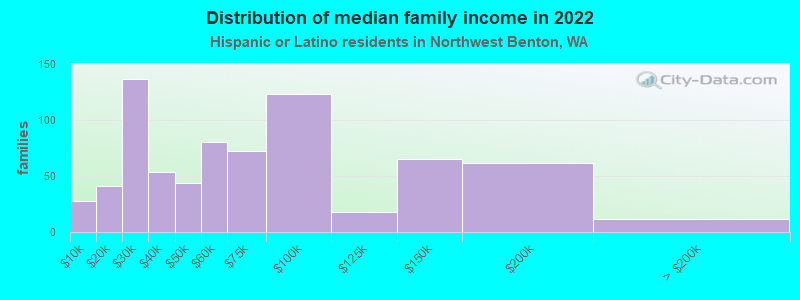
Median family income in Northwest Benton in 2022:| Northwest Benton: | $61,929 |
| Washington: | $76,866 |
Number of families with income < $10k:| Northwest Benton: | 3.9% (28) |
| State: | 4.4% (9,443) |
Number of families with income $10k - 20k:| Northwest Benton: | 5.6% (41) |
| State: | 3.5% (7,524) |
Number of families with income $20k - 30k:| Northwest Benton: | 18.7% (137) |
| State: | 5.6% (12,052) |
Number of families with income $30k - 40k:| Northwest Benton: | 7.3% (54) |
| State: | 8.3% (17,803) |
Number of families with income $40k - 50k:| Northwest Benton: | 6.0% (44) |
| Washington: | 7.7% (16,361) |
Number of families with income $50k - 60k:| Northwest Benton: | 10.8% (80) |
| Washington: | 7.9% (16,852) |
Number of families with income $60k - 75k:| Northwest Benton: | 9.8% (72) |
| Washington: | 11.4% (24,342) |
Number of families with income $75k - 100k:| Northwest Benton: | 16.7% (123) |
| Washington: | 14.4% (30,698) |
Number of families with income $100k - 125k:| Northwest Benton: | 2.4% (18) |
| State: | 11.4% (24,331) |
Number of families with income $125k - 150k:| Northwest Benton: | 8.8% (65) |
| State: | 7.5% (16,099) |
Number of families with income $150k - 200k:| Northwest Benton: | 8.4% (62) |
| State: | 8.2% (17,551) |
Number of families with income > $200k:| Northwest Benton: | 1.7% (12) |
| Washington: | 9.7% (20,653) |
Median non-family income in Northwest Benton in 2022:| Northwest Benton: | $18,481 |
| State: | $54,173 |
Change in median non-family income between 2000 and 2022:| Northwest Benton, Washington: | +99.8% |
| Washington: | +105.8% |
Median per capita income in Northwest Benton in 2022:| Northwest Benton: | $18,484 |
| State: | $28,252 |
Change in median per capita income between 2000 and 2022:| Northwest Benton, Washington: | +139.7% |
| State: | +150.2% |
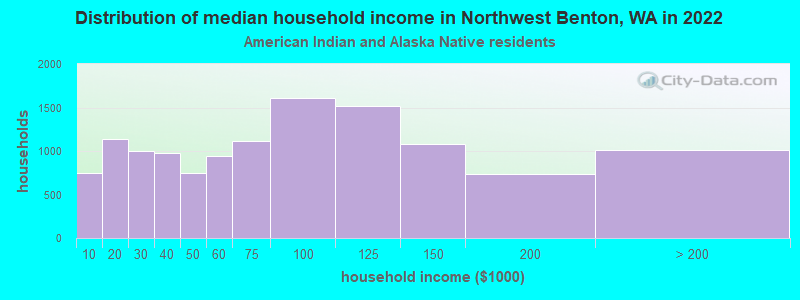
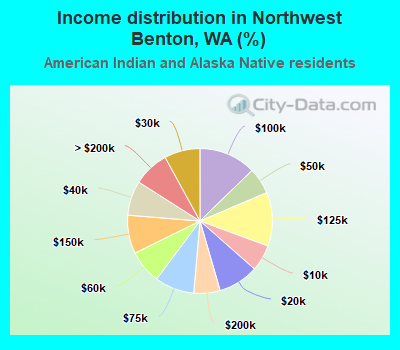
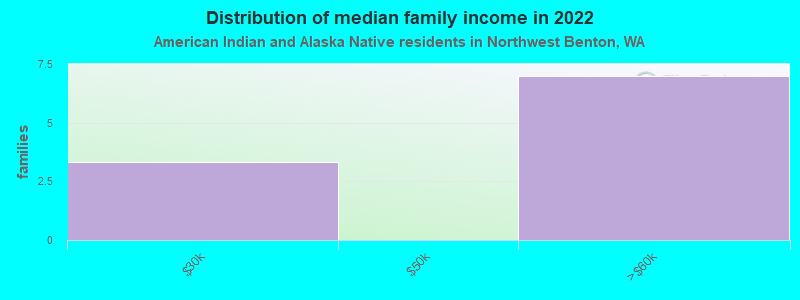
Income statistics for American Indian and Alaska Native residents
Median household income in Northwest Benton, WA in 2022:| Northwest Benton: | $56,970 |
| State: | $71,255 |
Change in median household income between 2000 and 2022:| Northwest Benton, Washington: | +108.5% |
| State: | +118.1% |
Number of households with income < $10k:| Northwest Benton: | 5.9% (742) |
| State: | 5.9% (1,768) |
Number of households with income $10k - 20k:| Northwest Benton: | 9.0% (1,134) |
| State: | 8.9% (2,694) |
Number of households with income $20k - 30k:| Northwest Benton: | 8.0% (1,003) |
| Washington: | 8.0% (2,412) |
Number of households with income $30k - 40k:| Northwest Benton: | 7.7% (972) |
| State: | 7.7% (2,327) |
Number of households with income $40k - 50k:| Northwest Benton: | 5.9% (742) |
| State: | 5.8% (1,755) |
Number of households with income $50k - 60k:| Northwest Benton: | 7.5% (944) |
| State: | 7.5% (2,259) |
Number of households with income $60k - 75k:| Northwest Benton: | 8.8% (1,114) |
| Washington: | 8.8% (2,669) |
Number of households with income $75k - 100k:| Northwest Benton: | 12.7% (1,605) |
| State: | 12.8% (3,861) |
Number of households with income $100k - 125k:| Northwest Benton: | 12.0% (1,515) |
| State: | 12.0% (3,618) |
Number of households with income $125k - 150k:| Northwest Benton: | 8.6% (1,082) |
| State: | 8.6% (2,580) |
Number of households with income $150k - 200k:| Northwest Benton: | 5.9% (740) |
| State: | 5.9% (1,774) |
Number of households with income > $200k:| Northwest Benton: | 8.0% (1,013) |
| Washington: | 8.1% (2,447) |
Aggregate household income in Northwest Benton in 2022: $1,839,004
Median family income in Northwest Benton in 2022:| Northwest Benton: | $33,385 |
| State: | $79,010 |
Median per capita income in Northwest Benton in 2022:| Northwest Benton: | $17,222 |
| State: | $27,053 |
Change in median per capita income between 2000 and 2022:| Northwest Benton, Washington: | +33.9% |
| Washington: | +98.6% |
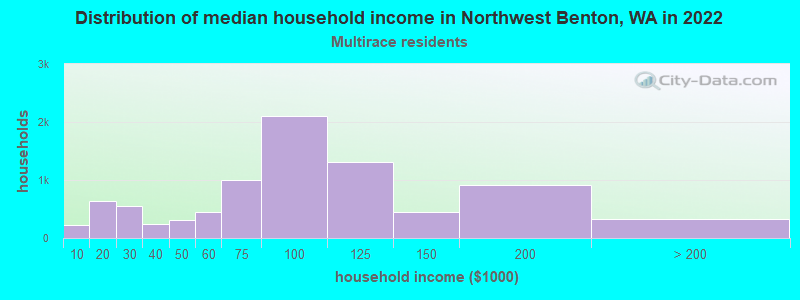
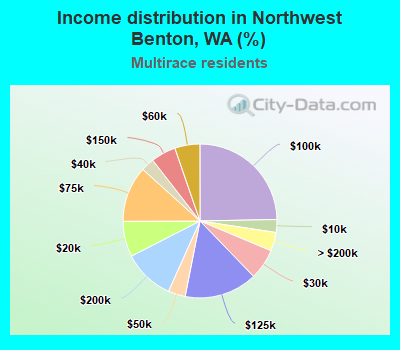
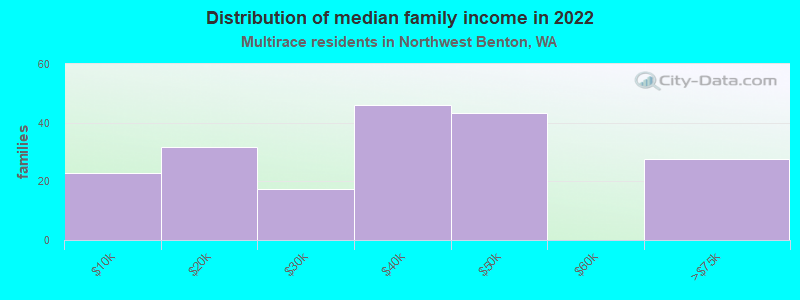
Income statistics for Multirace residents
Median household income in Northwest Benton, WA in 2022:| Northwest Benton: | $77,444 |
| State: | $84,303 |
Change in median household income between 2000 and 2022:| Northwest Benton, Washington: | +143.6% |
| Washington: | +125.7% |
Number of households with income < $10k:| Northwest Benton: | 2.7% (231) |
| State: | 4.3% (12,040) |
Number of households with income $10k - 20k:| Northwest Benton: | 7.5% (638) |
| State: | 6.6% (18,437) |
Number of households with income $20k - 30k:| Northwest Benton: | 6.5% (552) |
| State: | 5.2% (14,559) |
Number of households with income $30k - 40k:| Northwest Benton: | 2.8% (239) |
| State: | 6.7% (18,491) |
Number of households with income $40k - 50k:| Northwest Benton: | 3.6% (309) |
| Washington: | 6.3% (17,459) |
Number of households with income $50k - 60k:| Northwest Benton: | 5.3% (450) |
| State: | 6.9% (19,086) |
Number of households with income $60k - 75k:| Northwest Benton: | 11.7% (1,003) |
| State: | 9.1% (25,310) |
Number of households with income $75k - 100k:| Northwest Benton: | 24.7% (2,109) |
| Washington: | 13.5% (37,493) |
Number of households with income $100k - 125k:| Northwest Benton: | 15.3% (1,308) |
| State: | 10.7% (29,626) |
Number of households with income $125k - 150k:| Northwest Benton: | 5.2% (447) |
| Washington: | 8.6% (23,899) |
Number of households with income $150k - 200k:| Northwest Benton: | 10.8% (918) |
| Washington: | 10.2% (28,214) |
Number of households with income > $200k:| Northwest Benton: | 3.9% (334) |
| Washington: | 11.9% (32,947) |
Aggregate household income in Northwest Benton in 2022: $51,998,754
Median family income in Northwest Benton in 2022:| Northwest Benton: | $71,349 |
| Washington: | $95,629 |
Number of families with income < $10k:| Northwest Benton: | 12.1% (23) |
| State: | 3.5% (6,121) |
Number of families with income $10k - 20k:| Northwest Benton: | 16.7% (32) |
| Washington: | 4.3% (7,519) |
Number of families with income $20k - 30k:| Northwest Benton: | 9.2% (17) |
| State: | 4.4% (7,775) |
Number of families with income $30k - 40k:| Northwest Benton: | 24.4% (46) |
| State: | 5.8% (10,186) |
Number of families with income $40k - 50k:| Northwest Benton: | 23.0% (43) |
| State: | 5.9% (10,412) |
Number of families with income $60k - 75k:| Northwest Benton: | 14.7% (28) |
| Washington: | 9.7% (17,113) |
Median non-family income in Northwest Benton in 2022:| Northwest Benton: | $77,863 |
| Washington: | $56,573 |
Median per capita income in Northwest Benton in 2022:| Northwest Benton: | $19,190 |
| Washington: | $32,496 |
Change in median per capita income between 2000 and 2022:| Northwest Benton, Washington: | +110.0% |
| State: | +156.8% |
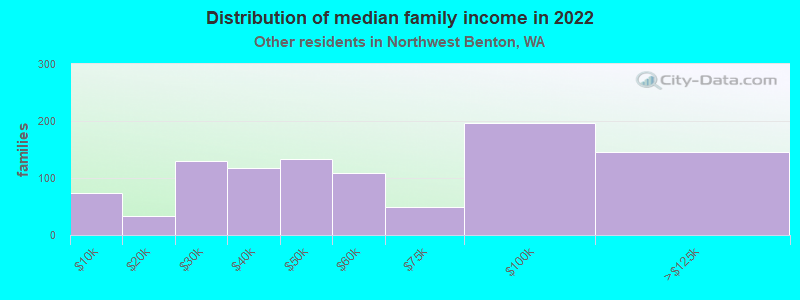
Income statistics for other residents
Number of households with income < $10k:| Northwest Benton: | 3.9% (43) |
| State: | 5.3% (6,540) |
Number of households with income $10k - 20k:| Northwest Benton: | 6.8% (76) |
| State: | 6.0% (7,385) |
Number of households with income $20k - 30k:| Northwest Benton: | 9.2% (102) |
| Washington: | 7.5% (9,289) |
Number of households with income $30k - 40k:| Northwest Benton: | 10.2% (114) |
| State: | 8.9% (11,015) |
Number of households with income $40k - 50k:| Northwest Benton: | 8.7% (97) |
| Washington: | 7.6% (9,399) |
Number of households with income $50k - 60k:| Northwest Benton: | 8.0% (89) |
| State: | 7.2% (8,867) |
Number of households with income $60k - 75k:| Northwest Benton: | 9.6% (107) |
| Washington: | 10.5% (13,032) |
Number of households with income $75k - 100k:| Northwest Benton: | 13.1% (146) |
| State: | 14.6% (18,007) |
Number of households with income $100k - 125k:| Northwest Benton: | 12.4% (138) |
| State: | 12.2% (15,128) |
Number of households with income $125k - 150k:| Northwest Benton: | 5.2% (58) |
| State: | 5.6% (6,950) |
Number of households with income $150k - 200k:| Northwest Benton: | 6.0% (67) |
| State: | 7.1% (8,749) |
Number of households with income > $200k:| Northwest Benton: | 6.8% (76) |
| State: | 7.5% (9,208) |
Aggregate household income in Northwest Benton in 2022: $93,879,848
Median family income in Northwest Benton in 2022:| Northwest Benton: | $56,338 |
| State: | $72,588 |
Number of families with income < $10k:| Northwest Benton: | 7.5% (74) |
| Washington: | 5.5% (5,287) |
Number of families with income $10k - 20k:| Northwest Benton: | 3.4% (34) |
| Washington: | 4.0% (3,814) |
Number of families with income $20k - 30k:| Northwest Benton: | 13.2% (130) |
| State: | 6.6% (6,293) |
Number of families with income $30k - 40k:| Northwest Benton: | 12.0% (118) |
| State: | 9.2% (8,827) |
Number of families with income $40k - 50k:| Northwest Benton: | 13.4% (133) |
| State: | 8.0% (7,634) |
Number of families with income $50k - 60k:| Northwest Benton: | 11.0% (108) |
| State: | 7.7% (7,357) |
Number of families with income $60k - 75k:| Northwest Benton: | 5.0% (49) |
| State: | 10.3% (9,864) |
Number of families with income $75k - 100k:| Northwest Benton: | 19.8% (196) |
| State: | 14.5% (13,800) |
Number of families with income $100k - 125k:| Northwest Benton: | 14.7% (145) |
| State: | 12.9% (12,298) |
Median per capita income in Northwest Benton in 2022:| Northwest Benton: | $17,883 |
| Washington: | $27,542 |
Change in median per capita income between 2000 and 2022:| Northwest Benton, Washington: | +126.1% |
| State: | +167.8% |