North Branford, Connecticut (CT) income map, earnings map, and wages data
The median household income in North Branford, CT in 2022 was $109,038, which was 18.9% greater than the median annual income of $88,429 across the entire state of Connecticut. Compared to the median income of $64,438 in 2000 this represents an increase of 40.9%. The per capita income in 2022 was $52,211, which means an increase of 45.3% compared to 2000 when it was $28,542.
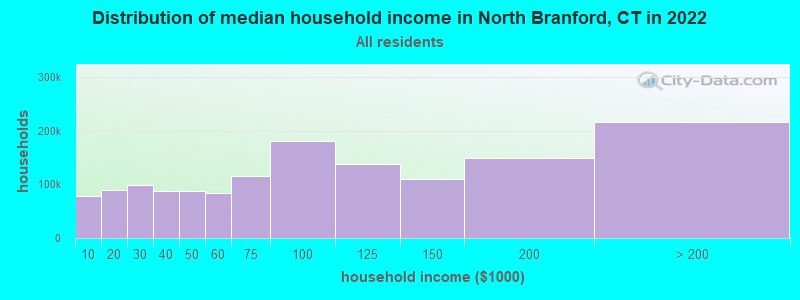
Income statistics for all residents
Median household income in North Branford, CT in 2022:| North Branford: | $109,038 |
| State: | $88,429 |
Change in median household income between 2000 and 2022:| North Branford, Connecticut: | +69.2% |
| State: | +64.0% |
Number of households with income < $10k:| North Branford: | 5.2% (44,413) |
| Connecticut: | 5.1% (72,746) |
Number of households with income $10k - 20k:| North Branford: | 5.8% (50,083) |
| State: | 5.7% (81,643) |
Number of households with income $20k - 30k:| North Branford: | 6.6% (56,689) |
| Connecticut: | 6.5% (92,844) |
Number of households with income $30k - 40k:| North Branford: | 5.9% (50,874) |
| State: | 5.9% (83,934) |
Number of households with income $40k - 50k:| North Branford: | 5.9% (50,548) |
| Connecticut: | 5.8% (83,025) |
Number of households with income $50k - 60k:| North Branford: | 5.8% (49,566) |
| State: | 5.7% (81,788) |
Number of households with income $60k - 75k:| North Branford: | 8.1% (69,448) |
| State: | 8.1% (115,651) |
Number of households with income $75k - 100k:| North Branford: | 12.6% (108,462) |
| State: | 12.6% (180,173) |
Number of households with income $100k - 125k:| North Branford: | 9.8% (84,436) |
| State: | 9.9% (141,231) |
Number of households with income $125k - 150k:| North Branford: | 7.8% (67,430) |
| State: | 7.9% (112,826) |
Number of households with income $150k - 200k:| North Branford: | 10.7% (92,239) |
| State: | 10.8% (154,641) |
Number of households with income > $200k:| North Branford: | 16.0% (137,800) |
| State: | 16.3% (233,133) |
Aggregate household income in North Branford in 2022: $16,879,084,115
Median family income in North Branford in 2022:| North Branford: | $128,257 |
| Connecticut: | $115,183 |
Median non-family income in North Branford in 2022:| North Branford: | $60,747 |
| State: | $50,964 |
Change in median non-family income between 2000 and 2022:| North Branford, Connecticut: | +71.5% |
| State: | +65.1% |
Median per capita income in North Branford in 2022:| North Branford: | $52,212 |
| State: | $51,581 |
Change in median per capita income between 2000 and 2022:| North Branford, Connecticut: | +82.9% |
| State: | +79.3% |
Income statistics for White residents
Median household income in North Branford, CT in 2022:| North Branford: | $107,630 |
| State: | $96,890 |
Change in median household income between 2000 and 2022:| North Branford, Connecticut: | +69.4% |
| Connecticut: | +68.5% |
Number of households with income < $10k:| North Branford: | 4.2% (23,541) |
| State: | 4.2% (42,265) |
Number of households with income $10k - 20k:| North Branford: | 4.9% (27,065) |
| State: | 4.8% (48,323) |
Number of households with income $20k - 30k:| North Branford: | 5.8% (32,188) |
| State: | 5.7% (57,716) |
Number of households with income $30k - 40k:| North Branford: | 5.4% (29,794) |
| Connecticut: | 5.3% (53,827) |
Number of households with income $40k - 50k:| North Branford: | 5.3% (29,672) |
| Connecticut: | 5.3% (53,301) |
Number of households with income $50k - 60k:| North Branford: | 5.6% (30,878) |
| State: | 5.5% (55,690) |
Number of households with income $60k - 75k:| North Branford: | 7.9% (44,127) |
| State: | 8.0% (80,329) |
Number of households with income $75k - 100k:| North Branford: | 12.7% (70,708) |
| Connecticut: | 12.7% (128,070) |
Number of households with income $100k - 125k:| North Branford: | 10.0% (55,523) |
| Connecticut: | 10.0% (101,210) |
Number of households with income $125k - 150k:| North Branford: | 8.0% (44,575) |
| Connecticut: | 8.0% (81,250) |
Number of households with income $150k - 200k:| North Branford: | 11.8% (65,544) |
| State: | 11.8% (119,527) |
Number of households with income > $200k:| North Branford: | 18.4% (102,606) |
| Connecticut: | 18.6% (187,875) |
Aggregate household income in North Branford in 2022: $12,573,293,930
Median family income in North Branford in 2022:| North Branford: | $131,383 |
| State: | $128,955 |
Number of families with income < $10k:| North Branford: | 1.5% (45) |
| State: | 1.9% (11,537) |
Number of families with income $10k - 20k:| North Branford: | 1.2% (37) |
| State: | 1.8% (11,289) |
Number of families with income $20k - 30k:| North Branford: | 2.5% (76) |
| State: | 3.0% (18,506) |
Number of families with income $30k - 40k:| North Branford: | 3.6% (109) |
| Connecticut: | 2.9% (18,160) |
Number of families with income $40k - 50k:| North Branford: | 4.6% (140) |
| State: | 3.9% (24,550) |
Number of families with income $50k - 60k:| North Branford: | 4.9% (149) |
| State: | 4.3% (26,723) |
Number of families with income $60k - 75k:| North Branford: | 11.0% (333) |
| Connecticut: | 7.1% (44,075) |
Number of families with income $75k - 100k:| North Branford: | 12.3% (375) |
| State: | 12.5% (77,679) |
Number of families with income $100k - 125k:| North Branford: | 19.3% (587) |
| Connecticut: | 11.1% (69,086) |
Number of families with income $125k - 150k:| North Branford: | 10.4% (315) |
| State: | 9.6% (59,616) |
Number of families with income $150k - 200k:| North Branford: | 11.7% (356) |
| Connecticut: | 15.7% (97,890) |
Number of families with income > $200k:| North Branford: | 17.0% (517) |
| Connecticut: | 26.3% (163,417) |
Median non-family income in North Branford in 2022:| North Branford: | $59,484 |
| State: | $54,067 |
Change in median non-family income between 2000 and 2022:| North Branford, Connecticut: | +73.7% |
| Connecticut: | +68.7% |
Median per capita income in North Branford in 2022:| North Branford: | $55,470 |
| State: | $59,916 |
Change in median per capita income between 2000 and 2022:| North Branford, Connecticut: | +92.1% |
| State: | +90.2% |
Income statistics for Black or African American residents
Median household income in North Branford, CT in 2022:| North Branford: | $115,653 |
| State: | $61,803 |
Change in median household income between 2000 and 2022:| North Branford, Connecticut: | +60.9% |
| Connecticut: | +76.1% |
Number of households with income < $10k:| North Branford: | 6.8% (19,439) |
| State: | 6.8% (9,494) |
Number of households with income $10k - 20k:| North Branford: | 7.9% (22,528) |
| State: | 7.9% (11,003) |
Number of households with income $20k - 30k:| North Branford: | 10.8% (30,805) |
| Connecticut: | 10.8% (15,045) |
Number of households with income $30k - 40k:| North Branford: | 8.2% (23,548) |
| State: | 8.2% (11,501) |
Number of households with income $40k - 50k:| North Branford: | 7.4% (21,326) |
| Connecticut: | 7.4% (10,416) |
Number of households with income $50k - 60k:| North Branford: | 7.5% (21,568) |
| State: | 7.5% (10,534) |
Number of households with income $60k - 75k:| North Branford: | 8.0% (23,022) |
| State: | 8.0% (11,244) |
Number of households with income $75k - 100k:| North Branford: | 9.6% (27,375) |
| State: | 9.6% (13,370) |
Number of households with income $100k - 125k:| North Branford: | 10.2% (29,164) |
| State: | 10.2% (14,244) |
Number of households with income $125k - 150k:| North Branford: | 8.0% (23,026) |
| State: | 8.0% (11,246) |
Number of households with income $150k - 200k:| North Branford: | 7.7% (21,963) |
| Connecticut: | 7.7% (10,727) |
Number of households with income > $200k:| North Branford: | 7.9% (22,698) |
| Connecticut: | 7.9% (11,086) |
Aggregate household income in North Branford in 2022: $17,933,975
Median family income in North Branford in 2022:| North Branford: | $66,197 |
| State: | $87,228 |
Number of families with income < $10k:| North Branford: | 12.6% (3) |
| Connecticut: | 3.8% (3,184) |
Number of families with income $20k - 30k:| North Branford: | 9.5% (2) |
| Connecticut: | 6.0% (5,015) |
Number of families with income $75k - 100k:| North Branford: | 77.9% (17) |
| State: | 12.7% (10,598) |
Median non-family income in North Branford in 2022:| North Branford: | $127,388 |
| State: | $38,608 |
Change in median non-family income between 2000 and 2022:| North Branford, Connecticut: | +77.0% |
| State: | +77.0% |
Median per capita income in North Branford in 2022:| North Branford: | $81,550 |
| State: | $36,289 |
Change in median per capita income between 2000 and 2022:| North Branford, Connecticut: | +115.2% |
| Connecticut: | +117.5% |
Income statistics for Asian residents
Median household income in North Branford, CT in 2022:| North Branford: | $182,497 |
| Connecticut: | $110,568 |
Change in median household income between 2000 and 2022:| North Branford, Connecticut: | +110.1% |
| State: | +79.5% |
Number of households with income < $10k:| North Branford: | 7.1% (5,987) |
| State: | 7.1% (4,245) |
Number of households with income $10k - 20k:| North Branford: | 3.5% (2,944) |
| Connecticut: | 3.5% (2,087) |
Number of households with income $20k - 30k:| North Branford: | 4.1% (3,475) |
| Connecticut: | 4.1% (2,464) |
Number of households with income $30k - 40k:| North Branford: | 4.1% (3,495) |
| State: | 4.1% (2,478) |
Number of households with income $40k - 50k:| North Branford: | 3.3% (2,797) |
| State: | 3.3% (1,983) |
Number of households with income $50k - 60k:| North Branford: | 3.9% (3,284) |
| State: | 3.9% (2,328) |
Number of households with income $60k - 75k:| North Branford: | 7.0% (5,963) |
| Connecticut: | 7.0% (4,228) |
Number of households with income $75k - 100k:| North Branford: | 11.5% (9,748) |
| State: | 11.5% (6,911) |
Number of households with income $100k - 125k:| North Branford: | 10.2% (8,642) |
| State: | 10.2% (6,127) |
Number of households with income $125k - 150k:| North Branford: | 8.5% (7,164) |
| State: | 8.5% (5,079) |
Number of households with income $150k - 200k:| North Branford: | 12.4% (10,485) |
| Connecticut: | 12.4% (7,434) |
Number of households with income > $200k:| North Branford: | 24.4% (20,679) |
| Connecticut: | 24.4% (14,661) |
Aggregate household income in North Branford in 2022: $11,187,354
Median family income in North Branford in 2022:| North Branford: | $177,005 |
| State: | $134,548 |
Number of families with income $60k - 75k:| North Branford: | 25.0% (7) |
| Connecticut: | 6.0% (2,651) |
Number of families with income $75k - 100k:| North Branford: | 75.0% (21) |
| State: | 11.0% (4,844) |
Median non-family income in North Branford in 2022:| North Branford: | $226,108 |
| Connecticut: | $63,785 |
Change in median non-family income between 2000 and 2022:| North Branford, Connecticut: | +148.6% |
| State: | +77.9% |
Median per capita income in North Branford in 2022:| North Branford: | $44,422 |
| State: | $55,295 |
Change in median per capita income between 2000 and 2022:| North Branford, Connecticut: | +103.6% |
| Connecticut: | +97.8% |
Income statistics for Hispanic or Latino residents
Median household income in North Branford, CT in 2022:| North Branford: | $130,742 |
| State: | $60,275 |
Change in median household income between 2000 and 2022:| North Branford, Connecticut: | +67.8% |
| Connecticut: | +87.9% |
Number of households with income < $10k:| North Branford: | 8.7% (45,145) |
| State: | 8.7% (18,584) |
Number of households with income $10k - 20k:| North Branford: | 9.1% (46,727) |
| State: | 9.1% (19,235) |
Number of households with income $20k - 30k:| North Branford: | 8.9% (46,128) |
| Connecticut: | 8.9% (18,989) |
Number of households with income $30k - 40k:| North Branford: | 7.5% (38,788) |
| Connecticut: | 7.5% (15,967) |
Number of households with income $40k - 50k:| North Branford: | 8.7% (44,858) |
| State: | 8.7% (18,466) |
Number of households with income $50k - 60k:| North Branford: | 6.9% (35,724) |
| State: | 6.9% (14,706) |
Number of households with income $60k - 75k:| North Branford: | 8.9% (45,884) |
| Connecticut: | 8.9% (18,888) |
Number of households with income $75k - 100k:| North Branford: | 13.5% (69,644) |
| Connecticut: | 13.5% (28,669) |
Number of households with income $100k - 125k:| North Branford: | 8.2% (42,351) |
| State: | 8.2% (17,434) |
Number of households with income $125k - 150k:| North Branford: | 6.5% (33,407) |
| State: | 6.5% (13,752) |
Number of households with income $150k - 200k:| North Branford: | 6.6% (34,286) |
| State: | 6.6% (14,114) |
Number of households with income > $200k:| North Branford: | 6.4% (33,111) |
| State: | 6.4% (13,630) |
Aggregate household income in North Branford in 2022: $33,458,908
Median family income in North Branford in 2022:| North Branford: | $129,031 |
| State: | $68,336 |
Number of families with income < $10k:| North Branford: | 3.2% (23) |
| State: | 5.2% (7,456) |
Number of families with income $10k - 20k:| North Branford: | 3.8% (27) |
| State: | 6.0% (8,616) |
Number of families with income $20k - 30k:| North Branford: | 8.2% (59) |
| State: | 8.9% (12,680) |
Number of families with income $30k - 40k:| North Branford: | 8.7% (62) |
| Connecticut: | 8.5% (12,090) |
Number of families with income $40k - 50k:| North Branford: | 10.1% (72) |
| State: | 8.8% (12,624) |
Number of families with income $50k - 60k:| North Branford: | 9.8% (70) |
| State: | 8.4% (11,924) |
Number of families with income $60k - 75k:| North Branford: | 12.5% (89) |
| State: | 8.9% (12,677) |
Number of families with income $75k - 100k:| North Branford: | 13.5% (97) |
| State: | 14.3% (20,457) |
Number of families with income $100k - 125k:| North Branford: | 13.1% (94) |
| State: | 8.2% (11,720) |
Number of families with income $125k - 150k:| North Branford: | 8.3% (60) |
| State: | 8.2% (11,729) |
Number of families with income $150k - 200k:| North Branford: | 4.7% (33) |
| Connecticut: | 7.1% (10,096) |
Number of families with income > $200k:| North Branford: | 4.1% (29) |
| Connecticut: | 7.4% (10,622) |
Median non-family income in North Branford in 2022:| North Branford: | $158,160 |
| State: | $36,714 |
Change in median non-family income between 2000 and 2022:| North Branford, Connecticut: | +73.9% |
| State: | +90.0% |
Median per capita income in North Branford in 2022:| North Branford: | $34,077 |
| State: | $28,507 |
Change in median per capita income between 2000 and 2022:| North Branford, Connecticut: | +80.3% |
| Connecticut: | +117.2% |
Income statistics for American Indian and Alaska Native residents
Median household income in North Branford, CT in 2022:| North Branford: | $78,535 |
| State: | $41,848 |
Change in median household income between 2000 and 2022:| North Branford, Connecticut: | +12.9% |
| Connecticut: | +12.9% |
Number of households with income < $10k:| North Branford: | 8.4% (197,863) |
| Connecticut: | 10.2% (340) |
Number of households with income $10k - 20k:| North Branford: | 9.4% (220,811) |
| State: | 8.5% (283) |
Number of households with income $20k - 30k:| North Branford: | 8.5% (199,726) |
| State: | 9.4% (314) |
Number of households with income $30k - 40k:| North Branford: | 9.1% (213,981) |
| State: | 10.1% (337) |
Number of households with income $40k - 50k:| North Branford: | 8.3% (196,278) |
| State: | 13.4% (447) |
Number of households with income $50k - 60k:| North Branford: | 7.8% (185,074) |
| Connecticut: | 3.1% (104) |
Number of households with income $60k - 75k:| North Branford: | 9.8% (230,687) |
| Connecticut: | 5.6% (188) |
Number of households with income $75k - 100k:| North Branford: | 12.6% (297,779) |
| Connecticut: | 13.4% (447) |
Number of households with income $100k - 125k:| North Branford: | 9.4% (222,680) |
| State: | 9.5% (317) |
Number of households with income $125k - 150k:| North Branford: | 5.6% (133,317) |
| State: | 3.9% (131) |
Number of households with income $150k - 200k:| North Branford: | 6.0% (140,542) |
| State: | 6.3% (212) |
Number of households with income > $200k:| North Branford: | 5.2% (121,647) |
| State: | 6.8% (228) |
Aggregate household income in North Branford in 2022: $1,393,660
Median family income in North Branford in 2022:| North Branford: | $95,080 |
| State: | $57,217 |
Number of families with income $60k - 75k:| North Branford: | 47.8% (13) |
| Connecticut: | 6.9% (139) |
Number of families with income $75k - 100k:| North Branford: | 52.2% (14) |
| State: | 17.4% (349) |
Median per capita income in North Branford in 2022:| North Branford: | $32,027 |
| Connecticut: | $25,355 |
Change in median per capita income between 2000 and 2022:| North Branford, Connecticut: | +45.9% |
| Connecticut: | +39.4% |
Income statistics for Multirace residents
Median household income in North Branford, CT in 2022:| North Branford: | $165,651 |
| Connecticut: | $77,277 |
Change in median household income between 2000 and 2022:| North Branford, Connecticut: | +119.4% |
| Connecticut: | +113.6% |
Number of households with income < $10k:| North Branford: | 6.0% (15,556) |
| State: | 6.0% (7,457) |
Number of households with income $10k - 20k:| North Branford: | 8.1% (21,150) |
| State: | 8.1% (10,139) |
Number of households with income $20k - 30k:| North Branford: | 7.0% (18,153) |
| Connecticut: | 7.0% (8,702) |
Number of households with income $30k - 40k:| North Branford: | 6.9% (17,827) |
| Connecticut: | 6.9% (8,546) |
Number of households with income $40k - 50k:| North Branford: | 7.0% (18,174) |
| State: | 7.0% (8,712) |
Number of households with income $50k - 60k:| North Branford: | 5.9% (15,293) |
| State: | 5.9% (7,331) |
Number of households with income $60k - 75k:| North Branford: | 8.5% (22,183) |
| State: | 8.5% (10,634) |
Number of households with income $75k - 100k:| North Branford: | 14.1% (36,715) |
| State: | 14.1% (17,600) |
Number of households with income $100k - 125k:| North Branford: | 9.9% (25,832) |
| State: | 9.9% (12,383) |
Number of households with income $125k - 150k:| North Branford: | 7.2% (18,610) |
| State: | 7.2% (8,921) |
Number of households with income $150k - 200k:| North Branford: | 8.8% (22,784) |
| Connecticut: | 8.8% (10,922) |
Number of households with income > $200k:| North Branford: | 10.6% (27,634) |
| State: | 10.6% (13,247) |
Aggregate household income in North Branford in 2022: $5,531,969
Median family income in North Branford in 2022:| North Branford: | $162,334 |
| State: | $84,255 |
Number of families with income $75k - 100k:| North Branford: | 100.0% (38) |
| State: | 14.5% (12,236) |
Median per capita income in North Branford in 2022:| North Branford: | $11,305 |
| Connecticut: | $32,794 |
Change in median per capita income between 2000 and 2022:| North Branford, Connecticut: | +95.5% |
| State: | +117.2% |
Income statistics for other residents
Number of households with income < $10k:| North Branford: | 8.7% (8) |
| Connecticut: | 9.0% (8,596) |
Number of households with income $10k - 20k:| North Branford: | 10.9% (10) |
| State: | 10.2% (9,773) |
Number of households with income $20k - 30k:| North Branford: | 8.7% (8) |
| Connecticut: | 9.1% (8,691) |
Number of households with income $30k - 40k:| North Branford: | 7.6% (7) |
| State: | 7.8% (7,447) |
Number of households with income $40k - 50k:| North Branford: | 8.7% (8) |
| State: | 8.2% (7,860) |
Number of households with income $50k - 60k:| North Branford: | 5.4% (5) |
| Connecticut: | 6.0% (5,757) |
Number of households with income $60k - 75k:| North Branford: | 8.7% (8) |
| State: | 9.3% (8,942) |
Number of households with income $75k - 100k:| North Branford: | 14.1% (13) |
| State: | 14.3% (13,700) |
Number of households with income $100k - 125k:| North Branford: | 7.6% (7) |
| Connecticut: | 7.2% (6,906) |
Number of households with income $125k - 150k:| North Branford: | 6.5% (6) |
| State: | 6.5% (6,215) |
Number of households with income $150k - 200k:| North Branford: | 6.5% (6) |
| Connecticut: | 6.1% (5,865) |
Number of households with income > $200k:| North Branford: | 6.5% (6) |
| State: | 6.3% (6,065) |
Aggregate household income in North Branford in 2022: $12,709,731
Median family income in North Branford in 2022:| North Branford: | $158,192 |
| Connecticut: | $67,610 |
Number of families with income $60k - 75k:| North Branford: | 36.9% (19) |
| State: | 9.4% (6,232) |
Number of families with income $75k - 100k:| North Branford: | 63.1% (32) |
| State: | 15.7% (10,362) |
Median non-family income in North Branford in 2022:| North Branford: | $84,932 |
| Connecticut: | $34,285 |
Change in median non-family income between 2000 and 2022:| North Branford, Connecticut: | +83.6% |
| State: | +83.6% |
Median per capita income in North Branford in 2022:| North Branford: | $35,473 |
| State: | $29,353 |