North Aurora, Colorado (CO) income map, earnings map, and wages data
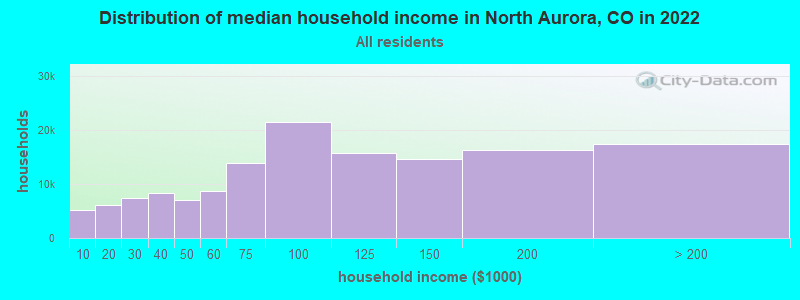
The median household income in North Aurora, CO in 2022 was $68,395, which was 30.6% less than the median annual income of $89,302 across the entire state of Colorado. Compared to the median income of $35,425 in 2000 this represents an increase of 48.2%. The per capita income in 2022 was $27,214, which means an increase of 50.0% compared to 2000 when it was $13,619.
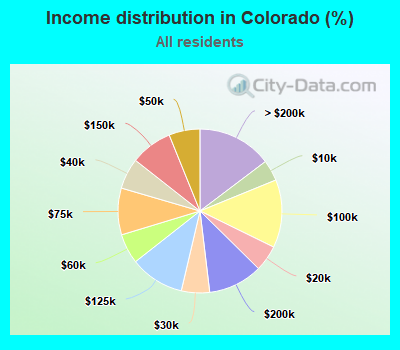
Income statistics for all residents
Median household income in North Aurora, CO in 2022:| North Aurora: | $68,395 |
| State: | $89,302 |
Change in median household income between 2000 and 2022:| North Aurora, Colorado: | +93.1% |
| State: | +89.2% |
Number of households with income < $10k:| North Aurora: | 3.7% (5,282) |
| State: | 4.1% (98,418) |
Number of households with income $10k - 20k:| North Aurora: | 4.3% (6,107) |
| State: | 5.1% (122,364) |
Number of households with income $20k - 30k:| North Aurora: | 5.2% (7,380) |
| State: | 5.6% (132,834) |
Number of households with income $30k - 40k:| North Aurora: | 5.9% (8,380) |
| State: | 6.1% (144,999) |
Number of households with income $40k - 50k:| North Aurora: | 5.0% (7,146) |
| State: | 6.1% (145,852) |
Number of households with income $50k - 60k:| North Aurora: | 6.1% (8,712) |
| State: | 5.9% (140,683) |
Number of households with income $60k - 75k:| North Aurora: | 9.7% (13,837) |
| Colorado: | 9.2% (219,992) |
Number of households with income $75k - 100k:| North Aurora: | 15.1% (21,532) |
| State: | 13.4% (319,980) |
Number of households with income $100k - 125k:| North Aurora: | 11.0% (15,727) |
| State: | 10.7% (255,638) |
Number of households with income $125k - 150k:| North Aurora: | 10.3% (14,698) |
| State: | 8.3% (197,264) |
Number of households with income $150k - 200k:| North Aurora: | 11.5% (16,382) |
| Colorado: | 10.7% (255,855) |
Number of households with income > $200k:| North Aurora: | 12.3% (17,531) |
| State: | 14.7% (350,705) |
Aggregate household income in North Aurora in 2022: $5,314,829,216
Median family income in North Aurora in 2022:| North Aurora: | $74,527 |
| State: | $109,592 |
Median non-family income in North Aurora in 2022:| North Aurora: | $50,468 |
| Colorado: | $57,553 |
Change in median non-family income between 2000 and 2022:| North Aurora, Colorado: | +86.6% |
| Colorado: | +87.3% |
Median per capita income in North Aurora in 2022:| North Aurora: | $27,215 |
| State: | $49,071 |
Change in median per capita income between 2000 and 2022:| North Aurora, Colorado: | +99.8% |
| Colorado: | +104.0% |
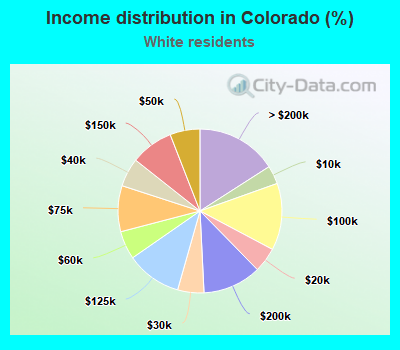
Income statistics for White residents
Median household income in North Aurora, CO in 2022:| North Aurora: | $74,059 |
| State: | $93,728 |
Change in median household income between 2000 and 2022:| North Aurora, Colorado: | +97.4% |
| Colorado: | +89.9% |
Number of households with income < $10k:| North Aurora: | 3.9% (3,553) |
| Colorado: | 3.6% (65,804) |
Number of households with income $10k - 20k:| North Aurora: | 3.5% (3,196) |
| State: | 4.9% (89,486) |
Number of households with income $20k - 30k:| North Aurora: | 4.2% (3,833) |
| Colorado: | 5.2% (94,191) |
Number of households with income $30k - 40k:| North Aurora: | 5.2% (4,728) |
| State: | 5.7% (102,893) |
Number of households with income $40k - 50k:| North Aurora: | 4.3% (3,884) |
| Colorado: | 5.9% (107,296) |
Number of households with income $50k - 60k:| North Aurora: | 6.1% (5,570) |
| State: | 5.6% (101,466) |
Number of households with income $60k - 75k:| North Aurora: | 9.6% (8,702) |
| Colorado: | 9.1% (164,790) |
Number of households with income $75k - 100k:| North Aurora: | 14.6% (13,278) |
| State: | 13.2% (240,038) |
Number of households with income $100k - 125k:| North Aurora: | 11.2% (10,186) |
| Colorado: | 10.9% (198,757) |
Number of households with income $125k - 150k:| North Aurora: | 11.1% (10,048) |
| State: | 8.4% (153,274) |
Number of households with income $150k - 200k:| North Aurora: | 12.5% (11,373) |
| State: | 11.5% (209,587) |
Number of households with income > $200k:| North Aurora: | 13.7% (12,479) |
| State: | 15.9% (289,583) |
Aggregate household income in North Aurora in 2022: $2,360,138,251
Median family income in North Aurora in 2022:| North Aurora: | $87,342 |
| State: | $118,609 |
Number of families with income < $10k:| North Aurora: | 3.3% (107) |
| State: | 1.8% (19,398) |
Number of families with income $10k - 20k:| North Aurora: | 7.4% (243) |
| Colorado: | 2.1% (22,547) |
Number of families with income $20k - 30k:| North Aurora: | 6.8% (224) |
| State: | 3.0% (32,904) |
Number of families with income $30k - 40k:| North Aurora: | 9.2% (303) |
| State: | 3.9% (43,092) |
Number of families with income $40k - 50k:| North Aurora: | 7.4% (241) |
| Colorado: | 4.4% (47,667) |
Number of families with income $50k - 60k:| North Aurora: | 7.0% (231) |
| State: | 4.3% (47,498) |
Number of families with income $60k - 75k:| North Aurora: | 12.2% (398) |
| State: | 7.9% (85,731) |
Number of families with income $75k - 100k:| North Aurora: | 15.6% (510) |
| State: | 13.1% (143,181) |
Number of families with income $100k - 125k:| North Aurora: | 6.6% (217) |
| State: | 12.4% (135,853) |
Number of families with income $125k - 150k:| North Aurora: | 10.1% (329) |
| State: | 10.2% (110,909) |
Number of families with income $150k - 200k:| North Aurora: | 4.1% (134) |
| State: | 15.0% (163,392) |
Number of families with income > $200k:| North Aurora: | 10.4% (340) |
| Colorado: | 22.0% (239,847) |
Median non-family income in North Aurora in 2022:| North Aurora: | $56,027 |
| State: | $60,225 |
Change in median non-family income between 2000 and 2022:| North Aurora, Colorado: | +92.6% |
| State: | +92.3% |
Median per capita income in North Aurora in 2022:| North Aurora: | $34,280 |
| State: | $55,103 |
Change in median per capita income between 2000 and 2022:| North Aurora, Colorado: | +122.1% |
| Colorado: | +112.2% |
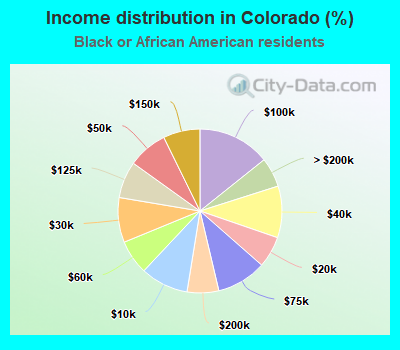
Income statistics for Black or African American residents
Median household income in North Aurora, CO in 2022:| North Aurora: | $67,143 |
| State: | $60,810 |
Change in median household income between 2000 and 2022:| North Aurora, Colorado: | +119.6% |
| State: | +66.4% |
Number of households with income < $10k:| North Aurora: | 4.3% (237) |
| Colorado: | 9.4% (8,425) |
Number of households with income $10k - 20k:| North Aurora: | 12.3% (679) |
| State: | 6.2% (5,512) |
Number of households with income $20k - 30k:| North Aurora: | 11.4% (633) |
| State: | 8.8% (7,891) |
Number of households with income $30k - 40k:| North Aurora: | 4.4% (246) |
| Colorado: | 10.2% (9,093) |
Number of households with income $40k - 50k:| North Aurora: | 6.9% (379) |
| State: | 7.8% (6,972) |
Number of households with income $50k - 60k:| North Aurora: | 6.0% (330) |
| Colorado: | 6.8% (6,065) |
Number of households with income $60k - 75k:| North Aurora: | 1.6% (86) |
| State: | 9.8% (8,769) |
Number of households with income $75k - 100k:| North Aurora: | 25.0% (1,382) |
| Colorado: | 14.3% (12,733) |
Number of households with income $100k - 125k:| North Aurora: | 3.9% (213) |
| Colorado: | 7.3% (6,469) |
Number of households with income $125k - 150k:| North Aurora: | 11.4% (631) |
| State: | 7.3% (6,483) |
Number of households with income $150k - 200k:| North Aurora: | 3.7% (205) |
| State: | 6.2% (5,571) |
Number of households with income > $200k:| North Aurora: | 9.2% (510) |
| State: | 5.8% (5,184) |
Aggregate household income in North Aurora in 2022: $265,108,577
Median family income in North Aurora in 2022:| North Aurora: | $80,012 |
| Colorado: | $75,092 |
Number of families with income < $10k:| North Aurora: | 9.1% (137) |
| State: | 4.8% (2,472) |
Number of families with income $10k - 20k:| North Aurora: | 8.4% (127) |
| State: | 5.2% (2,718) |
Number of families with income $20k - 30k:| North Aurora: | 13.0% (196) |
| Colorado: | 7.0% (3,630) |
Number of families with income $30k - 40k:| North Aurora: | 18.3% (277) |
| State: | 9.2% (4,786) |
Number of families with income $40k - 50k:| North Aurora: | 10.7% (162) |
| State: | 6.3% (3,246) |
Number of families with income $50k - 60k:| North Aurora: | 8.9% (134) |
| Colorado: | 7.3% (3,786) |
Number of families with income $60k - 75k:| North Aurora: | 8.9% (134) |
| Colorado: | 10.2% (5,290) |
Number of families with income $75k - 100k:| North Aurora: | 6.2% (94) |
| State: | 15.6% (8,078) |
Number of families with income $100k - 125k:| North Aurora: | 8.6% (130) |
| State: | 10.0% (5,184) |
Number of families with income $125k - 150k:| North Aurora: | 5.8% (87) |
| Colorado: | 8.1% (4,209) |
Number of families with income > $200k:| North Aurora: | 2.1% (31) |
| Colorado: | 6.9% (3,593) |
Median non-family income in North Aurora in 2022:| North Aurora: | $52,167 |
| Colorado: | $42,330 |
Change in median non-family income between 2000 and 2022:| North Aurora, Colorado: | +119.3% |
| Colorado: | +62.6% |
Median per capita income in North Aurora in 2022:| North Aurora: | $24,457 |
| Colorado: | $31,796 |
Change in median per capita income between 2000 and 2022:| North Aurora, Colorado: | +84.9% |
| State: | +78.2% |
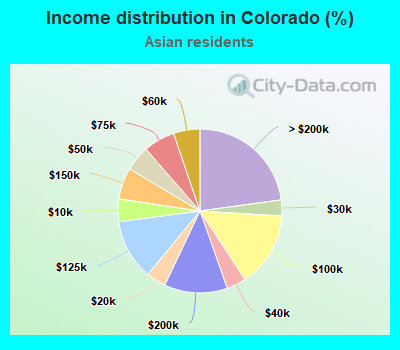
Income statistics for Asian residents
Median household income in North Aurora, CO in 2022:| North Aurora: | $53,933 |
| State: | $105,863 |
Change in median household income between 2000 and 2022:| North Aurora, Colorado: | +66.2% |
| State: | +117.7% |
Number of households with income < $10k:| North Aurora: | 0.0% (0) |
| Colorado: | 4.5% (2,969) |
Number of households with income $10k - 20k:| North Aurora: | 7.4% (329) |
| State: | 3.9% (2,588) |
Number of households with income $20k - 30k:| North Aurora: | 3.9% (174) |
| State: | 3.2% (2,095) |
Number of households with income $30k - 40k:| North Aurora: | 8.4% (375) |
| Colorado: | 3.8% (2,550) |
Number of households with income $40k - 50k:| North Aurora: | 4.8% (215) |
| Colorado: | 5.0% (3,296) |
Number of households with income $50k - 60k:| North Aurora: | 3.9% (172) |
| State: | 5.2% (3,455) |
Number of households with income $60k - 75k:| North Aurora: | 9.5% (421) |
| Colorado: | 6.2% (4,123) |
Number of households with income $75k - 100k:| North Aurora: | 26.6% (1,184) |
| Colorado: | 14.8% (9,789) |
Number of households with income $100k - 125k:| North Aurora: | 7.4% (331) |
| State: | 11.9% (7,917) |
Number of households with income $125k - 150k:| North Aurora: | 5.6% (249) |
| State: | 6.2% (4,125) |
Number of households with income $150k - 200k:| North Aurora: | 6.6% (294) |
| State: | 12.5% (8,268) |
Number of households with income > $200k:| North Aurora: | 15.8% (703) |
| Colorado: | 22.8% (15,156) |
Aggregate household income in North Aurora in 2022: $57,192,717
Median family income in North Aurora in 2022:| North Aurora: | $70,340 |
| State: | $131,786 |
Number of families with income < $10k:| North Aurora: | 5.0% (17) |
| State: | 2.3% (988) |
Number of families with income $10k - 20k:| North Aurora: | 1.4% (5) |
| State: | 1.5% (629) |
Number of families with income $20k - 30k:| North Aurora: | 9.1% (32) |
| State: | 3.6% (1,533) |
Number of families with income $30k - 40k:| North Aurora: | 4.0% (14) |
| State: | 2.8% (1,222) |
Number of families with income $40k - 50k:| North Aurora: | 6.9% (24) |
| State: | 2.8% (1,199) |
Number of families with income $50k - 60k:| North Aurora: | 8.4% (30) |
| Colorado: | 4.0% (1,740) |
Number of families with income $60k - 75k:| North Aurora: | 5.0% (18) |
| State: | 5.2% (2,231) |
Number of families with income $75k - 100k:| North Aurora: | 11.1% (39) |
| Colorado: | 14.1% (6,096) |
Number of families with income > $200k:| North Aurora: | 49.1% (173) |
| State: | 30.5% (13,159) |
Median non-family income in North Aurora in 2022:| North Aurora: | $52,771 |
| State: | $67,598 |
Change in median non-family income between 2000 and 2022:| North Aurora, Colorado: | +132.9% |
| State: | +132.9% |
Median per capita income in North Aurora in 2022:| North Aurora: | $30,652 |
| State: | $54,724 |
Change in median per capita income between 2000 and 2022:| North Aurora, Colorado: | +104.9% |
| State: | +161.1% |
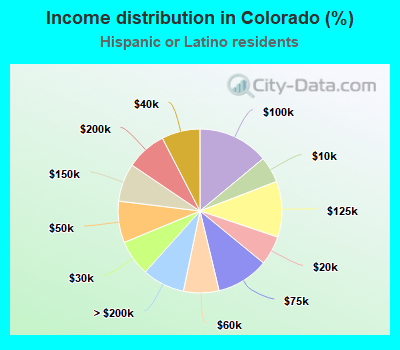
Income statistics for Hispanic or Latino residents
Median household income in North Aurora, CO in 2022:| North Aurora: | $65,123 |
| Colorado: | $72,989 |
Change in median household income between 2000 and 2022:| North Aurora, Colorado: | +105.9% |
| Colorado: | +110.1% |
Number of households with income < $10k:| North Aurora: | 4.0% (2,022) |
| State: | 5.2% (21,051) |
Number of households with income $10k - 20k:| North Aurora: | 4.3% (2,197) |
| Colorado: | 5.8% (23,416) |
Number of households with income $20k - 30k:| North Aurora: | 6.1% (3,080) |
| Colorado: | 7.1% (28,877) |
Number of households with income $30k - 40k:| North Aurora: | 7.7% (3,880) |
| Colorado: | 7.6% (30,782) |
Number of households with income $40k - 50k:| North Aurora: | 6.7% (3,381) |
| State: | 8.2% (33,247) |
Number of households with income $50k - 60k:| North Aurora: | 5.6% (2,813) |
| Colorado: | 7.0% (28,435) |
Number of households with income $60k - 75k:| North Aurora: | 10.3% (5,196) |
| State: | 10.3% (41,925) |
Number of households with income $75k - 100k:| North Aurora: | 14.7% (7,425) |
| State: | 14.0% (56,755) |
Number of households with income $100k - 125k:| North Aurora: | 11.1% (5,630) |
| Colorado: | 11.0% (44,664) |
Number of households with income $125k - 150k:| North Aurora: | 8.4% (4,261) |
| Colorado: | 7.5% (30,503) |
Number of households with income $150k - 200k:| North Aurora: | 10.4% (5,260) |
| State: | 8.0% (32,311) |
Number of households with income > $200k:| North Aurora: | 10.8% (5,489) |
| Colorado: | 8.4% (34,000) |
Aggregate household income in North Aurora in 2022: $761,257,347
Median family income in North Aurora in 2022:| North Aurora: | $65,246 |
| State: | $80,638 |
Number of families with income < $10k:| North Aurora: | 6.3% (149) |
| State: | 3.9% (11,122) |
Number of families with income $10k - 20k:| North Aurora: | 9.5% (226) |
| State: | 3.9% (11,122) |
Number of families with income $20k - 30k:| North Aurora: | 8.1% (192) |
| State: | 5.8% (16,614) |
Number of families with income $30k - 40k:| North Aurora: | 12.8% (304) |
| State: | 6.5% (18,485) |
Number of families with income $40k - 50k:| North Aurora: | 9.2% (220) |
| State: | 7.8% (22,403) |
Number of families with income $50k - 60k:| North Aurora: | 8.7% (207) |
| Colorado: | 7.0% (19,982) |
Number of families with income $60k - 75k:| North Aurora: | 13.6% (324) |
| State: | 11.8% (33,620) |
Number of families with income $75k - 100k:| North Aurora: | 11.2% (267) |
| Colorado: | 15.2% (43,334) |
Number of families with income $100k - 125k:| North Aurora: | 6.0% (143) |
| Colorado: | 12.1% (34,536) |
Number of families with income $125k - 150k:| North Aurora: | 8.2% (195) |
| Colorado: | 8.2% (23,333) |
Number of families with income $150k - 200k:| North Aurora: | 1.0% (24) |
| Colorado: | 8.5% (24,345) |
Number of families with income > $200k:| North Aurora: | 5.4% (127) |
| Colorado: | 9.3% (26,653) |
Median non-family income in North Aurora in 2022:| North Aurora: | $41,724 |
| Colorado: | $45,739 |
Change in median non-family income between 2000 and 2022:| North Aurora, Colorado: | +45.4% |
| State: | +103.1% |
Median per capita income in North Aurora in 2022:| North Aurora: | $20,490 |
| Colorado: | $29,910 |
Change in median per capita income between 2000 and 2022:| North Aurora, Colorado: | +127.8% |
| State: | +129.4% |
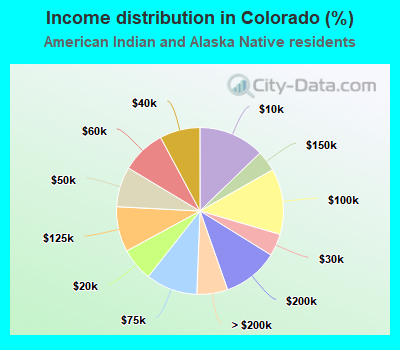
Income statistics for American Indian and Alaska Native residents
Median household income in North Aurora, CO in 2022:| North Aurora: | $51,015 |
| State: | $64,555 |
Change in median household income between 2000 and 2022:| North Aurora, Colorado: | +104.1% |
| State: | +77.4% |
Number of households with income < $10k:| North Aurora: | 12.8% (1,145) |
| Colorado: | 12.8% (3,323) |
Number of households with income $10k - 20k:| North Aurora: | 6.5% (584) |
| Colorado: | 6.4% (1,674) |
Number of households with income $20k - 30k:| North Aurora: | 4.5% (401) |
| State: | 4.3% (1,122) |
Number of households with income $30k - 40k:| North Aurora: | 7.7% (695) |
| State: | 7.8% (2,034) |
Number of households with income $40k - 50k:| North Aurora: | 7.7% (691) |
| Colorado: | 7.8% (2,021) |
Number of households with income $50k - 60k:| North Aurora: | 8.5% (761) |
| Colorado: | 8.6% (2,227) |
Number of households with income $60k - 75k:| North Aurora: | 10.0% (897) |
| State: | 10.0% (2,599) |
Number of households with income $75k - 100k:| North Aurora: | 12.7% (1,144) |
| State: | 12.7% (3,308) |
Number of households with income $100k - 125k:| North Aurora: | 8.8% (793) |
| State: | 8.8% (2,280) |
Number of households with income $125k - 150k:| North Aurora: | 4.0% (358) |
| Colorado: | 4.0% (1,046) |
Number of households with income $150k - 200k:| North Aurora: | 10.8% (965) |
| State: | 10.8% (2,805) |
Number of households with income > $200k:| North Aurora: | 6.0% (540) |
| Colorado: | 6.0% (1,559) |
Aggregate household income in North Aurora in 2022: $15,435,940
Median family income in North Aurora in 2022:| North Aurora: | $47,685 |
| State: | $75,425 |
Number of families with income < $10k:| North Aurora: | 37.6% (38) |
| State: | 8.9% (1,449) |
Number of families with income $10k - 20k:| North Aurora: | 3.9% (4) |
| State: | 4.3% (707) |
Number of families with income $20k - 30k:| North Aurora: | 9.6% (10) |
| State: | 5.2% (844) |
Number of families with income $30k - 40k:| North Aurora: | 9.7% (10) |
| State: | 6.4% (1,048) |
Number of families with income $40k - 50k:| North Aurora: | 7.3% (7) |
| State: | 9.0% (1,472) |
Number of families with income $50k - 60k:| North Aurora: | 7.2% (7) |
| Colorado: | 6.3% (1,022) |
Number of families with income $60k - 75k:| North Aurora: | 7.6% (8) |
| Colorado: | 9.4% (1,531) |
Number of families with income $75k - 100k:| North Aurora: | 16.9% (17) |
| State: | 17.7% (2,889) |
Median non-family income in North Aurora in 2022:| North Aurora: | $42,360 |
| State: | $45,957 |
Change in median non-family income between 2000 and 2022:| North Aurora, Colorado: | +96.4% |
| State: | +96.4% |
Median per capita income in North Aurora in 2022:| North Aurora: | $9,942 |
| State: | $28,603 |
Change in median per capita income between 2000 and 2022:| North Aurora, Colorado: | +19.7% |
| Colorado: | +82.5% |
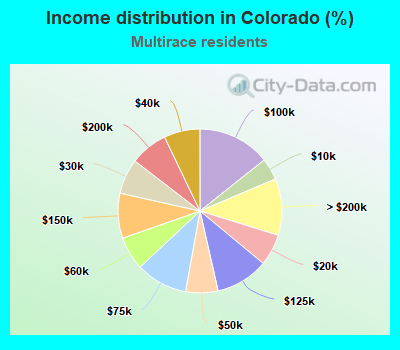
Income statistics for Multirace residents
Median household income in North Aurora, CO in 2022:| North Aurora: | $77,559 |
| Colorado: | $79,392 |
Change in median household income between 2000 and 2022:| North Aurora, Colorado: | +96.5% |
| Colorado: | +113.4% |
Number of households with income < $10k:| North Aurora: | 2.4% (802) |
| Colorado: | 4.3% (11,635) |
Number of households with income $10k - 20k:| North Aurora: | 6.8% (2,282) |
| Colorado: | 6.3% (16,900) |
Number of households with income $20k - 30k:| North Aurora: | 4.6% (1,551) |
| State: | 6.9% (18,777) |
Number of households with income $30k - 40k:| North Aurora: | 7.5% (2,545) |
| State: | 7.1% (19,229) |
Number of households with income $40k - 50k:| North Aurora: | 6.3% (2,135) |
| Colorado: | 6.4% (17,224) |
Number of households with income $50k - 60k:| North Aurora: | 5.7% (1,910) |
| State: | 6.6% (17,889) |
Number of households with income $60k - 75k:| North Aurora: | 10.1% (3,399) |
| State: | 10.2% (27,538) |
Number of households with income $75k - 100k:| North Aurora: | 14.3% (4,811) |
| Colorado: | 14.3% (38,702) |
Number of households with income $100k - 125k:| North Aurora: | 12.5% (4,227) |
| Colorado: | 10.4% (28,179) |
Number of households with income $125k - 150k:| North Aurora: | 11.1% (3,760) |
| State: | 8.9% (23,989) |
Number of households with income $150k - 200k:| North Aurora: | 10.0% (3,385) |
| Colorado: | 7.4% (20,108) |
Number of households with income > $200k:| North Aurora: | 8.7% (2,918) |
| Colorado: | 11.2% (30,192) |
Aggregate household income in North Aurora in 2022: $433,957,809
Median family income in North Aurora in 2022:| North Aurora: | $73,000 |
| Colorado: | $90,413 |
Number of families with income < $10k:| North Aurora: | 4.0% (106) |
| State: | 3.1% (5,545) |
Number of families with income $10k - 20k:| North Aurora: | 11.3% (304) |
| Colorado: | 3.3% (5,951) |
Number of families with income $20k - 30k:| North Aurora: | 7.4% (198) |
| Colorado: | 5.4% (9,621) |
Number of families with income $30k - 40k:| North Aurora: | 25.2% (675) |
| State: | 6.3% (11,262) |
Number of families with income $40k - 50k:| North Aurora: | 10.6% (283) |
| State: | 5.5% (9,926) |
Number of families with income $50k - 60k:| North Aurora: | 14.7% (392) |
| State: | 6.2% (11,153) |
Number of families with income $60k - 75k:| North Aurora: | 8.8% (235) |
| State: | 11.1% (19,994) |
Number of families with income $75k - 100k:| North Aurora: | 4.9% (131) |
| State: | 15.7% (28,137) |
Number of families with income $100k - 125k:| North Aurora: | 13.2% (353) |
| State: | 11.7% (21,095) |
Median non-family income in North Aurora in 2022:| North Aurora: | $28,661 |
| State: | $48,957 |
Change in median non-family income between 2000 and 2022:| North Aurora, Colorado: | +25.1% |
| State: | +87.9% |
Median per capita income in North Aurora in 2022:| North Aurora: | $22,240 |
| Colorado: | $33,518 |
Change in median per capita income between 2000 and 2022:| North Aurora, Colorado: | +144.7% |
| State: | +151.7% |
Income statistics for other residents
Number of households with income < $10k:| North Aurora: | 3.7% (80) |
| Colorado: | 5.4% (6,097) |
Number of households with income $10k - 20k:| North Aurora: | 0.7% (15) |
| State: | 5.2% (5,876) |
Number of households with income $20k - 30k:| North Aurora: | 11.2% (244) |
| State: | 7.7% (8,716) |
Number of households with income $30k - 40k:| North Aurora: | 6.6% (143) |
| State: | 8.1% (9,164) |
Number of households with income $40k - 50k:| North Aurora: | 6.0% (131) |
| State: | 7.9% (8,974) |
Number of households with income $50k - 60k:| North Aurora: | 8.5% (185) |
| State: | 8.4% (9,484) |
Number of households with income $60k - 75k:| North Aurora: | 12.8% (279) |
| Colorado: | 10.6% (11,975) |
Number of households with income $75k - 100k:| North Aurora: | 12.7% (276) |
| State: | 13.4% (15,160) |
Number of households with income $100k - 125k:| North Aurora: | 9.6% (208) |
| State: | 10.5% (11,839) |
Number of households with income $125k - 150k:| North Aurora: | 6.7% (146) |
| State: | 7.3% (8,255) |
Number of households with income $150k - 200k:| North Aurora: | 10.9% (238) |
| Colorado: | 8.0% (9,093) |
Number of households with income > $200k:| North Aurora: | 10.7% (233) |
| Colorado: | 7.5% (8,538) |
Aggregate household income in North Aurora in 2022: $220,081,145
Median family income in North Aurora in 2022:| North Aurora: | $65,975 |
| State: | $73,656 |
Number of families with income < $10k:| North Aurora: | 3.1% (50) |
| State: | 4.3% (3,461) |
Number of families with income $10k - 20k:| North Aurora: | 2.0% (32) |
| Colorado: | 3.8% (3,053) |
Number of families with income $20k - 30k:| North Aurora: | 14.9% (234) |
| Colorado: | 5.8% (4,604) |
Number of families with income $30k - 40k:| North Aurora: | 9.2% (145) |
| State: | 6.5% (5,168) |
Number of families with income $40k - 50k:| North Aurora: | 7.1% (113) |
| State: | 7.8% (6,189) |
Number of families with income $50k - 60k:| North Aurora: | 5.5% (86) |
| State: | 9.1% (7,265) |
Number of families with income $60k - 75k:| North Aurora: | 6.4% (101) |
| State: | 13.8% (10,974) |
Number of families with income $75k - 100k:| North Aurora: | 9.0% (142) |
| State: | 13.7% (10,900) |
Number of families with income $100k - 125k:| North Aurora: | 10.7% (169) |
| Colorado: | 11.5% (9,178) |
Number of families with income $125k - 150k:| North Aurora: | 5.6% (88) |
| State: | 8.1% (6,431) |
Number of families with income $150k - 200k:| North Aurora: | 15.0% (236) |
| Colorado: | 8.3% (6,660) |
Number of families with income > $200k:| North Aurora: | 11.5% (182) |
| State: | 7.4% (5,919) |
Median non-family income in North Aurora in 2022:| North Aurora: | $39,284 |
| Colorado: | $47,178 |
Change in median non-family income between 2000 and 2022:| North Aurora, Colorado: | +44.6% |
| Colorado: | +108.8% |
Median per capita income in North Aurora in 2022:| North Aurora: | $21,394 |
| Colorado: | $30,433 |
Change in median per capita income between 2000 and 2022:| North Aurora, Colorado: | +125.5% |
| Colorado: | +152.7% |