New Hartford, Connecticut (CT) income map, earnings map, and wages data
The median household income in New Hartford, CT in 2022 was $117,300, which was 24.6% greater than the median annual income of $88,429 across the entire state of Connecticut. Compared to the median income of $69,321 in 2000 this represents an increase of 40.9%. The per capita income in 2022 was $55,663, which means an increase of 45.3% compared to 2000 when it was $30,429.
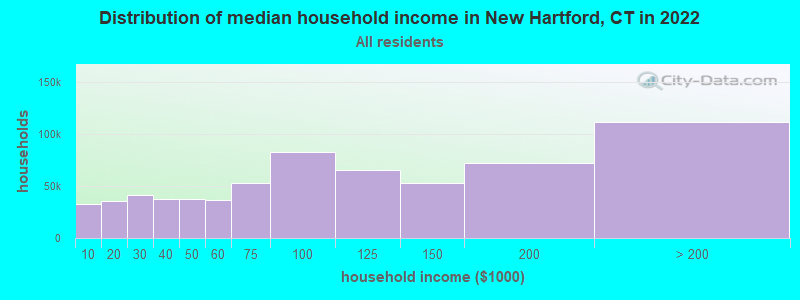
Income statistics for all residents
Median household income in New Hartford, CT in 2022:| New Hartford: | $117,301 |
| State: | $88,429 |
Change in median household income between 2000 and 2022:| New Hartford, Connecticut: | +69.2% |
| State: | +64.0% |
Number of households with income < $10k:| New Hartford: | 5.2% (47,779) |
| State: | 5.1% (72,746) |
Number of households with income $10k - 20k:| New Hartford: | 5.8% (53,878) |
| Connecticut: | 5.7% (81,643) |
Number of households with income $20k - 30k:| New Hartford: | 6.6% (60,985) |
| State: | 6.5% (92,844) |
Number of households with income $30k - 40k:| New Hartford: | 5.9% (54,730) |
| Connecticut: | 5.9% (83,934) |
Number of households with income $40k - 50k:| New Hartford: | 5.9% (54,379) |
| State: | 5.8% (83,025) |
Number of households with income $50k - 60k:| New Hartford: | 5.8% (53,322) |
| State: | 5.7% (81,788) |
Number of households with income $60k - 75k:| New Hartford: | 8.1% (74,710) |
| Connecticut: | 8.1% (115,651) |
Number of households with income $75k - 100k:| New Hartford: | 12.6% (116,681) |
| State: | 12.6% (180,173) |
Number of households with income $100k - 125k:| New Hartford: | 9.8% (90,835) |
| Connecticut: | 9.9% (141,231) |
Number of households with income $125k - 150k:| New Hartford: | 7.8% (72,540) |
| State: | 7.9% (112,826) |
Number of households with income $150k - 200k:| New Hartford: | 10.7% (99,229) |
| Connecticut: | 10.8% (154,641) |
Number of households with income > $200k:| New Hartford: | 16.0% (148,242) |
| State: | 16.3% (233,133) |
Aggregate household income in New Hartford in 2022: $7,868,528,662
Median family income in New Hartford in 2022:| New Hartford: | $139,424 |
| Connecticut: | $115,183 |
Median non-family income in New Hartford in 2022:| New Hartford: | $71,121 |
| State: | $50,964 |
Change in median non-family income between 2000 and 2022:| New Hartford, Connecticut: | +71.5% |
| State: | +65.1% |
Median per capita income in New Hartford in 2022:| New Hartford: | $55,664 |
| State: | $51,581 |
Change in median per capita income between 2000 and 2022:| New Hartford, Connecticut: | +82.9% |
| State: | +79.3% |
Income statistics for White residents
Median household income in New Hartford, CT in 2022:| New Hartford: | $117,088 |
| Connecticut: | $96,890 |
Change in median household income between 2000 and 2022:| New Hartford, Connecticut: | +69.4% |
| State: | +68.5% |
Number of households with income < $10k:| New Hartford: | 4.2% (25,610) |
| Connecticut: | 4.2% (42,265) |
Number of households with income $10k - 20k:| New Hartford: | 4.9% (29,444) |
| State: | 4.8% (48,323) |
Number of households with income $20k - 30k:| New Hartford: | 5.8% (35,016) |
| Connecticut: | 5.7% (57,716) |
Number of households with income $30k - 40k:| New Hartford: | 5.4% (32,412) |
| State: | 5.3% (53,827) |
Number of households with income $40k - 50k:| New Hartford: | 5.3% (32,278) |
| State: | 5.3% (53,301) |
Number of households with income $50k - 60k:| New Hartford: | 5.6% (33,592) |
| State: | 5.5% (55,690) |
Number of households with income $60k - 75k:| New Hartford: | 7.9% (48,005) |
| State: | 8.0% (80,329) |
Number of households with income $75k - 100k:| New Hartford: | 12.7% (76,922) |
| State: | 12.7% (128,070) |
Number of households with income $100k - 125k:| New Hartford: | 10.0% (60,402) |
| State: | 10.0% (101,210) |
Number of households with income $125k - 150k:| New Hartford: | 8.0% (48,492) |
| State: | 8.0% (81,250) |
Number of households with income $150k - 200k:| New Hartford: | 11.8% (71,303) |
| Connecticut: | 11.8% (119,527) |
Number of households with income > $200k:| New Hartford: | 18.4% (111,622) |
| State: | 18.6% (187,875) |
Aggregate household income in New Hartford in 2022: $5,910,336,987
Median family income in New Hartford in 2022:| New Hartford: | $143,079 |
| State: | $128,955 |
Number of families with income $10k - 20k:| New Hartford: | 2.9% (47) |
| State: | 1.8% (11,289) |
Number of families with income $20k - 30k:| New Hartford: | 1.3% (22) |
| State: | 3.0% (18,506) |
Number of families with income $30k - 40k:| New Hartford: | 3.1% (52) |
| State: | 2.9% (18,160) |
Number of families with income $40k - 50k:| New Hartford: | 1.0% (17) |
| Connecticut: | 3.9% (24,550) |
Number of families with income $50k - 60k:| New Hartford: | 3.8% (63) |
| State: | 4.3% (26,723) |
Number of families with income $60k - 75k:| New Hartford: | 8.3% (138) |
| State: | 7.1% (44,075) |
Number of families with income $75k - 100k:| New Hartford: | 10.2% (171) |
| State: | 12.5% (77,679) |
Number of families with income $100k - 125k:| New Hartford: | 16.7% (279) |
| Connecticut: | 11.1% (69,086) |
Number of families with income $125k - 150k:| New Hartford: | 12.6% (209) |
| Connecticut: | 9.6% (59,616) |
Number of families with income $150k - 200k:| New Hartford: | 22.9% (380) |
| State: | 15.7% (97,890) |
Number of families with income > $200k:| New Hartford: | 17.2% (286) |
| State: | 26.3% (163,417) |
Median non-family income in New Hartford in 2022:| New Hartford: | $70,851 |
| Connecticut: | $54,067 |
Change in median non-family income between 2000 and 2022:| New Hartford, Connecticut: | +73.7% |
| Connecticut: | +68.7% |
Median per capita income in New Hartford in 2022:| New Hartford: | $58,706 |
| Connecticut: | $59,916 |
Change in median per capita income between 2000 and 2022:| New Hartford, Connecticut: | +92.1% |
| State: | +90.2% |
Income statistics for Asian residents
Median household income in New Hartford, CT in 2022:| New Hartford: | $196,995 |
| Connecticut: | $110,568 |
Change in median household income between 2000 and 2022:| New Hartford, Connecticut: | +110.1% |
| State: | +79.5% |
Number of households with income < $10k:| New Hartford: | 7.1% (6,463) |
| State: | 7.1% (4,245) |
Number of households with income $10k - 20k:| New Hartford: | 3.5% (3,177) |
| State: | 3.5% (2,087) |
Number of households with income $20k - 30k:| New Hartford: | 4.1% (3,751) |
| State: | 4.1% (2,464) |
Number of households with income $30k - 40k:| New Hartford: | 4.1% (3,773) |
| Connecticut: | 4.1% (2,478) |
Number of households with income $40k - 50k:| New Hartford: | 3.3% (3,019) |
| State: | 3.3% (1,983) |
Number of households with income $50k - 60k:| New Hartford: | 3.9% (3,544) |
| State: | 3.9% (2,328) |
Number of households with income $60k - 75k:| New Hartford: | 7.0% (6,437) |
| Connecticut: | 7.0% (4,228) |
Number of households with income $75k - 100k:| New Hartford: | 11.5% (10,522) |
| State: | 11.5% (6,911) |
Number of households with income $100k - 125k:| New Hartford: | 10.2% (9,329) |
| Connecticut: | 10.2% (6,127) |
Number of households with income $125k - 150k:| New Hartford: | 8.5% (7,733) |
| State: | 8.5% (5,079) |
Number of households with income $150k - 200k:| New Hartford: | 12.4% (11,318) |
| Connecticut: | 12.4% (7,434) |
Number of households with income > $200k:| New Hartford: | 24.4% (22,322) |
| Connecticut: | 24.4% (14,661) |
Aggregate household income in New Hartford in 2022: $13,032,789
Median family income in New Hartford in 2022:| New Hartford: | $174,042 |
| State: | $134,548 |
Number of families with income $40k - 50k:| New Hartford: | 16.9% (5) |
| Connecticut: | 2.0% (863) |
Number of families with income $125k - 150k:| New Hartford: | 83.1% (25) |
| State: | 8.2% (3,588) |
Median non-family income in New Hartford in 2022:| New Hartford: | $226,108 |
| State: | $63,785 |
Change in median non-family income between 2000 and 2022:| New Hartford, Connecticut: | +148.6% |
| State: | +77.9% |
Median per capita income in New Hartford in 2022:| New Hartford: | $63,709 |
| Connecticut: | $55,295 |
Change in median per capita income between 2000 and 2022:| New Hartford, Connecticut: | +103.6% |
| State: | +97.8% |
Income statistics for Hispanic or Latino residents
Number of households with income < $10k:| New Hartford: | 8.7% (19,332) |
| State: | 8.7% (18,584) |
Number of households with income $10k - 20k:| New Hartford: | 9.1% (20,009) |
| Connecticut: | 9.1% (19,235) |
Number of households with income $20k - 30k:| New Hartford: | 8.9% (19,753) |
| State: | 8.9% (18,989) |
Number of households with income $30k - 40k:| New Hartford: | 7.5% (16,609) |
| Connecticut: | 7.5% (15,967) |
Number of households with income $40k - 50k:| New Hartford: | 8.7% (19,209) |
| State: | 8.7% (18,466) |
Number of households with income $50k - 60k:| New Hartford: | 6.9% (15,298) |
| State: | 6.9% (14,706) |
Number of households with income $60k - 75k:| New Hartford: | 8.9% (19,648) |
| State: | 8.9% (18,888) |
Number of households with income $75k - 100k:| New Hartford: | 13.5% (29,822) |
| State: | 13.5% (28,669) |
Number of households with income $100k - 125k:| New Hartford: | 8.2% (18,135) |
| State: | 8.2% (17,434) |
Number of households with income $125k - 150k:| New Hartford: | 6.5% (14,305) |
| Connecticut: | 6.5% (13,752) |
Number of households with income $150k - 200k:| New Hartford: | 6.6% (14,682) |
| Connecticut: | 6.6% (14,114) |
Number of households with income > $200k:| New Hartford: | 6.4% (14,178) |
| State: | 6.4% (13,630) |
Median per capita income in New Hartford in 2022:| New Hartford: | $24,617 |
| Connecticut: | $28,507 |
Change in median per capita income between 2000 and 2022:| New Hartford, Connecticut: | +80.3% |
| Connecticut: | +117.2% |
Income statistics for Multirace residents
Number of households with income < $10k:| New Hartford: | 6.0% (7,966) |
| State: | 6.0% (7,457) |
Number of households with income $10k - 20k:| New Hartford: | 8.1% (10,831) |
| State: | 8.1% (10,139) |
Number of households with income $20k - 30k:| New Hartford: | 7.0% (9,295) |
| State: | 7.0% (8,702) |
Number of households with income $30k - 40k:| New Hartford: | 6.9% (9,129) |
| State: | 6.9% (8,546) |
Number of households with income $40k - 50k:| New Hartford: | 7.0% (9,306) |
| Connecticut: | 7.0% (8,712) |
Number of households with income $50k - 60k:| New Hartford: | 5.9% (7,831) |
| Connecticut: | 5.9% (7,331) |
Number of households with income $60k - 75k:| New Hartford: | 8.5% (11,359) |
| State: | 8.5% (10,634) |
Number of households with income $75k - 100k:| New Hartford: | 14.1% (18,801) |
| State: | 14.1% (17,600) |
Number of households with income $100k - 125k:| New Hartford: | 9.9% (13,228) |
| Connecticut: | 9.9% (12,383) |
Number of households with income $125k - 150k:| New Hartford: | 7.2% (9,530) |
| Connecticut: | 7.2% (8,921) |
Number of households with income $150k - 200k:| New Hartford: | 8.8% (11,667) |
| State: | 8.8% (10,922) |
Number of households with income > $200k:| New Hartford: | 10.6% (14,151) |
| State: | 10.6% (13,247) |
Median per capita income in New Hartford in 2022:| New Hartford: | $31,526 |
| State: | $32,794 |
Change in median per capita income between 2000 and 2022:| New Hartford, Connecticut: | +95.5% |
| Connecticut: | +117.2% |
Income statistics for other residents
Number of households with income < $10k:| New Hartford: | 9.0% (778) |
| State: | 9.0% (8,596) |
Number of households with income $10k - 20k:| New Hartford: | 10.2% (885) |
| State: | 10.2% (9,773) |
Number of households with income $20k - 30k:| New Hartford: | 9.1% (787) |
| State: | 9.1% (8,691) |
Number of households with income $30k - 40k:| New Hartford: | 7.8% (674) |
| Connecticut: | 7.8% (7,447) |
Number of households with income $40k - 50k:| New Hartford: | 8.2% (712) |
| Connecticut: | 8.2% (7,860) |
Number of households with income $50k - 60k:| New Hartford: | 6.0% (521) |
| State: | 6.0% (5,757) |
Number of households with income $60k - 75k:| New Hartford: | 9.3% (810) |
| Connecticut: | 9.3% (8,942) |
Number of households with income $75k - 100k:| New Hartford: | 14.3% (1,240) |
| State: | 14.3% (13,700) |
Number of households with income $100k - 125k:| New Hartford: | 7.2% (625) |
| Connecticut: | 7.2% (6,906) |
Number of households with income $125k - 150k:| New Hartford: | 6.5% (563) |
| State: | 6.5% (6,215) |
Number of households with income $150k - 200k:| New Hartford: | 6.1% (531) |
| State: | 6.1% (5,865) |
Number of households with income > $200k:| New Hartford: | 6.3% (549) |
| Connecticut: | 6.3% (6,065) |
Median per capita income in New Hartford in 2022:| New Hartford: | $2,624 |
| State: | $29,353 |