The median household income in New Cumberland, PA in 2022 was $75,964, which was 5.5% greater than the median annual income of $71,798 across the entire state of Pennsylvania. Compared to the median income of $44,783 in 2000 this represents an increase of 41.0%. The per capita income in 2022 was $43,495, which means an increase of 43.3% compared to 2000 when it was $24,672.
Whole page based on the data from 2000 / 2022 when the population of New Cumberland, Pennsylvania was 7,349 / 7,725
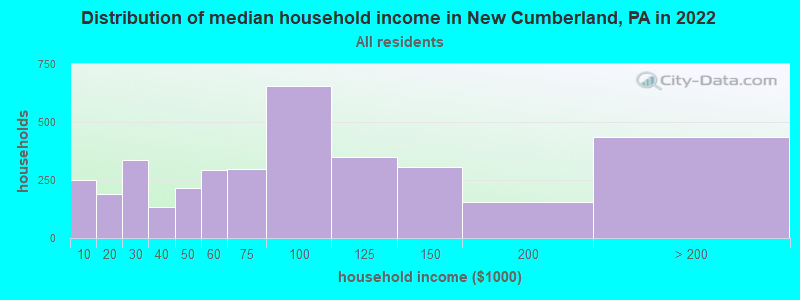
Income statistics for all residents
Median household income in New Cumberland, PA in 2022:
New Cumberland:
$75,965
Pennsylvania:
$71,798
Change in median household income between 2000 and 2022:
New Cumberland, Pennsylvania:
+69.6%
Pennsylvania:
+79.0%
Number of households with income < $10k:
New Cumberland:
6.9% (249)
State:
5.5% (291,562)
Number of households with income $10k - 20k:
New Cumberland:
5.2% (189)
Pennsylvania:
7.3% (384,726)
Number of households with income $20k - 30k:
New Cumberland:
9.3% (336)
Pennsylvania:
7.4% (389,464)
Number of households with income $30k - 40k:
New Cumberland:
3.7% (133)
State:
7.6% (402,138)
Number of households with income $40k - 50k:
New Cumberland:
5.9% (214)
State:
7.3% (387,945)
Number of households with income $50k - 60k:
New Cumberland:
8.1% (294)
State:
7.0% (372,468)
Number of households with income $60k - 75k:
New Cumberland:
8.3% (299)
State:
9.9% (524,786)
Number of households with income $75k - 100k:
New Cumberland:
18.2% (657)
State:
12.6% (666,253)
Number of households with income $100k - 125k:
New Cumberland:
9.6% (347)
Pennsylvania:
9.9% (526,402)
Number of households with income $125k - 150k:
New Cumberland:
8.5% (306)
State:
6.9% (362,702)
Number of households with income $150k - 200k:
New Cumberland:
4.3% (157)
State:
8.3% (440,827)
Number of households with income > $200k:
New Cumberland:
12.0% (434)
State:
10.3% (544,792)
Aggregate household income in New Cumberland in 2022: $349,584,639
Median family income in New Cumberland in 2022:
New Cumberland:
$86,693
State:
$93,029
Number of families with income < $10k:
New Cumberland:
3.0% (62)
Pennsylvania:
3.1% (101,868)
Number of families with income $10k - 20k:
New Cumberland:
0.6% (13)
State:
3.5% (115,881)
Number of families with income $20k - 30k:
New Cumberland:
4.8% (101)
State:
4.8% (156,521)
Number of families with income $30k - 40k:
New Cumberland:
4.0% (84)
State:
5.8% (191,305)
Number of families with income $40k - 50k:
New Cumberland:
8.6% (181)
Pennsylvania:
6.4% (211,380)
Number of families with income $50k - 60k:
New Cumberland:
9.7% (203)
Pennsylvania:
6.4% (209,910)
Number of families with income $60k - 75k:
New Cumberland:
5.6% (117)
State:
9.7% (318,991)
Number of families with income $75k - 100k:
New Cumberland:
18.3% (383)
State:
14.0% (461,021)
Number of families with income $100k - 125k:
New Cumberland:
12.1% (254)
Pennsylvania:
12.2% (400,961)
Number of families with income $125k - 150k:
New Cumberland:
9.6% (200)
Pennsylvania:
8.8% (288,471)
Number of families with income $150k - 200k:
New Cumberland:
4.8% (100)
State:
11.2% (367,642)
Number of families with income > $200k:
New Cumberland:
18.8% (394)
Pennsylvania:
14.3% (470,863)
Median non-family income in New Cumberland in 2022:
New Cumberland:
$51,144
State:
$42,203
Change in median non-family income between 2000 and 2022:
New Cumberland, Pennsylvania:
+66.5%
State:
+90.1%
Median per capita income in New Cumberland in 2022:
New Cumberland:
$43,495
State:
$41,489
Change in median per capita income between 2000 and 2022:
New Cumberland, Pennsylvania:
+76.3%
State:
+98.7%
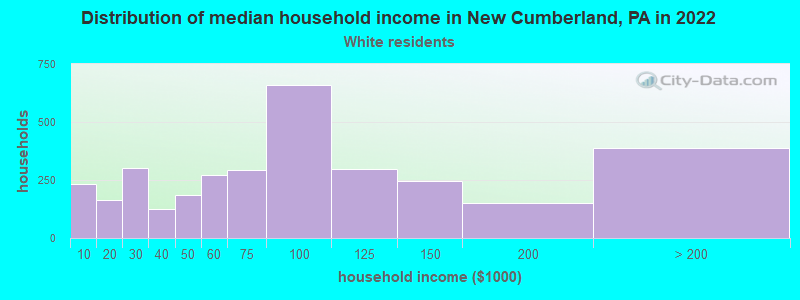
Income statistics for White residents
Median household income in New Cumberland, PA in 2022:
New Cumberland:
$75,507
State:
$76,765
Change in median household income between 2000 and 2022:
New Cumberland, Pennsylvania:
+67.5%
State:
+84.3%
Number of households with income < $10k:
New Cumberland:
7.0% (231)
Pennsylvania:
4.3% (179,792)
Number of households with income $10k - 20k:
New Cumberland:
4.9% (164)
State:
6.5% (268,738)
Number of households with income $20k - 30k:
New Cumberland:
9.1% (302)
State:
7.0% (288,138)
Number of households with income $30k - 40k:
New Cumberland:
3.7% (124)
State:
7.2% (300,208)
Number of households with income $40k - 50k:
New Cumberland:
5.6% (186)
State:
7.2% (298,756)
Number of households with income $50k - 60k:
New Cumberland:
8.2% (273)
State:
6.8% (283,251)
Number of households with income $60k - 75k:
New Cumberland:
8.8% (293)
State:
9.9% (408,159)
Number of households with income $75k - 100k:
New Cumberland:
19.9% (661)
State:
13.2% (547,809)
Number of households with income $100k - 125k:
New Cumberland:
9.0% (297)
State:
10.5% (436,652)
Number of households with income $125k - 150k:
New Cumberland:
7.4% (244)
Pennsylvania:
7.3% (304,132)
Number of households with income $150k - 200k:
New Cumberland:
4.6% (153)
State:
9.0% (374,658)
Number of households with income > $200k:
New Cumberland:
11.7% (389)
State:
10.9% (452,618)
Aggregate household income in New Cumberland in 2022: $318,035,519
Median family income in New Cumberland in 2022:
New Cumberland:
$90,311
Pennsylvania:
$99,396
Number of families with income < $10k:
New Cumberland:
2.5% (47)
Pennsylvania:
2.2% (56,136)
Number of families with income $10k - 20k:
New Cumberland:
0.9% (16)
State:
2.7% (69,032)
Number of families with income $20k - 30k:
New Cumberland:
4.1% (76)
State:
3.9% (100,065)
Number of families with income $30k - 40k:
New Cumberland:
3.7% (68)
State:
5.2% (134,367)
Number of families with income $40k - 50k:
New Cumberland:
4.9% (90)
Pennsylvania:
6.0% (154,327)
Number of families with income $50k - 60k:
New Cumberland:
10.7% (198)
State:
6.1% (157,983)
Number of families with income $60k - 75k:
New Cumberland:
6.1% (112)
Pennsylvania:
9.6% (249,292)
Number of families with income $75k - 100k:
New Cumberland:
20.4% (377)
State:
14.7% (379,316)
Number of families with income $100k - 125k:
New Cumberland:
12.9% (238)
Pennsylvania:
12.9% (333,626)
Number of families with income $125k - 150k:
New Cumberland:
9.7% (179)
State:
9.4% (243,915)
Number of families with income $150k - 200k:
New Cumberland:
5.1% (94)
State:
12.2% (314,926)
Number of families with income > $200k:
New Cumberland:
19.1% (352)
State:
15.1% (390,885)
Median non-family income in New Cumberland in 2022:
New Cumberland:
$52,422
Pennsylvania:
$44,251
Change in median non-family income between 2000 and 2022:
New Cumberland, Pennsylvania:
+70.0%
State:
+94.2%
Median per capita income in New Cumberland in 2022:
New Cumberland:
$46,390
State:
$45,306
Change in median per capita income between 2000 and 2022:
New Cumberland, Pennsylvania:
+86.5%
Pennsylvania:
+105.4%
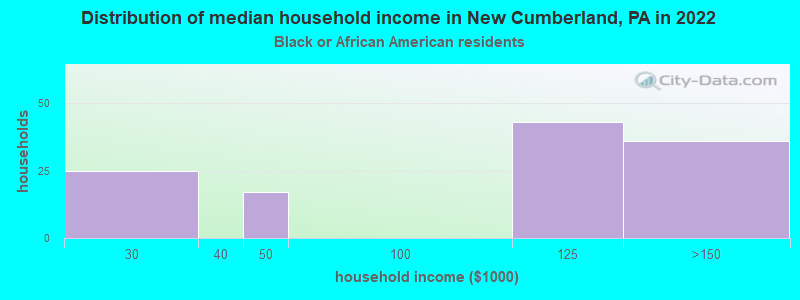
Income statistics for Black or African American residents
Median household income in New Cumberland, PA in 2022:
New Cumberland:
$93,899
State:
$46,564
Number of households with income < $10k:
New Cumberland:
0.0% (0)
State:
12.0% (64,705)
Number of households with income $10k - 20k:
New Cumberland:
0.0% (0)
State:
12.7% (68,459)
Number of households with income $20k - 30k:
New Cumberland:
20.7% (25)
State:
9.3% (49,778)
Number of households with income $30k - 40k:
New Cumberland:
0.0% (0)
Pennsylvania:
10.0% (53,629)
Number of households with income $40k - 50k:
New Cumberland:
14.0% (17)
State:
8.5% (45,601)
Number of households with income $50k - 60k:
New Cumberland:
0.0% (0)
State:
7.8% (41,725)
Number of households with income $60k - 75k:
New Cumberland:
0.0% (0)
Pennsylvania:
10.4% (55,653)
Number of households with income $75k - 100k:
New Cumberland:
0.0% (0)
State:
9.5% (51,281)
Number of households with income $100k - 125k:
New Cumberland:
35.5% (43)
State:
7.1% (38,125)
Number of households with income $125k - 150k:
New Cumberland:
29.8% (36)
Pennsylvania:
4.5% (24,172)
Number of households with income $150k - 200k:
New Cumberland:
0.0% (0)
State:
4.0% (21,749)
Number of households with income > $200k:
New Cumberland:
0.0% (0)
Pennsylvania:
4.2% (22,562)
Aggregate household income in New Cumberland in 2022: $12,178,895
Median family income in New Cumberland in 2022:
New Cumberland:
$40,616
Pennsylvania:
$61,391
Number of families with income $20k - 30k:
New Cumberland:
27.5% (24)
Pennsylvania:
7.3% (21,340)
Number of families with income $40k - 50k:
New Cumberland:
52.2% (45)
Pennsylvania:
8.7% (25,351)
Number of families with income $100k - 125k:
New Cumberland:
20.3% (17)
State:
9.5% (27,892)
Median per capita income in New Cumberland in 2022:
New Cumberland:
$59,383
Pennsylvania:
$28,010
Change in median per capita income between 2000 and 2022:
New Cumberland, Pennsylvania:
+85.6%
Pennsylvania:
+101.5%
Income statistics for Asian residents
Aggregate household income in New Cumberland in 2022: $4,022,414
Median per capita income in New Cumberland in 2022:
New Cumberland:
$31,308
State:
$48,341
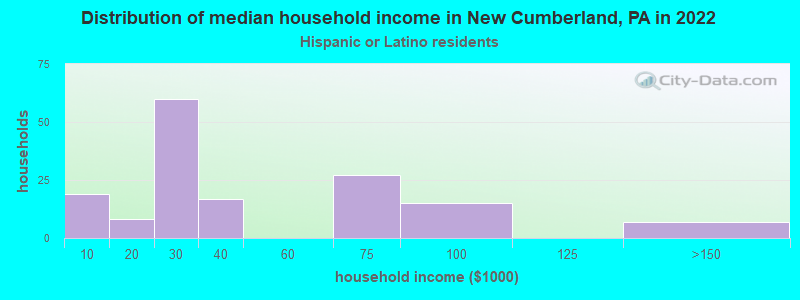
Income statistics for Hispanic or Latino residents
Median household income in New Cumberland, PA in 2022:
New Cumberland:
$26,199
State:
$55,478
Number of households with income < $10k:
New Cumberland:
12.4% (19)
State:
8.7% (29,517)
Number of households with income $10k - 20k:
New Cumberland:
5.2% (8)
State:
10.0% (33,785)
Number of households with income $20k - 30k:
New Cumberland:
39.2% (60)
Pennsylvania:
9.9% (33,399)
Number of households with income $30k - 40k:
New Cumberland:
11.1% (17)
State:
8.8% (29,878)
Number of households with income $40k - 50k:
New Cumberland:
0.0% (0)
State:
8.5% (28,549)
Number of households with income $50k - 60k:
New Cumberland:
0.0% (0)
State:
7.6% (25,792)
Number of households with income $60k - 75k:
New Cumberland:
17.6% (27)
State:
10.6% (35,808)
Number of households with income $75k - 100k:
New Cumberland:
9.8% (15)
State:
11.9% (40,287)
Number of households with income $100k - 125k:
New Cumberland:
0.0% (0)
State:
8.0% (27,028)
Number of households with income $125k - 150k:
New Cumberland:
4.6% (7)
Pennsylvania:
5.2% (17,622)
Number of households with income $150k - 200k:
New Cumberland:
0.0% (0)
Pennsylvania:
5.2% (17,563)
Number of households with income > $200k:
New Cumberland:
0.0% (0)
Pennsylvania:
5.5% (18,469)
Aggregate household income in New Cumberland in 2022: $5,552,598
Median non-family income in New Cumberland in 2022:
New Cumberland:
$25,175
State:
$34,664
Median per capita income in New Cumberland in 2022:
New Cumberland:
$12,403
State:
$23,829
Change in median per capita income between 2000 and 2022:: -7.0%
New Cumberland, Pennsylvania:
-7.0%
State:
+116.4%
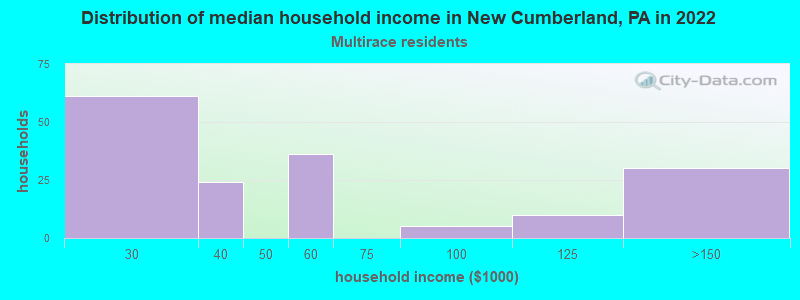
Income statistics for Multirace residents
Number of households with income < $10k:
New Cumberland:
0.0% (0)
Pennsylvania:
7.8% (21,911)
Number of households with income $10k - 20k:
New Cumberland:
0.0% (0)
Pennsylvania:
8.2% (22,847)
Number of households with income $20k - 30k:
New Cumberland:
36.7% (61)
State:
8.7% (24,252)
Number of households with income $30k - 40k:
New Cumberland:
14.5% (24)
State:
7.3% (20,502)
Number of households with income $40k - 50k:
New Cumberland:
0.0% (0)
State:
7.7% (21,525)
Number of households with income $50k - 60k:
New Cumberland:
21.7% (36)
State:
8.6% (24,174)
Number of households with income $60k - 75k:
New Cumberland:
0.0% (0)
State:
11.9% (33,350)
Number of households with income $75k - 100k:
New Cumberland:
3.0% (5)
Pennsylvania:
11.5% (32,274)
Number of households with income $100k - 125k:
New Cumberland:
6.0% (10)
Pennsylvania:
8.3% (23,361)
Number of households with income $125k - 150k:
New Cumberland:
18.1% (30)
State:
5.3% (14,784)
Number of households with income $150k - 200k:
New Cumberland:
0.0% (0)
Pennsylvania:
6.9% (19,314)
Number of households with income > $200k:
New Cumberland:
0.0% (0)
State:
7.8% (21,759)
Aggregate household income in New Cumberland in 2022: $7,288,695
Median per capita income in New Cumberland in 2022:
New Cumberland:
$10,430
State:
$27,581
Change in median per capita income between 2000 and 2022:: -48.3%
New Cumberland, Pennsylvania:
-48.3%
State:
+139.6%
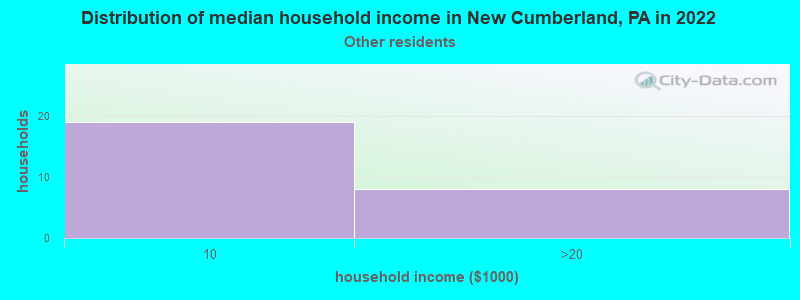
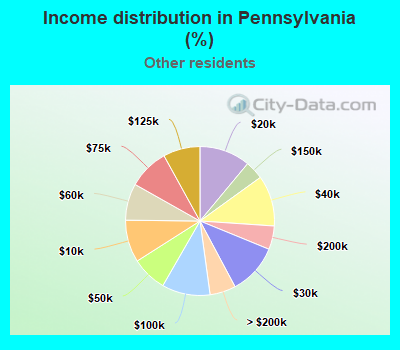
Income statistics for other residents
Number of households with income < $10k:
New Cumberland:
70.4% (19)
Pennsylvania:
9.2% (14,206)
Number of households with income $10k - 20k:
New Cumberland:
29.6% (8)
State:
11.0% (17,038)
Number of households with income $20k - 30k:
New Cumberland:
0.0% (0)
Pennsylvania:
11.0% (17,000)
Number of households with income $30k - 40k:
New Cumberland:
0.0% (0)
Pennsylvania:
11.0% (17,022)
Number of households with income $40k - 50k:
New Cumberland:
0.0% (0)
Pennsylvania:
7.7% (11,829)
Number of households with income $50k - 60k:
New Cumberland:
0.0% (0)
State:
8.0% (12,320)
Number of households with income $60k - 75k:
New Cumberland:
0.0% (0)
State:
8.8% (13,590)
Number of households with income $75k - 100k:
New Cumberland:
0.0% (0)
State:
10.5% (16,166)
Number of households with income $100k - 125k:
New Cumberland:
0.0% (0)
State:
8.0% (12,371)
Number of households with income $125k - 150k:
New Cumberland:
0.0% (0)
State:
4.0% (6,190)
Number of households with income $150k - 200k:
New Cumberland:
0.0% (0)
State:
5.1% (7,862)
Number of households with income > $200k:
New Cumberland:
0.0% (0)
State:
5.6% (8,691)
Aggregate household income in New Cumberland in 2022: $5,467,582
Median per capita income in New Cumberland in 2022:
New Cumberland:
$38,208
State:
$24,779
Discuss New Cumberland, Pennsylvania (PA) on our hugely popular Pennsylvania forum.