Montville, Connecticut (CT) income map, earnings map, and wages data
The median household income in Montville, CT in 2022 was $93,213, which was 5.1% greater than the median annual income of $88,429 across the entire state of Connecticut. Compared to the median income of $55,086 in 2000 this represents an increase of 40.9%. The per capita income in 2022 was $40,897, which means an increase of 45.3% compared to 2000 when it was $22,357.
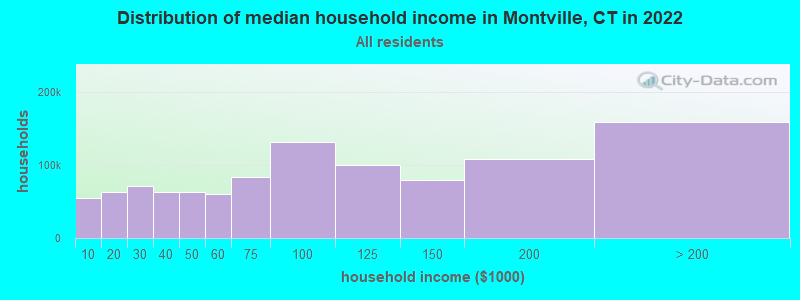
Income statistics for all residents
Median household income in Montville, CT in 2022:| Montville: | $93,213 |
| Connecticut: | $88,429 |
Change in median household income between 2000 and 2022:| Montville, Connecticut: | +69.2% |
| State: | +64.0% |
Number of households with income < $10k:| Montville: | 5.2% (37,967) |
| State: | 5.1% (72,746) |
Number of households with income $10k - 20k:| Montville: | 5.8% (42,814) |
| Connecticut: | 5.7% (81,643) |
Number of households with income $20k - 30k:| Montville: | 6.6% (48,462) |
| State: | 6.5% (92,844) |
Number of households with income $30k - 40k:| Montville: | 5.9% (43,491) |
| Connecticut: | 5.9% (83,934) |
Number of households with income $40k - 50k:| Montville: | 5.9% (43,212) |
| State: | 5.8% (83,025) |
Number of households with income $50k - 60k:| Montville: | 5.8% (42,372) |
| State: | 5.7% (81,788) |
Number of households with income $60k - 75k:| Montville: | 8.1% (59,369) |
| Connecticut: | 8.1% (115,651) |
Number of households with income $75k - 100k:| Montville: | 12.6% (92,720) |
| Connecticut: | 12.6% (180,173) |
Number of households with income $100k - 125k:| Montville: | 9.8% (72,182) |
| State: | 9.9% (141,231) |
Number of households with income $125k - 150k:| Montville: | 7.8% (57,644) |
| State: | 7.9% (112,826) |
Number of households with income $150k - 200k:| Montville: | 10.7% (78,853) |
| State: | 10.8% (154,641) |
Number of households with income > $200k:| Montville: | 16.0% (117,801) |
| Connecticut: | 16.3% (233,133) |
Aggregate household income in Montville in 2022: $16,827,325,866
Median family income in Montville in 2022:| Montville: | $110,094 |
| State: | $115,183 |
Median non-family income in Montville in 2022:| Montville: | $49,084 |
| State: | $50,964 |
Change in median non-family income between 2000 and 2022:| Montville, Connecticut: | +71.5% |
| State: | +65.1% |
Median per capita income in Montville in 2022:| Montville: | $40,898 |
| Connecticut: | $51,581 |
Change in median per capita income between 2000 and 2022:| Montville, Connecticut: | +82.9% |
| State: | +79.3% |
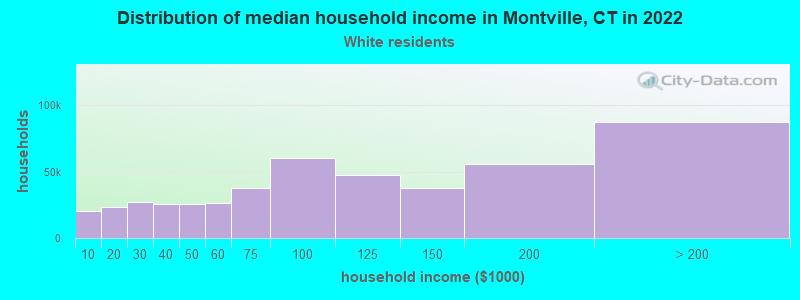
Income statistics for White residents
Median household income in Montville, CT in 2022:| Montville: | $91,624 |
| State: | $96,890 |
Change in median household income between 2000 and 2022:| Montville, Connecticut: | +69.4% |
| Connecticut: | +68.5% |
Number of households with income < $10k:| Montville: | 4.2% (20,040) |
| State: | 4.2% (42,265) |
Number of households with income $10k - 20k:| Montville: | 4.9% (23,040) |
| State: | 4.8% (48,323) |
Number of households with income $20k - 30k:| Montville: | 5.8% (27,401) |
| State: | 5.7% (57,716) |
Number of households with income $30k - 40k:| Montville: | 5.4% (25,364) |
| State: | 5.3% (53,827) |
Number of households with income $40k - 50k:| Montville: | 5.3% (25,258) |
| Connecticut: | 5.3% (53,301) |
Number of households with income $50k - 60k:| Montville: | 5.6% (26,286) |
| State: | 5.5% (55,690) |
Number of households with income $60k - 75k:| Montville: | 7.9% (37,565) |
| Connecticut: | 8.0% (80,329) |
Number of households with income $75k - 100k:| Montville: | 12.7% (60,193) |
| State: | 12.7% (128,070) |
Number of households with income $100k - 125k:| Montville: | 10.0% (47,266) |
| State: | 10.0% (101,210) |
Number of households with income $125k - 150k:| Montville: | 8.0% (37,946) |
| Connecticut: | 8.0% (81,250) |
Number of households with income $150k - 200k:| Montville: | 11.8% (55,796) |
| State: | 11.8% (119,527) |
Number of households with income > $200k:| Montville: | 18.4% (87,347) |
| Connecticut: | 18.6% (187,875) |
Aggregate household income in Montville in 2022: $11,807,640,564
Median family income in Montville in 2022:| Montville: | $112,087 |
| State: | $128,955 |
Number of families with income < $10k:| Montville: | 4.0% (112) |
| Connecticut: | 1.9% (11,537) |
Number of families with income $10k - 20k:| Montville: | 2.0% (56) |
| State: | 1.8% (11,289) |
Number of families with income $20k - 30k:| Montville: | 4.7% (129) |
| Connecticut: | 3.0% (18,506) |
Number of families with income $30k - 40k:| Montville: | 5.1% (140) |
| State: | 2.9% (18,160) |
Number of families with income $40k - 50k:| Montville: | 7.1% (195) |
| State: | 3.9% (24,550) |
Number of families with income $50k - 60k:| Montville: | 7.8% (214) |
| State: | 4.3% (26,723) |
Number of families with income $60k - 75k:| Montville: | 12.4% (343) |
| State: | 7.1% (44,075) |
Number of families with income $75k - 100k:| Montville: | 20.1% (555) |
| Connecticut: | 12.5% (77,679) |
Number of families with income $100k - 125k:| Montville: | 10.0% (276) |
| State: | 11.1% (69,086) |
Number of families with income $125k - 150k:| Montville: | 9.1% (250) |
| Connecticut: | 9.6% (59,616) |
Number of families with income $150k - 200k:| Montville: | 9.2% (254) |
| State: | 15.7% (97,890) |
Number of families with income > $200k:| Montville: | 8.6% (238) |
| Connecticut: | 26.3% (163,417) |
Median non-family income in Montville in 2022:| Montville: | $50,897 |
| State: | $54,067 |
Change in median non-family income between 2000 and 2022:| Montville, Connecticut: | +73.7% |
| State: | +68.7% |
Median per capita income in Montville in 2022:| Montville: | $44,568 |
| State: | $59,916 |
Change in median per capita income between 2000 and 2022:| Montville, Connecticut: | +92.1% |
| State: | +90.2% |
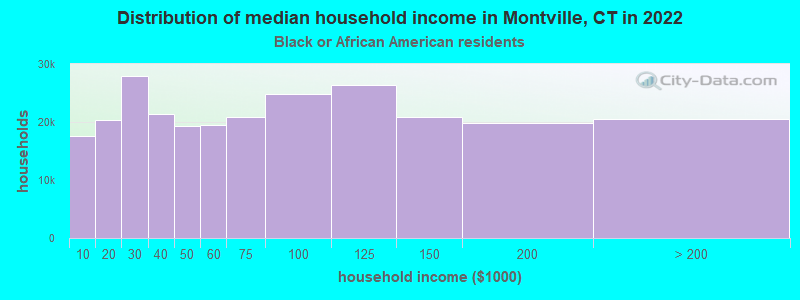
Income statistics for Black or African American residents
Median household income in Montville, CT in 2022:| Montville: | $104,590 |
| State: | $61,803 |
Change in median household income between 2000 and 2022:| Montville, Connecticut: | +60.9% |
| State: | +76.1% |
Number of households with income < $10k:| Montville: | 6.8% (17,579) |
| State: | 6.8% (9,494) |
Number of households with income $10k - 20k:| Montville: | 7.9% (20,373) |
| Connecticut: | 7.9% (11,003) |
Number of households with income $20k - 30k:| Montville: | 10.8% (27,858) |
| State: | 10.8% (15,045) |
Number of households with income $30k - 40k:| Montville: | 8.2% (21,296) |
| State: | 8.2% (11,501) |
Number of households with income $40k - 50k:| Montville: | 7.4% (19,286) |
| State: | 7.4% (10,416) |
Number of households with income $50k - 60k:| Montville: | 7.5% (19,505) |
| State: | 7.5% (10,534) |
Number of households with income $60k - 75k:| Montville: | 8.0% (20,820) |
| State: | 8.0% (11,244) |
Number of households with income $75k - 100k:| Montville: | 9.6% (24,756) |
| Connecticut: | 9.6% (13,370) |
Number of households with income $100k - 125k:| Montville: | 10.2% (26,375) |
| State: | 10.2% (14,244) |
Number of households with income $125k - 150k:| Montville: | 8.0% (20,824) |
| State: | 8.0% (11,246) |
Number of households with income $150k - 200k:| Montville: | 7.7% (19,863) |
| State: | 7.7% (10,727) |
Number of households with income > $200k:| Montville: | 7.9% (20,527) |
| Connecticut: | 7.9% (11,086) |
Aggregate household income in Montville in 2022: $60,707,398
Median family income in Montville in 2022:| Montville: | $158,062 |
| Connecticut: | $87,228 |
Number of families with income < $10k:| Montville: | 1.1% (2) |
| State: | 3.8% (3,184) |
Number of families with income $40k - 50k:| Montville: | 4.3% (10) |
| State: | 6.6% (5,531) |
Number of families with income $50k - 60k:| Montville: | 8.6% (19) |
| Connecticut: | 5.4% (4,480) |
Number of families with income $60k - 75k:| Montville: | 13.2% (30) |
| Connecticut: | 8.2% (6,861) |
Number of families with income $75k - 100k:| Montville: | 17.1% (38) |
| Connecticut: | 12.7% (10,598) |
Number of families with income $100k - 125k:| Montville: | 22.9% (51) |
| State: | 11.4% (9,482) |
Number of families with income $150k - 200k:| Montville: | 32.9% (74) |
| Connecticut: | 11.4% (9,497) |
Median non-family income in Montville in 2022:| Montville: | $57,518 |
| State: | $38,608 |
Change in median non-family income between 2000 and 2022:| Montville, Connecticut: | +77.0% |
| State: | +77.0% |
Median per capita income in Montville in 2022:| Montville: | $38,982 |
| State: | $36,289 |
Change in median per capita income between 2000 and 2022:| Montville, Connecticut: | +115.2% |
| State: | +117.5% |
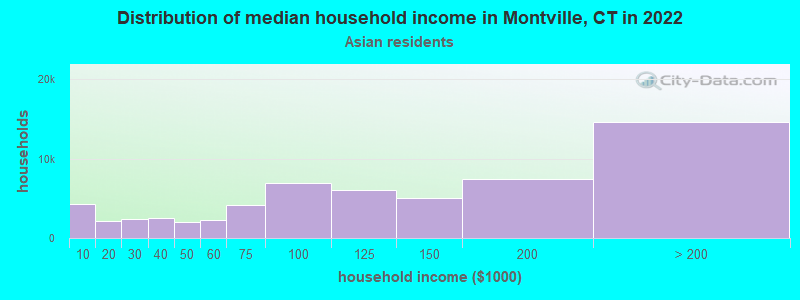
Income statistics for Asian residents
Median household income in Montville, CT in 2022:| Montville: | $129,155 |
| Connecticut: | $110,568 |
Change in median household income between 2000 and 2022:| Montville, Connecticut: | +110.1% |
| State: | +79.5% |
Number of households with income < $10k:| Montville: | 7.1% (4,237) |
| State: | 7.1% (4,245) |
Number of households with income $10k - 20k:| Montville: | 3.5% (2,084) |
| Connecticut: | 3.5% (2,087) |
Number of households with income $20k - 30k:| Montville: | 4.1% (2,460) |
| State: | 4.1% (2,464) |
Number of households with income $30k - 40k:| Montville: | 4.1% (2,473) |
| Connecticut: | 4.1% (2,478) |
Number of households with income $40k - 50k:| Montville: | 3.3% (1,980) |
| State: | 3.3% (1,983) |
Number of households with income $50k - 60k:| Montville: | 3.9% (2,324) |
| Connecticut: | 3.9% (2,328) |
Number of households with income $60k - 75k:| Montville: | 7.0% (4,220) |
| Connecticut: | 7.0% (4,228) |
Number of households with income $75k - 100k:| Montville: | 11.5% (6,899) |
| State: | 11.5% (6,911) |
Number of households with income $100k - 125k:| Montville: | 10.2% (6,116) |
| Connecticut: | 10.2% (6,127) |
Number of households with income $125k - 150k:| Montville: | 8.5% (5,070) |
| State: | 8.5% (5,079) |
Number of households with income $150k - 200k:| Montville: | 12.4% (7,421) |
| State: | 12.4% (7,434) |
Number of households with income > $200k:| Montville: | 24.4% (14,635) |
| State: | 24.4% (14,661) |
Aggregate household income in Montville in 2022: $23,826,095
Median family income in Montville in 2022:| Montville: | $128,936 |
| Connecticut: | $134,548 |
Number of families with income < $10k:| Montville: | 14.6% (16) |
| State: | 4.3% (1,875) |
Number of families with income $10k - 20k:| Montville: | 7.6% (8) |
| State: | 1.6% (700) |
Number of families with income $30k - 40k:| Montville: | 9.2% (10) |
| Connecticut: | 3.8% (1,652) |
Number of families with income $60k - 75k:| Montville: | 14.2% (16) |
| State: | 6.0% (2,651) |
Number of families with income $75k - 100k:| Montville: | 34.2% (38) |
| Connecticut: | 11.0% (4,844) |
Number of families with income $125k - 150k:| Montville: | 20.2% (22) |
| State: | 8.2% (3,588) |
Median non-family income in Montville in 2022:| Montville: | $46,610 |
| State: | $63,785 |
Change in median non-family income between 2000 and 2022:| Montville, Connecticut: | +148.6% |
| State: | +77.9% |
Median per capita income in Montville in 2022:| Montville: | $34,780 |
| State: | $55,295 |
Change in median per capita income between 2000 and 2022:| Montville, Connecticut: | +103.6% |
| State: | +97.8% |
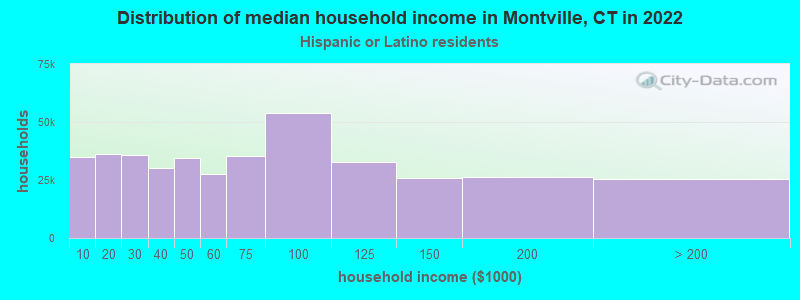
Income statistics for Hispanic or Latino residents
Median household income in Montville, CT in 2022:| Montville: | $100,977 |
| Connecticut: | $60,275 |
Change in median household income between 2000 and 2022:| Montville, Connecticut: | +67.8% |
| Connecticut: | +87.9% |
Number of households with income < $10k:| Montville: | 8.7% (34,867) |
| State: | 8.7% (18,584) |
Number of households with income $10k - 20k:| Montville: | 9.1% (36,089) |
| Connecticut: | 9.1% (19,235) |
Number of households with income $20k - 30k:| Montville: | 8.9% (35,627) |
| Connecticut: | 8.9% (18,989) |
Number of households with income $30k - 40k:| Montville: | 7.5% (29,957) |
| State: | 7.5% (15,967) |
Number of households with income $40k - 50k:| Montville: | 8.7% (34,646) |
| State: | 8.7% (18,466) |
Number of households with income $50k - 60k:| Montville: | 6.9% (27,591) |
| State: | 6.9% (14,706) |
Number of households with income $60k - 75k:| Montville: | 8.9% (35,438) |
| State: | 8.9% (18,888) |
Number of households with income $75k - 100k:| Montville: | 13.5% (53,789) |
| Connecticut: | 13.5% (28,669) |
Number of households with income $100k - 125k:| Montville: | 8.2% (32,710) |
| Connecticut: | 8.2% (17,434) |
Number of households with income $125k - 150k:| Montville: | 6.5% (25,801) |
| State: | 6.5% (13,752) |
Number of households with income $150k - 200k:| Montville: | 6.6% (26,481) |
| State: | 6.6% (14,114) |
Number of households with income > $200k:| Montville: | 6.4% (25,573) |
| Connecticut: | 6.4% (13,630) |
Aggregate household income in Montville in 2022: $68,194,572
Median family income in Montville in 2022:| Montville: | $99,359 |
| Connecticut: | $68,336 |
Number of families with income < $10k:| Montville: | 6.4% (53) |
| State: | 5.2% (7,456) |
Number of families with income $10k - 20k:| Montville: | 5.0% (42) |
| State: | 6.0% (8,616) |
Number of families with income $20k - 30k:| Montville: | 11.7% (98) |
| State: | 8.9% (12,680) |
Number of families with income $30k - 40k:| Montville: | 9.6% (80) |
| Connecticut: | 8.5% (12,090) |
Number of families with income $40k - 50k:| Montville: | 11.7% (97) |
| State: | 8.8% (12,624) |
Number of families with income $50k - 60k:| Montville: | 12.0% (100) |
| State: | 8.4% (11,924) |
Number of families with income $60k - 75k:| Montville: | 11.2% (93) |
| State: | 8.9% (12,677) |
Number of families with income $75k - 100k:| Montville: | 17.2% (143) |
| Connecticut: | 14.3% (20,457) |
Number of families with income $100k - 125k:| Montville: | 5.3% (44) |
| Connecticut: | 8.2% (11,720) |
Number of families with income $125k - 150k:| Montville: | 5.7% (47) |
| State: | 8.2% (11,729) |
Number of families with income $150k - 200k:| Montville: | 2.6% (21) |
| Connecticut: | 7.1% (10,096) |
Number of families with income > $200k:| Montville: | 1.6% (13) |
| State: | 7.4% (10,622) |
Median non-family income in Montville in 2022:| Montville: | $77,705 |
| Connecticut: | $36,714 |
Change in median non-family income between 2000 and 2022:| Montville, Connecticut: | +73.9% |
| State: | +90.0% |
Median per capita income in Montville in 2022:| Montville: | $27,082 |
| State: | $28,507 |
Change in median per capita income between 2000 and 2022:| Montville, Connecticut: | +80.3% |
| Connecticut: | +117.2% |
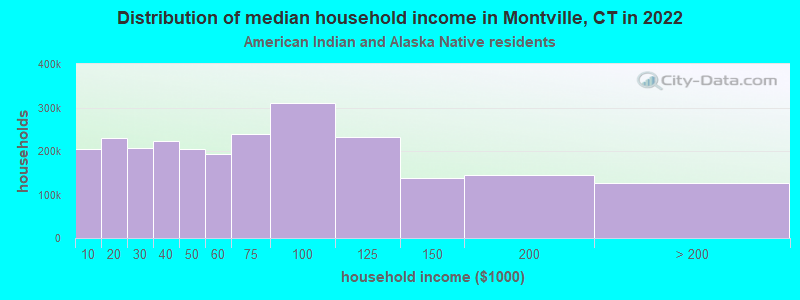
Income statistics for American Indian and Alaska Native residents
Median household income in Montville, CT in 2022:| Montville: | $81,571 |
| State: | $41,848 |
Change in median household income between 2000 and 2022:| Montville, Connecticut: | +12.9% |
| Connecticut: | +12.9% |
Number of households with income < $10k:| Montville: | 8.4% (205,512) |
| State: | 10.2% (340) |
Number of households with income $10k - 20k:| Montville: | 9.4% (229,347) |
| State: | 8.5% (283) |
Number of households with income $20k - 30k:| Montville: | 8.5% (207,447) |
| Connecticut: | 9.4% (314) |
Number of households with income $30k - 40k:| Montville: | 9.1% (222,254) |
| Connecticut: | 10.1% (337) |
Number of households with income $40k - 50k:| Montville: | 8.3% (203,866) |
| State: | 13.4% (447) |
Number of households with income $50k - 60k:| Montville: | 7.8% (192,229) |
| State: | 3.1% (104) |
Number of households with income $60k - 75k:| Montville: | 9.8% (239,605) |
| Connecticut: | 5.6% (188) |
Number of households with income $75k - 100k:| Montville: | 12.6% (309,291) |
| Connecticut: | 13.4% (447) |
Number of households with income $100k - 125k:| Montville: | 9.4% (231,288) |
| State: | 9.5% (317) |
Number of households with income $125k - 150k:| Montville: | 5.6% (138,471) |
| State: | 3.9% (131) |
Number of households with income $150k - 200k:| Montville: | 6.0% (145,975) |
| State: | 6.3% (212) |
Number of households with income > $200k:| Montville: | 5.2% (126,350) |
| State: | 6.8% (228) |
Aggregate household income in Montville in 2022: $7,485,349
Median family income in Montville in 2022:| Montville: | $91,664 |
| State: | $57,217 |
Number of families with income $10k - 20k:| Montville: | 2.5% (5) |
| State: | 7.2% (145) |
Number of families with income $40k - 50k:| Montville: | 5.6% (11) |
| State: | 9.7% (196) |
Number of families with income $50k - 60k:| Montville: | 4.9% (10) |
| State: | 2.3% (46) |
Number of families with income $60k - 75k:| Montville: | 4.4% (9) |
| Connecticut: | 6.9% (139) |
Number of families with income $100k - 125k:| Montville: | 44.6% (88) |
| State: | 7.9% (159) |
Number of families with income $125k - 150k:| Montville: | 38.0% (75) |
| State: | 2.8% (57) |
Median per capita income in Montville in 2022:| Montville: | $36,702 |
| State: | $25,355 |
Change in median per capita income between 2000 and 2022:| Montville, Connecticut: | +45.9% |
| State: | +39.4% |
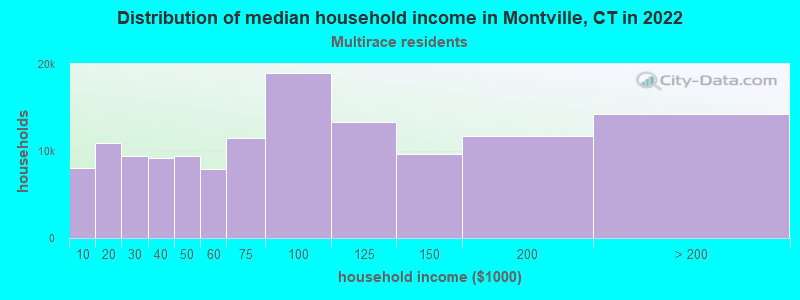
Income statistics for Multirace residents
Median household income in Montville, CT in 2022:| Montville: | $85,644 |
| State: | $77,277 |
Change in median household income between 2000 and 2022:| Montville, Connecticut: | +119.4% |
| State: | +113.6% |
Number of households with income < $10k:| Montville: | 6.0% (8,043) |
| Connecticut: | 6.0% (7,457) |
Number of households with income $10k - 20k:| Montville: | 8.1% (10,936) |
| Connecticut: | 8.1% (10,139) |
Number of households with income $20k - 30k:| Montville: | 7.0% (9,386) |
| State: | 7.0% (8,702) |
Number of households with income $30k - 40k:| Montville: | 6.9% (9,217) |
| State: | 6.9% (8,546) |
Number of households with income $40k - 50k:| Montville: | 7.0% (9,396) |
| State: | 7.0% (8,712) |
Number of households with income $50k - 60k:| Montville: | 5.9% (7,907) |
| Connecticut: | 5.9% (7,331) |
Number of households with income $60k - 75k:| Montville: | 8.5% (11,469) |
| State: | 8.5% (10,634) |
Number of households with income $75k - 100k:| Montville: | 14.1% (18,982) |
| Connecticut: | 14.1% (17,600) |
Number of households with income $100k - 125k:| Montville: | 9.9% (13,356) |
| Connecticut: | 9.9% (12,383) |
Number of households with income $125k - 150k:| Montville: | 7.2% (9,622) |
| State: | 7.2% (8,921) |
Number of households with income $150k - 200k:| Montville: | 8.8% (11,780) |
| State: | 8.8% (10,922) |
Number of households with income > $200k:| Montville: | 10.6% (14,287) |
| State: | 10.6% (13,247) |
Aggregate household income in Montville in 2022: $86,119,456
Median family income in Montville in 2022:| Montville: | $161,863 |
| State: | $84,255 |
Number of families with income $20k - 30k:| Montville: | 3.1% (23) |
| Connecticut: | 6.9% (5,812) |
Number of families with income $30k - 40k:| Montville: | 10.1% (73) |
| Connecticut: | 6.8% (5,759) |
Number of families with income $75k - 100k:| Montville: | 8.5% (61) |
| Connecticut: | 14.5% (12,236) |
Number of families with income $125k - 150k:| Montville: | 78.3% (562) |
| State: | 8.9% (7,503) |
Median non-family income in Montville in 2022:| Montville: | $29,416 |
| State: | $44,462 |
Change in median non-family income between 2000 and 2022:| Montville, Connecticut: | +81.0% |
| State: | +97.6% |
Median per capita income in Montville in 2022:| Montville: | $31,422 |
| State: | $32,794 |
Change in median per capita income between 2000 and 2022:| Montville, Connecticut: | +95.5% |
| State: | +117.2% |
Income statistics for other residents
Number of households with income < $10k:| Montville: | 8.9% (12) |
| Connecticut: | 9.0% (8,596) |
Number of households with income $10k - 20k:| Montville: | 10.4% (14) |
| State: | 10.2% (9,773) |
Number of households with income $20k - 30k:| Montville: | 8.9% (12) |
| Connecticut: | 9.1% (8,691) |
Number of households with income $30k - 40k:| Montville: | 7.4% (10) |
| Connecticut: | 7.8% (7,447) |
Number of households with income $40k - 50k:| Montville: | 8.1% (11) |
| Connecticut: | 8.2% (7,860) |
Number of households with income $50k - 60k:| Montville: | 5.9% (8) |
| Connecticut: | 6.0% (5,757) |
Number of households with income $60k - 75k:| Montville: | 9.6% (13) |
| State: | 9.3% (8,942) |
Number of households with income $75k - 100k:| Montville: | 14.1% (19) |
| State: | 14.3% (13,700) |
Number of households with income $100k - 125k:| Montville: | 7.4% (10) |
| Connecticut: | 7.2% (6,906) |
Number of households with income $125k - 150k:| Montville: | 6.7% (9) |
| Connecticut: | 6.5% (6,215) |
Number of households with income $150k - 200k:| Montville: | 5.9% (8) |
| State: | 6.1% (5,865) |
Number of households with income > $200k:| Montville: | 6.7% (9) |
| State: | 6.3% (6,065) |
Aggregate household income in Montville in 2022: $18,980,493
Median family income in Montville in 2022:| Montville: | $167,425 |
| State: | $67,610 |
Number of families with income $50k - 60k:| Montville: | 15.0% (13) |
| State: | 5.9% (3,868) |
Number of families with income $60k - 75k:| Montville: | 34.7% (29) |
| State: | 9.4% (6,232) |
Number of families with income $75k - 100k:| Montville: | 50.3% (43) |
| State: | 15.7% (10,362) |
Median non-family income in Montville in 2022:| Montville: | $35,962 |
| Connecticut: | $34,285 |
Change in median non-family income between 2000 and 2022:| Montville, Connecticut: | +83.6% |
| State: | +83.6% |
Median per capita income in Montville in 2022:| Montville: | $29,349 |
| State: | $29,353 |