Lynchburg, Tennessee (TN) income map, earnings map, and wages data
The median household income in Lynchburg, TN in 2022 was $70,568, which was 7.5% greater than the median annual income of $65,254 across the entire state of Tennessee. Compared to the median income of $36,591 in 2000 this represents an increase of 48.1%. The per capita income in 2022 was $35,826, which means an increase of 46.9% compared to 2000 when it was $19,040.
Whole page based on the data from 2000 / 2022 when the population of Lynchburg, Tennessee was 5,740 / 6,679
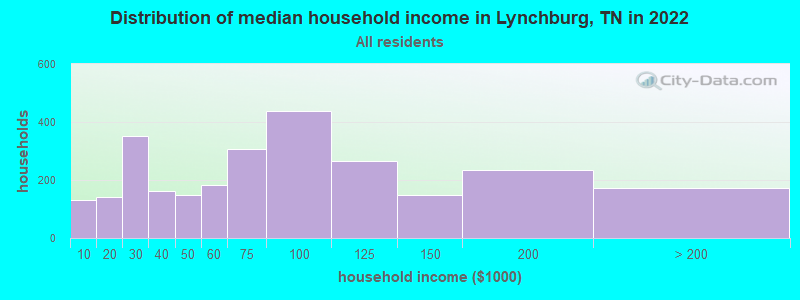
Income statistics for all residents
Median household income in Lynchburg, TN in 2022:| Lynchburg: | $70,568 |
| Tennessee: | $65,254 |
Change in median household income between 2000 and 2022:| Lynchburg, Tennessee: | +92.9% |
| Tennessee: | +79.5% |
Number of households with income < $10k:| Lynchburg: | 4.9% (131) |
| State: | 5.4% (154,793) |
Number of households with income $10k - 20k:| Lynchburg: | 5.3% (141) |
| Tennessee: | 8.0% (228,599) |
Number of households with income $20k - 30k:| Lynchburg: | 13.1% (352) |
| Tennessee: | 7.9% (224,908) |
Number of households with income $30k - 40k:| Lynchburg: | 6.1% (163) |
| Tennessee: | 8.6% (244,297) |
Number of households with income $40k - 50k:| Lynchburg: | 5.5% (147) |
| State: | 8.4% (238,949) |
Number of households with income $50k - 60k:| Lynchburg: | 6.8% (183) |
| Tennessee: | 7.7% (218,438) |
Number of households with income $60k - 75k:| Lynchburg: | 11.5% (308) |
| State: | 10.3% (294,172) |
Number of households with income $75k - 100k:| Lynchburg: | 16.3% (437) |
| State: | 13.3% (377,310) |
Number of households with income $100k - 125k:| Lynchburg: | 9.9% (267) |
| Tennessee: | 9.5% (269,124) |
Number of households with income $125k - 150k:| Lynchburg: | 5.5% (147) |
| Tennessee: | 6.3% (178,328) |
Number of households with income $150k - 200k:| Lynchburg: | 8.8% (235) |
| State: | 7.2% (204,030) |
Number of households with income > $200k:| Lynchburg: | 6.4% (173) |
| Tennessee: | 7.5% (213,736) |
Aggregate household income in Lynchburg in 2022: $233,773,501
Median family income in Lynchburg in 2022:| Lynchburg: | $83,060 |
| State: | $80,910 |
Number of families with income < $10k:| Lynchburg: | 4.4% (84) |
| State: | 3.9% (72,917) |
Number of families with income $10k - 20k:| Lynchburg: | 2.7% (52) |
| State: | 4.0% (73,770) |
Number of families with income $20k - 30k:| Lynchburg: | 6.9% (132) |
| State: | 5.6% (104,070) |
Number of families with income $30k - 40k:| Lynchburg: | 6.0% (115) |
| State: | 7.2% (133,292) |
Number of families with income $40k - 50k:| Lynchburg: | 5.3% (101) |
| State: | 7.4% (136,997) |
Number of families with income $50k - 60k:| Lynchburg: | 7.9% (150) |
| Tennessee: | 7.1% (131,374) |
Number of families with income $60k - 75k:| Lynchburg: | 10.2% (193) |
| State: | 10.8% (198,685) |
Number of families with income $75k - 100k:| Lynchburg: | 18.5% (352) |
| Tennessee: | 15.1% (279,195) |
Number of families with income $100k - 125k:| Lynchburg: | 11.8% (225) |
| Tennessee: | 11.7% (216,356) |
Number of families with income $125k - 150k:| Lynchburg: | 5.9% (112) |
| Tennessee: | 7.8% (144,000) |
Number of families with income $150k - 200k:| Lynchburg: | 11.6% (221) |
| Tennessee: | 9.3% (172,160) |
Number of families with income > $200k:| Lynchburg: | 8.7% (165) |
| Tennessee: | 10.0% (183,756) |
Median non-family income in Lynchburg in 2022:| Lynchburg: | $30,777 |
| State: | $40,285 |
Change in median non-family income between 2000 and 2022:| Lynchburg, Tennessee: | +71.4% |
| Tennessee: | +91.5% |
Median per capita income in Lynchburg in 2022:| Lynchburg: | $35,826 |
| Tennessee: | $36,704 |
Change in median per capita income between 2000 and 2022:| Lynchburg, Tennessee: | +88.2% |
| State: | +89.3% |
Income statistics for White residents
Median household income in Lynchburg, TN in 2022:| Lynchburg: | $73,341 |
| State: | $69,826 |
Change in median household income between 2000 and 2022:| Lynchburg, Tennessee: | +96.5% |
| State: | +82.9% |
Number of households with income < $10k:| Lynchburg: | 4.9% (123) |
| Tennessee: | 4.6% (100,279) |
Number of households with income $10k - 20k:| Lynchburg: | 5.2% (130) |
| State: | 7.6% (165,031) |
Number of households with income $20k - 30k:| Lynchburg: | 12.7% (318) |
| Tennessee: | 7.4% (160,229) |
Number of households with income $30k - 40k:| Lynchburg: | 5.4% (134) |
| State: | 8.1% (174,784) |
Number of households with income $40k - 50k:| Lynchburg: | 5.5% (138) |
| State: | 7.8% (169,622) |
Number of households with income $50k - 60k:| Lynchburg: | 5.6% (140) |
| State: | 7.6% (165,508) |
Number of households with income $60k - 75k:| Lynchburg: | 12.1% (303) |
| State: | 10.3% (223,937) |
Number of households with income $75k - 100k:| Lynchburg: | 17.0% (425) |
| State: | 13.5% (292,688) |
Number of households with income $100k - 125k:| Lynchburg: | 10.4% (259) |
| State: | 10.1% (219,251) |
Number of households with income $125k - 150k:| Lynchburg: | 5.3% (133) |
| Tennessee: | 6.6% (142,574) |
Number of households with income $150k - 200k:| Lynchburg: | 9.0% (226) |
| Tennessee: | 7.7% (166,039) |
Number of households with income > $200k:| Lynchburg: | 6.9% (173) |
| State: | 8.5% (184,546) |
Aggregate household income in Lynchburg in 2022: $223,762,353
Median family income in Lynchburg in 2022:| Lynchburg: | $88,390 |
| State: | $86,015 |
Number of families with income < $10k:| Lynchburg: | 4.2% (75) |
| State: | 3.1% (43,751) |
Number of families with income $10k - 20k:| Lynchburg: | 2.9% (52) |
| State: | 3.5% (49,925) |
Number of families with income $20k - 30k:| Lynchburg: | 7.3% (129) |
| Tennessee: | 5.0% (70,431) |
Number of families with income $30k - 40k:| Lynchburg: | 4.7% (84) |
| Tennessee: | 6.6% (93,498) |
Number of families with income $40k - 50k:| Lynchburg: | 5.3% (94) |
| Tennessee: | 6.8% (96,726) |
Number of families with income $50k - 60k:| Lynchburg: | 6.1% (108) |
| Tennessee: | 7.2% (101,879) |
Number of families with income $60k - 75k:| Lynchburg: | 10.7% (189) |
| Tennessee: | 10.7% (151,997) |
Number of families with income $75k - 100k:| Lynchburg: | 19.1% (340) |
| State: | 15.4% (218,373) |
Number of families with income $100k - 125k:| Lynchburg: | 12.3% (218) |
| State: | 12.6% (178,761) |
Number of families with income $125k - 150k:| Lynchburg: | 6.1% (109) |
| Tennessee: | 8.2% (116,575) |
Number of families with income $150k - 200k:| Lynchburg: | 11.9% (212) |
| State: | 9.9% (141,123) |
Number of families with income > $200k:| Lynchburg: | 9.3% (166) |
| State: | 11.2% (159,431) |
Median non-family income in Lynchburg in 2022:| Lynchburg: | $30,801 |
| Tennessee: | $41,178 |
Change in median non-family income between 2000 and 2022:| Lynchburg, Tennessee: | +74.9% |
| Tennessee: | +91.1% |
Median per capita income in Lynchburg in 2022:| Lynchburg: | $37,431 |
| State: | $40,126 |
Change in median per capita income between 2000 and 2022:| Lynchburg, Tennessee: | +96.9% |
| Tennessee: | +92.6% |
Income statistics for Black or African American residents
Median household income in Lynchburg, TN in 2022:| Lynchburg: | $28,180 |
| Tennessee: | $49,531 |
Change in median household income between 2000 and 2022:| Lynchburg, Tennessee: | +22.7% |
| Tennessee: | +82.3% |
Number of households with income < $10k:| Lynchburg: | 0.0% (0) |
| State: | 9.1% (39,909) |
Number of households with income $10k - 20k:| Lynchburg: | 9.5% (4) |
| Tennessee: | 10.5% (46,276) |
Number of households with income $20k - 30k:| Lynchburg: | 61.9% (26) |
| Tennessee: | 10.2% (45,072) |
Number of households with income $30k - 40k:| Lynchburg: | 19.0% (8) |
| State: | 10.0% (43,885) |
Number of households with income $40k - 50k:| Lynchburg: | 0.0% (0) |
| State: | 10.7% (47,267) |
Number of households with income $50k - 60k:| Lynchburg: | 0.0% (0) |
| State: | 7.7% (33,868) |
Number of households with income $60k - 75k:| Lynchburg: | 0.0% (0) |
| State: | 10.5% (46,247) |
Number of households with income $75k - 100k:| Lynchburg: | 0.0% (0) |
| State: | 12.6% (55,465) |
Number of households with income $100k - 125k:| Lynchburg: | 9.5% (4) |
| State: | 6.7% (29,515) |
Number of households with income $125k - 150k:| Lynchburg: | 0.0% (0) |
| State: | 4.8% (21,306) |
Number of households with income $150k - 200k:| Lynchburg: | 0.0% (0) |
| State: | 4.6% (20,425) |
Number of households with income > $200k:| Lynchburg: | 0.0% (0) |
| Tennessee: | 2.5% (11,183) |
Aggregate household income in Lynchburg in 2022: $1,607,101
Median per capita income in Lynchburg in 2022:| Lynchburg: | $9,749 |
| State: | $27,306 |
Income statistics for Asian residents
Median per capita income in Lynchburg in 2022:| Lynchburg: | $75,748 |
| State: | $46,931 |
Change in median per capita income between 2000 and 2022:| Lynchburg, Tennessee: | +84.4% |
| State: | +130.8% |
Income statistics for Hispanic or Latino residents
Median per capita income in Lynchburg in 2022:| Lynchburg: | $28,747 |
| State: | $21,276 |
Income statistics for American Indian and Alaska Native residents
Aggregate household income in Lynchburg in 2022: $9,313,531
Median per capita income in Lynchburg in 2022:| Lynchburg: | $31,054 |
| State: | $25,981 |
Change in median per capita income between 2000 and 2022:| Lynchburg, Tennessee: | +46.0% |
| State: | +40.2% |
Income statistics for Multirace residents
Median household income in Lynchburg, TN in 2022:| Lynchburg: | $56,570 |
| Tennessee: | $57,741 |
Change in median household income between 2000 and 2022:| Lynchburg, Tennessee: | +56.1% |
| State: | +87.1% |
Number of households with income < $10k:| Lynchburg: | 11.3% (13) |
| State: | 6.7% (9,867) |
Number of households with income $10k - 20k:| Lynchburg: | 0.0% (0) |
| State: | 8.6% (12,639) |
Number of households with income $20k - 30k:| Lynchburg: | 0.0% (0) |
| Tennessee: | 9.2% (13,555) |
Number of households with income $30k - 40k:| Lynchburg: | 27.0% (31) |
| Tennessee: | 10.3% (15,117) |
Number of households with income $40k - 50k:| Lynchburg: | 0.0% (0) |
| State: | 9.4% (13,829) |
Number of households with income $50k - 60k:| Lynchburg: | 47.8% (55) |
| State: | 7.5% (10,969) |
Number of households with income $60k - 75k:| Lynchburg: | 0.0% (0) |
| Tennessee: | 9.2% (13,568) |
Number of households with income $75k - 100k:| Lynchburg: | 0.0% (0) |
| Tennessee: | 12.6% (18,516) |
Number of households with income $100k - 125k:| Lynchburg: | 0.0% (0) |
| State: | 8.6% (12,656) |
Number of households with income $125k - 150k:| Lynchburg: | 13.9% (16) |
| State: | 5.9% (8,674) |
Number of households with income $150k - 200k:| Lynchburg: | 0.0% (0) |
| State: | 7.2% (10,611) |
Number of households with income > $200k:| Lynchburg: | 0.0% (0) |
| State: | 4.8% (6,986) |
Aggregate household income in Lynchburg in 2022: $5,931,521
Median family income in Lynchburg in 2022:| Lynchburg: | $59,625 |
| State: | $70,058 |
Number of families with income < $10k:| Lynchburg: | 13.7% (13) |
| Tennessee: | 5.6% (5,426) |
Number of families with income $30k - 40k:| Lynchburg: | 25.1% (24) |
| State: | 9.0% (8,699) |
Number of families with income $50k - 60k:| Lynchburg: | 61.1% (58) |
| Tennessee: | 6.9% (6,630) |
Median per capita income in Lynchburg in 2022:| Lynchburg: | $42,208 |
| State: | $24,436 |
Change in median per capita income between 2000 and 2022:| Lynchburg, Tennessee: | +147.3% |
| Tennessee: | +84.3% |
Income statistics for other residents
Median per capita income in Lynchburg in 2022:| Lynchburg: | $28,886 |
| Tennessee: | $21,430 |