Londontowne, Maryland (MD) income map, earnings map, and wages data
The median household income in Londontowne, MD in 2022 was $115,419, which was 17.7% greater than the median annual income of $94,991 across the entire state of Maryland. Compared to the median income of $63,021 in 2000 this represents an increase of 45.4%. The per capita income in 2022 was $63,238, which means an increase of 50.6% compared to 2000 when it was $31,245.
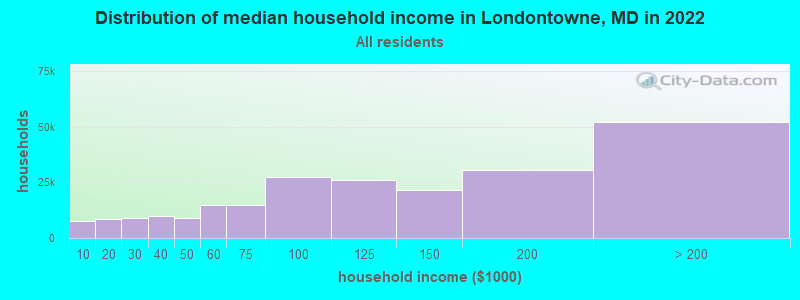
Income statistics for all residents
Median household income in Londontowne, MD in 2022:| Londontowne: | $115,420 |
| Maryland: | $94,991 |
Change in median household income between 2000 and 2022:| Londontowne, Maryland: | +83.1% |
| State: | +79.7% |
Number of households with income < $10k:| Londontowne: | 3.2% (7,439) |
| State: | 4.8% (114,450) |
Number of households with income $10k - 20k:| Londontowne: | 3.8% (8,682) |
| State: | 5.0% (117,883) |
Number of households with income $20k - 30k:| Londontowne: | 3.9% (9,011) |
| Maryland: | 5.2% (123,350) |
Number of households with income $30k - 40k:| Londontowne: | 4.3% (9,944) |
| State: | 5.6% (134,104) |
Number of households with income $40k - 50k:| Londontowne: | 3.9% (8,912) |
| State: | 5.6% (132,932) |
Number of households with income $50k - 60k:| Londontowne: | 6.3% (14,645) |
| State: | 5.6% (132,707) |
Number of households with income $60k - 75k:| Londontowne: | 6.4% (14,771) |
| Maryland: | 7.9% (188,335) |
Number of households with income $75k - 100k:| Londontowne: | 11.9% (27,406) |
| State: | 12.5% (297,873) |
Number of households with income $100k - 125k:| Londontowne: | 11.3% (25,986) |
| State: | 10.5% (250,497) |
Number of households with income $125k - 150k:| Londontowne: | 9.4% (21,692) |
| State: | 8.1% (193,208) |
Number of households with income $150k - 200k:| Londontowne: | 13.1% (30,329) |
| State: | 11.6% (274,905) |
Number of households with income > $200k:| Londontowne: | 22.5% (52,059) |
| Maryland: | 17.5% (415,740) |
Aggregate household income in Londontowne in 2022: $3,470,830,700
Median family income in Londontowne in 2022:| Londontowne: | $133,074 |
| Maryland: | $117,294 |
Median non-family income in Londontowne in 2022:| Londontowne: | $84,007 |
| Maryland: | $57,179 |
Change in median non-family income between 2000 and 2022:| Londontowne, Maryland: | +71.1% |
| State: | +75.1% |
Median per capita income in Londontowne in 2022:| Londontowne: | $63,239 |
| Maryland: | $49,236 |
Change in median per capita income between 2000 and 2022:| Londontowne, Maryland: | +102.4% |
| State: | +92.2% |
Income statistics for White residents
Median household income in Londontowne, MD in 2022:| Londontowne: | $121,993 |
| Maryland: | $107,160 |
Change in median household income between 2000 and 2022:| Londontowne, Maryland: | +92.5% |
| Maryland: | +85.3% |
Number of households with income < $10k:| Londontowne: | 2.9% (4,402) |
| Maryland: | 3.7% (47,387) |
Number of households with income $10k - 20k:| Londontowne: | 3.0% (4,529) |
| State: | 4.1% (52,102) |
Number of households with income $20k - 30k:| Londontowne: | 3.3% (5,091) |
| Maryland: | 4.6% (58,758) |
Number of households with income $30k - 40k:| Londontowne: | 4.1% (6,209) |
| State: | 4.7% (59,745) |
Number of households with income $40k - 50k:| Londontowne: | 4.0% (6,113) |
| Maryland: | 5.0% (62,576) |
Number of households with income $50k - 60k:| Londontowne: | 4.4% (6,705) |
| State: | 5.1% (64,484) |
Number of households with income $60k - 75k:| Londontowne: | 6.8% (10,493) |
| Maryland: | 7.7% (97,019) |
Number of households with income $75k - 100k:| Londontowne: | 11.0% (16,867) |
| Maryland: | 11.8% (149,205) |
Number of households with income $100k - 125k:| Londontowne: | 11.0% (16,847) |
| State: | 10.6% (134,231) |
Number of households with income $125k - 150k:| Londontowne: | 10.8% (16,542) |
| Maryland: | 8.8% (111,081) |
Number of households with income $150k - 200k:| Londontowne: | 13.6% (20,857) |
| State: | 12.9% (162,966) |
Number of households with income > $200k:| Londontowne: | 25.2% (38,531) |
| State: | 20.9% (264,377) |
Aggregate household income in Londontowne in 2022: $2,505,520,333
Median family income in Londontowne in 2022:| Londontowne: | $138,609 |
| Maryland: | $134,708 |
Number of families with income < $10k:| Londontowne: | 1.1% (20) |
| State: | 1.6% (13,064) |
Number of families with income $10k - 20k:| Londontowne: | 2.2% (38) |
| State: | 2.0% (16,048) |
Number of families with income $20k - 30k:| Londontowne: | 1.9% (33) |
| State: | 2.2% (18,018) |
Number of families with income $30k - 40k:| Londontowne: | 2.0% (34) |
| Maryland: | 3.3% (26,886) |
Number of families with income $40k - 50k:| Londontowne: | 3.4% (59) |
| State: | 3.6% (29,194) |
Number of families with income $50k - 60k:| Londontowne: | 4.2% (73) |
| Maryland: | 4.1% (33,120) |
Number of families with income $60k - 75k:| Londontowne: | 6.9% (121) |
| State: | 6.6% (53,501) |
Number of families with income $75k - 100k:| Londontowne: | 12.6% (219) |
| State: | 11.3% (91,779) |
Number of families with income $100k - 125k:| Londontowne: | 8.4% (146) |
| Maryland: | 11.3% (91,483) |
Number of families with income $125k - 150k:| Londontowne: | 8.8% (153) |
| State: | 9.9% (80,832) |
Number of families with income $150k - 200k:| Londontowne: | 5.2% (90) |
| State: | 16.0% (130,295) |
Number of families with income > $200k:| Londontowne: | 43.3% (753) |
| Maryland: | 28.1% (228,324) |
Median non-family income in Londontowne in 2022:| Londontowne: | $87,324 |
| State: | $61,991 |
Change in median non-family income between 2000 and 2022:| Londontowne, Maryland: | +76.2% |
| Maryland: | +76.8% |
Median per capita income in Londontowne in 2022:| Londontowne: | $68,712 |
| State: | $59,750 |
Change in median per capita income between 2000 and 2022:| Londontowne, Maryland: | +117.7% |
| State: | +104.5% |
Income statistics for Black or African American residents
Median household income in Londontowne, MD in 2022:| Londontowne: | $97,858 |
| Maryland: | $77,368 |
Change in median household income between 2000 and 2022:| Londontowne, Maryland: | +82.8% |
| Maryland: | +85.7% |
Number of households with income < $10k:| Londontowne: | 4.2% (2,045) |
| State: | 7.0% (50,093) |
Number of households with income $10k - 20k:| Londontowne: | 7.0% (3,403) |
| Maryland: | 7.2% (51,849) |
Number of households with income $20k - 30k:| Londontowne: | 6.0% (2,901) |
| State: | 5.8% (41,510) |
Number of households with income $30k - 40k:| Londontowne: | 6.1% (2,981) |
| State: | 6.9% (49,466) |
Number of households with income $40k - 50k:| Londontowne: | 3.5% (1,722) |
| State: | 6.6% (47,557) |
Number of households with income $50k - 60k:| Londontowne: | 10.6% (5,140) |
| Maryland: | 6.2% (44,818) |
Number of households with income $60k - 75k:| Londontowne: | 4.9% (2,380) |
| State: | 8.6% (61,728) |
Number of households with income $75k - 100k:| Londontowne: | 13.8% (6,689) |
| State: | 13.2% (95,107) |
Number of households with income $100k - 125k:| Londontowne: | 11.2% (5,432) |
| State: | 10.2% (73,579) |
Number of households with income $125k - 150k:| Londontowne: | 4.8% (2,329) |
| Maryland: | 7.2% (51,970) |
Number of households with income $150k - 200k:| Londontowne: | 11.6% (5,640) |
| State: | 9.4% (67,623) |
Number of households with income > $200k:| Londontowne: | 16.4% (7,956) |
| State: | 11.7% (83,862) |
Aggregate household income in Londontowne in 2022: $25,597,836
Median family income in Londontowne in 2022:| Londontowne: | $113,122 |
| Maryland: | $96,241 |
Number of families with income $20k - 30k:| Londontowne: | 1.8% (4) |
| State: | 4.3% (18,629) |
Number of families with income $50k - 60k:| Londontowne: | 15.0% (36) |
| State: | 5.9% (25,636) |
Number of families with income $75k - 100k:| Londontowne: | 5.0% (12) |
| State: | 12.8% (55,976) |
Number of families with income > $200k:| Londontowne: | 78.2% (189) |
| State: | 16.5% (71,997) |
Median non-family income in Londontowne in 2022:| Londontowne: | $61,714 |
| State: | $49,944 |
Change in median non-family income between 2000 and 2022:| Londontowne, Maryland: | +71.6% |
| State: | +71.8% |
Median per capita income in Londontowne in 2022:| Londontowne: | $68,036 |
| State: | $40,756 |
Change in median per capita income between 2000 and 2022:| Londontowne, Maryland: | +133.3% |
| State: | +113.5% |
Income statistics for Asian residents
Median household income in Londontowne, MD in 2022:| Londontowne: | $300,949 |
| Maryland: | $117,771 |
Change in median household income between 2000 and 2022:| Londontowne, Maryland: | +99.8% |
| State: | +97.6% |
Number of households with income < $10k:| Londontowne: | 3.9% (963) |
| State: | 4.6% (6,395) |
Number of households with income $10k - 20k:| Londontowne: | 2.6% (634) |
| Maryland: | 3.6% (4,994) |
Number of households with income $20k - 30k:| Londontowne: | 1.1% (257) |
| State: | 4.6% (6,399) |
Number of households with income $30k - 40k:| Londontowne: | 3.2% (779) |
| State: | 3.4% (4,682) |
Number of households with income $40k - 50k:| Londontowne: | 6.7% (1,632) |
| State: | 4.6% (6,382) |
Number of households with income $50k - 60k:| Londontowne: | 13.3% (3,249) |
| State: | 4.6% (6,402) |
Number of households with income $60k - 75k:| Londontowne: | 1.7% (426) |
| State: | 5.4% (7,426) |
Number of households with income $75k - 100k:| Londontowne: | 15.8% (3,868) |
| State: | 11.1% (15,313) |
Number of households with income $100k - 125k:| Londontowne: | 12.1% (2,968) |
| Maryland: | 10.6% (14,640) |
Number of households with income $125k - 150k:| Londontowne: | 8.4% (2,055) |
| Maryland: | 8.3% (11,465) |
Number of households with income $150k - 200k:| Londontowne: | 15.8% (3,853) |
| State: | 13.4% (18,490) |
Number of households with income > $200k:| Londontowne: | 15.4% (3,776) |
| State: | 25.6% (35,377) |
Aggregate household income in Londontowne in 2022: $7,815,679
Median family income in Londontowne in 2022:| Londontowne: | $316,000 |
| Maryland: | $137,857 |
Number of families with income $40k - 50k:| Londontowne: | 8.2% (5) |
| Maryland: | 4.1% (4,351) |
Number of families with income $150k - 200k:| Londontowne: | 91.8% (56) |
| State: | 15.2% (16,182) |
Median per capita income in Londontowne in 2022:| Londontowne: | $82,167 |
| State: | $53,546 |
Change in median per capita income between 2000 and 2022:| Londontowne, Maryland: | +118.1% |
| State: | +122.9% |
Income statistics for Hispanic or Latino residents
Median household income in Londontowne, MD in 2022:| Londontowne: | $132,387 |
| State: | $82,138 |
Change in median household income between 2000 and 2022:| Londontowne, Maryland: | +72.9% |
| State: | +70.2% |
Number of households with income < $10k:| Londontowne: | 5.1% (930) |
| State: | 3.7% (6,871) |
Number of households with income $10k - 20k:| Londontowne: | 3.6% (656) |
| State: | 2.9% (5,465) |
Number of households with income $20k - 30k:| Londontowne: | 6.5% (1,195) |
| State: | 5.9% (11,012) |
Number of households with income $30k - 40k:| Londontowne: | 3.2% (592) |
| Maryland: | 7.9% (14,668) |
Number of households with income $40k - 50k:| Londontowne: | 3.2% (580) |
| State: | 7.6% (14,074) |
Number of households with income $50k - 60k:| Londontowne: | 9.6% (1,764) |
| State: | 7.6% (14,166) |
Number of households with income $60k - 75k:| Londontowne: | 7.4% (1,350) |
| State: | 9.9% (18,486) |
Number of households with income $75k - 100k:| Londontowne: | 11.6% (2,135) |
| Maryland: | 16.1% (30,032) |
Number of households with income $100k - 125k:| Londontowne: | 11.9% (2,183) |
| State: | 9.4% (17,432) |
Number of households with income $125k - 150k:| Londontowne: | 9.0% (1,658) |
| State: | 7.5% (13,963) |
Number of households with income $150k - 200k:| Londontowne: | 10.5% (1,920) |
| Maryland: | 10.1% (18,750) |
Number of households with income > $200k:| Londontowne: | 18.5% (3,394) |
| Maryland: | 11.4% (21,133) |
Aggregate household income in Londontowne in 2022: $27,007,340
Median family income in Londontowne in 2022:| Londontowne: | $122,587 |
| State: | $80,127 |
Number of families with income < $10k:| Londontowne: | 4.6% (9) |
| Maryland: | 3.1% (4,499) |
Number of families with income $10k - 20k:| Londontowne: | 0.6% (1) |
| State: | 2.2% (3,250) |
Number of families with income $20k - 30k:| Londontowne: | 6.2% (12) |
| Maryland: | 6.8% (10,000) |
Number of families with income $30k - 40k:| Londontowne: | 1.4% (3) |
| Maryland: | 7.6% (11,123) |
Number of families with income $40k - 50k:| Londontowne: | 3.4% (6) |
| State: | 8.1% (11,900) |
Number of families with income $50k - 60k:| Londontowne: | 13.0% (24) |
| Maryland: | 8.5% (12,561) |
Number of families with income $60k - 75k:| Londontowne: | 12.0% (22) |
| State: | 10.2% (15,051) |
Number of families with income $75k - 100k:| Londontowne: | 14.8% (27) |
| Maryland: | 14.6% (21,440) |
Number of families with income $100k - 125k:| Londontowne: | 6.9% (13) |
| State: | 9.6% (14,146) |
Number of families with income $125k - 150k:| Londontowne: | 6.9% (13) |
| Maryland: | 6.9% (10,202) |
Number of families with income $150k - 200k:| Londontowne: | 2.3% (4) |
| State: | 10.7% (15,752) |
Number of families with income > $200k:| Londontowne: | 27.9% (52) |
| Maryland: | 11.6% (17,028) |
Median non-family income in Londontowne in 2022:| Londontowne: | $71,781 |
| State: | $55,347 |
Change in median non-family income between 2000 and 2022:| Londontowne, Maryland: | +64.1% |
| State: | +61.9% |
Median per capita income in Londontowne in 2022:| Londontowne: | $29,041 |
| State: | $29,024 |
Change in median per capita income between 2000 and 2022:| Londontowne, Maryland: | +70.9% |
| State: | +79.2% |
Income statistics for American Indian and Alaska Native residents
Number of households with income < $10k:| Londontowne: | 4.6% (486) |
| State: | 4.6% (360) |
Number of households with income $10k - 20k:| Londontowne: | 8.1% (853) |
| Maryland: | 8.1% (632) |
Number of households with income $20k - 30k:| Londontowne: | 5.8% (612) |
| State: | 5.8% (454) |
Number of households with income $30k - 40k:| Londontowne: | 6.7% (705) |
| State: | 6.7% (522) |
Number of households with income $40k - 50k:| Londontowne: | 12.9% (1,364) |
| Maryland: | 12.9% (1,010) |
Number of households with income $50k - 60k:| Londontowne: | 7.0% (737) |
| State: | 7.0% (546) |
Number of households with income $60k - 75k:| Londontowne: | 8.1% (857) |
| State: | 8.1% (635) |
Number of households with income $75k - 100k:| Londontowne: | 7.0% (744) |
| State: | 7.0% (551) |
Number of households with income $100k - 125k:| Londontowne: | 9.0% (948) |
| State: | 9.0% (702) |
Number of households with income $125k - 150k:| Londontowne: | 6.9% (730) |
| State: | 6.9% (541) |
Number of households with income $150k - 200k:| Londontowne: | 12.4% (1,312) |
| State: | 12.4% (972) |
Number of households with income > $200k:| Londontowne: | 11.7% (1,236) |
| Maryland: | 11.7% (916) |
Median per capita income in Londontowne in 2022:| Londontowne: | $30,992 |
| State: | $35,089 |
Change in median per capita income between 2000 and 2022:| Londontowne, Maryland: | +2.2% |
| State: | +56.2% |
Income statistics for Multirace residents
Median household income in Londontowne, MD in 2022:| Londontowne: | $26,947 |
| State: | $99,027 |
Change in median household income between 2000 and 2022:| Londontowne, Maryland: | +96.0% |
| Maryland: | +111.4% |
Number of households with income < $10k:| Londontowne: | 2.3% (66) |
| State: | 4.8% (6,469) |
Number of households with income $10k - 20k:| Londontowne: | 2.7% (77) |
| State: | 3.3% (4,464) |
Number of households with income $20k - 30k:| Londontowne: | 2.5% (72) |
| Maryland: | 5.8% (7,826) |
Number of households with income $30k - 40k:| Londontowne: | 1.4% (40) |
| State: | 8.1% (11,077) |
Number of households with income $40k - 50k:| Londontowne: | 0.7% (19) |
| State: | 4.3% (5,895) |
Number of households with income $50k - 60k:| Londontowne: | 8.5% (240) |
| Maryland: | 3.9% (5,346) |
Number of households with income $60k - 75k:| Londontowne: | 7.6% (214) |
| State: | 6.7% (9,159) |
Number of households with income $75k - 100k:| Londontowne: | 18.3% (518) |
| Maryland: | 13.6% (18,420) |
Number of households with income $100k - 125k:| Londontowne: | 13.6% (385) |
| State: | 12.9% (17,488) |
Number of households with income $125k - 150k:| Londontowne: | 9.0% (255) |
| Maryland: | 8.1% (11,039) |
Number of households with income $150k - 200k:| Londontowne: | 14.1% (399) |
| Maryland: | 11.5% (15,675) |
Number of households with income > $200k:| Londontowne: | 19.3% (548) |
| State: | 17.0% (23,059) |
Aggregate household income in Londontowne in 2022: $1,265,653
Median family income in Londontowne in 2022:| Londontowne: | $28,434 |
| State: | $110,784 |
Number of families with income $10k - 20k:| Londontowne: | 100.0% (39) |
| State: | 2.2% (2,090) |
Median per capita income in Londontowne in 2022:| Londontowne: | $16,824 |
| Maryland: | $35,630 |
Change in median per capita income between 2000 and 2022:| Londontowne, Maryland: | +122.7% |
| State: | +125.1% |
Income statistics for other residents
Number of households with income < $10k:| Londontowne: | 5.3% (344) |
| State: | 3.4% (3,746) |
Number of households with income $10k - 20k:| Londontowne: | 5.2% (340) |
| Maryland: | 3.5% (3,842) |
Number of households with income $20k - 30k:| Londontowne: | 9.5% (616) |
| State: | 7.6% (8,343) |
Number of households with income $30k - 40k:| Londontowne: | 5.2% (338) |
| State: | 7.5% (8,251) |
Number of households with income $40k - 50k:| Londontowne: | 5.3% (341) |
| Maryland: | 8.6% (9,414) |
Number of households with income $50k - 60k:| Londontowne: | 13.1% (851) |
| Maryland: | 10.0% (11,048) |
Number of households with income $60k - 75k:| Londontowne: | 8.3% (536) |
| State: | 11.2% (12,339) |
Number of households with income $75k - 100k:| Londontowne: | 5.0% (326) |
| State: | 17.5% (19,277) |
Number of households with income $100k - 125k:| Londontowne: | 11.4% (739) |
| Maryland: | 8.9% (9,813) |
Number of households with income $125k - 150k:| Londontowne: | 7.6% (493) |
| Maryland: | 6.3% (6,907) |
Number of households with income $150k - 200k:| Londontowne: | 7.8% (508) |
| Maryland: | 8.2% (9,023) |
Number of households with income > $200k:| Londontowne: | 16.3% (1,055) |
| Maryland: | 7.3% (8,036) |
Median per capita income in Londontowne in 2022:| Londontowne: | $28,538 |
| Maryland: | $24,415 |
Change in median per capita income between 2000 and 2022:| Londontowne, Maryland: | +109.3% |
| State: | +73.6% |