The median household income in Lindenhurst, IL in 2022 was $120,979, which was 36.6% greater than the median annual income of $76,708 across the entire state of Illinois. Compared to the median income of $74,841 in 2000 this represents an increase of 38.1%. The per capita income in 2022 was $47,967, which means an increase of 42.6% compared to 2000 when it was $27,534.
Whole page based on the data from 2000 / 2022 when the population of Lindenhurst, Illinois was 12,539 / 14,322
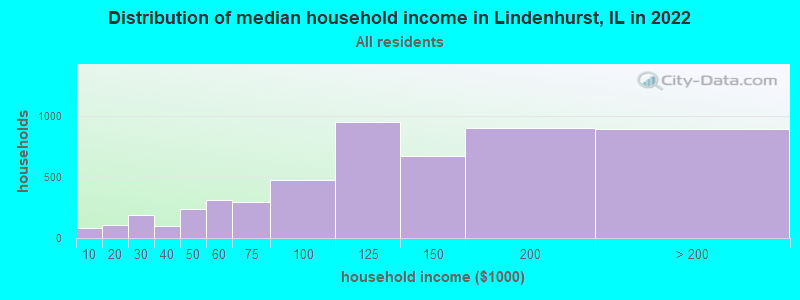
Income statistics for all residents
Median household income in Lindenhurst, IL in 2022:
Lindenhurst:
$120,980
State:
$76,708
Change in median household income between 2000 and 2022:
Lindenhurst, Illinois:
+61.6%
Illinois:
+64.6%
Number of households with income < $10k:
Lindenhurst:
1.5% (78)
Illinois:
5.9% (296,090)
Number of households with income $10k - 20k:
Lindenhurst:
2.1% (109)
Illinois:
6.6% (333,259)
Number of households with income $20k - 30k:
Lindenhurst:
3.7% (192)
State:
6.8% (342,921)
Number of households with income $30k - 40k:
Lindenhurst:
1.8% (95)
Illinois:
7.0% (355,254)
Number of households with income $40k - 50k:
Lindenhurst:
4.5% (236)
State:
6.7% (340,678)
Number of households with income $50k - 60k:
Lindenhurst:
6.0% (314)
Illinois:
6.7% (339,405)
Number of households with income $60k - 75k:
Lindenhurst:
5.7% (294)
State:
9.2% (465,709)
Number of households with income $75k - 100k:
Lindenhurst:
9.1% (473)
State:
12.9% (651,353)
Number of households with income $100k - 125k:
Lindenhurst:
18.3% (950)
State:
10.3% (522,359)
Number of households with income $125k - 150k:
Lindenhurst:
12.9% (669)
State:
7.3% (367,136)
Number of households with income $150k - 200k:
Lindenhurst:
17.3% (899)
State:
9.0% (455,249)
Number of households with income > $200k:
Lindenhurst:
17.2% (894)
Illinois:
11.6% (586,947)
Aggregate household income in Lindenhurst in 2022: $689,203,277
Median family income in Lindenhurst in 2022:
Lindenhurst:
$130,585
State:
$96,948
Number of families with income < $10k:
Lindenhurst:
0.3% (13)
State:
3.4% (105,875)
Number of families with income $10k - 20k:
Lindenhurst:
1.5% (60)
Illinois:
3.3% (105,017)
Number of families with income $20k - 30k:
Lindenhurst:
2.7% (112)
Illinois:
4.7% (146,403)
Number of families with income $30k - 40k:
Lindenhurst:
0.8% (35)
State:
5.3% (167,069)
Number of families with income $40k - 50k:
Lindenhurst:
3.1% (129)
Illinois:
5.8% (181,164)
Number of families with income $50k - 60k:
Lindenhurst:
5.5% (225)
State:
6.1% (191,561)
Number of families with income $60k - 75k:
Lindenhurst:
4.5% (186)
Illinois:
9.0% (282,985)
Number of families with income $75k - 100k:
Lindenhurst:
10.5% (430)
State:
13.8% (432,725)
Number of families with income $100k - 125k:
Lindenhurst:
17.9% (736)
State:
11.9% (373,296)
Number of families with income $125k - 150k:
Lindenhurst:
12.5% (511)
State:
8.9% (279,791)
Number of families with income $150k - 200k:
Lindenhurst:
22.1% (906)
Illinois:
11.9% (372,004)
Number of families with income > $200k:
Lindenhurst:
18.5% (760)
State:
15.9% (500,033)
Median non-family income in Lindenhurst in 2022:
Lindenhurst:
$83,713
Illinois:
$46,533
Change in median non-family income between 2000 and 2022:
Lindenhurst, Illinois:
+64.9%
Illinois:
+64.0%
Median per capita income in Lindenhurst in 2022:
Lindenhurst:
$47,967
State:
$43,317
Change in median per capita income between 2000 and 2022:
Lindenhurst, Illinois:
+74.2%
Illinois:
+87.5%
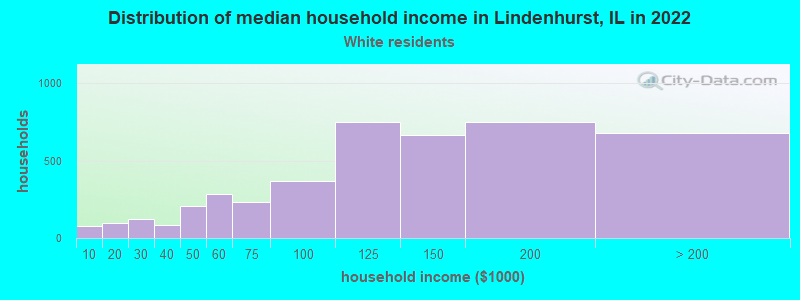
Income statistics for White residents
Median household income in Lindenhurst, IL in 2022:
Lindenhurst:
$124,292
Illinois:
$83,346
Change in median household income between 2000 and 2022:
Lindenhurst, Illinois:
+67.0%
Illinois:
+67.5%
Number of households with income < $10k:
Lindenhurst:
1.8% (77)
Illinois:
4.5% (149,895)
Number of households with income $10k - 20k:
Lindenhurst:
2.3% (98)
State:
5.5% (184,529)
Number of households with income $20k - 30k:
Lindenhurst:
2.8% (121)
State:
6.1% (205,767)
Number of households with income $30k - 40k:
Lindenhurst:
1.9% (82)
State:
6.7% (225,572)
Number of households with income $40k - 50k:
Lindenhurst:
4.8% (208)
Illinois:
6.5% (216,965)
Number of households with income $50k - 60k:
Lindenhurst:
6.5% (282)
Illinois:
6.6% (222,841)
Number of households with income $60k - 75k:
Lindenhurst:
5.3% (230)
Illinois:
9.3% (312,758)
Number of households with income $75k - 100k:
Lindenhurst:
8.6% (369)
State:
12.9% (433,180)
Number of households with income $100k - 125k:
Lindenhurst:
17.4% (749)
Illinois:
10.7% (360,753)
Number of households with income $125k - 150k:
Lindenhurst:
15.4% (663)
State:
7.9% (266,532)
Number of households with income $150k - 200k:
Lindenhurst:
17.4% (748)
Illinois:
10.0% (337,357)
Number of households with income > $200k:
Lindenhurst:
15.8% (679)
State:
13.3% (446,069)
Aggregate household income in Lindenhurst in 2022: $565,586,513
Median family income in Lindenhurst in 2022:
Lindenhurst:
$133,721
State:
$107,938
Number of families with income < $10k:
Lindenhurst:
0.4% (13)
State:
2.2% (45,983)
Number of families with income $10k - 20k:
Lindenhurst:
2.0% (68)
State:
2.5% (50,574)
Number of families with income $20k - 30k:
Lindenhurst:
1.4% (48)
State:
3.5% (70,927)
Number of families with income $30k - 40k:
Lindenhurst:
0.6% (18)
State:
4.4% (90,563)
Number of families with income $40k - 50k:
Lindenhurst:
3.5% (115)
Illinois:
5.0% (102,597)
Number of families with income $50k - 60k:
Lindenhurst:
5.6% (187)
Illinois:
5.8% (119,129)
Number of families with income $60k - 75k:
Lindenhurst:
4.4% (145)
Illinois:
8.8% (179,665)
Number of families with income $75k - 100k:
Lindenhurst:
9.4% (313)
Illinois:
13.5% (276,887)
Number of families with income $100k - 125k:
Lindenhurst:
16.5% (547)
State:
12.5% (256,099)
Number of families with income $125k - 150k:
Lindenhurst:
14.5% (480)
State:
9.8% (199,855)
Number of families with income $150k - 200k:
Lindenhurst:
23.3% (773)
State:
13.4% (274,569)
Number of families with income > $200k:
Lindenhurst:
18.5% (613)
Illinois:
18.6% (381,354)
Median non-family income in Lindenhurst in 2022:
Lindenhurst:
$74,055
Illinois:
$50,934
Change in median non-family income between 2000 and 2022:
Lindenhurst, Illinois:
+44.5%
Illinois:
+70.7%
Median per capita income in Lindenhurst in 2022:
Lindenhurst:
$52,271
State:
$50,738
Change in median per capita income between 2000 and 2022:
Lindenhurst, Illinois:
+86.7%
State:
+95.5%
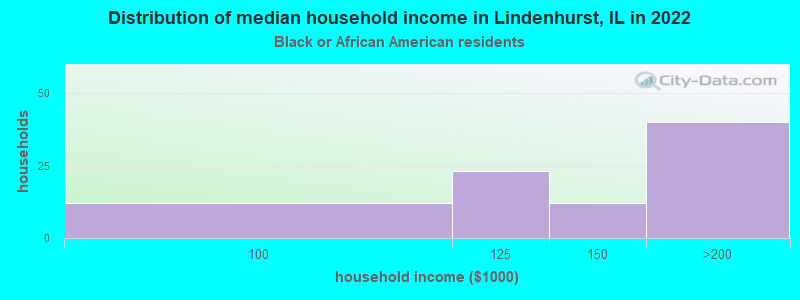
Income statistics for Black or African American residents
Median household income in Lindenhurst, IL in 2022:
Lindenhurst:
$132,010
Illinois:
$45,019
Change in median household income between 2000 and 2022:
Lindenhurst, Illinois:
+74.8%
State:
+42.0%
Number of households with income < $10k:
Lindenhurst:
0.0% (0)
Illinois:
13.3% (92,224)
Number of households with income $10k - 20k:
Lindenhurst:
0.0% (0)
State:
13.5% (93,732)
Number of households with income $20k - 30k:
Lindenhurst:
0.0% (0)
Illinois:
9.9% (68,453)
Number of households with income $30k - 40k:
Lindenhurst:
0.0% (0)
State:
8.5% (59,072)
Number of households with income $40k - 50k:
Lindenhurst:
0.0% (0)
State:
7.9% (55,033)
Number of households with income $50k - 60k:
Lindenhurst:
0.0% (0)
Illinois:
7.2% (49,556)
Number of households with income $60k - 75k:
Lindenhurst:
0.0% (0)
State:
7.8% (53,726)
Number of households with income $75k - 100k:
Lindenhurst:
13.8% (12)
Illinois:
11.6% (80,439)
Number of households with income $100k - 125k:
Lindenhurst:
26.4% (23)
Illinois:
7.5% (52,244)
Number of households with income $125k - 150k:
Lindenhurst:
13.8% (12)
State:
3.9% (27,058)
Number of households with income $150k - 200k:
Lindenhurst:
46.0% (40)
Illinois:
4.6% (32,057)
Number of households with income > $200k:
Lindenhurst:
0.0% (0)
Illinois:
4.1% (28,731)
Aggregate household income in Lindenhurst in 2022: $11,744,418
Median family income in Lindenhurst in 2022:
Lindenhurst:
$133,980
State:
$60,661
Number of families with income $75k - 100k:
Lindenhurst:
15.6% (15)
State:
14.0% (51,750)
Number of families with income $100k - 125k:
Lindenhurst:
27.3% (26)
State:
9.3% (34,471)
Number of families with income $125k - 150k:
Lindenhurst:
12.8% (12)
State:
5.7% (21,103)
Number of families with income $150k - 200k:
Lindenhurst:
44.3% (42)
State:
6.8% (25,177)
Median per capita income in Lindenhurst in 2022:
Lindenhurst:
$30,318
State:
$28,045
Change in median per capita income between 2000 and 2022:
Lindenhurst, Illinois:
+4.1%
State:
+90.2%
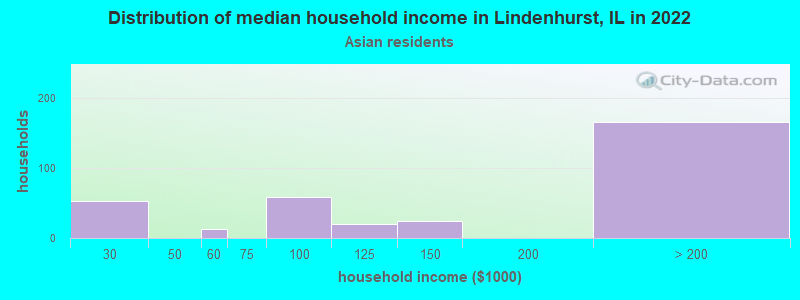
Income statistics for Asian residents
Median household income in Lindenhurst, IL in 2022:
Lindenhurst:
$206,041
State:
$104,287
Change in median household income between 2000 and 2022:
Lindenhurst, Illinois:
+133.4%
State:
+81.9%
Number of households with income < $10k:
Lindenhurst:
0.0% (0)
State:
5.3% (14,653)
Number of households with income $10k - 20k:
Lindenhurst:
0.0% (0)
State:
4.5% (12,283)
Number of households with income $20k - 30k:
Lindenhurst:
15.8% (53)
Illinois:
4.8% (13,135)
Number of households with income $30k - 40k:
Lindenhurst:
0.0% (0)
State:
5.0% (13,655)
Number of households with income $40k - 50k:
Lindenhurst:
0.0% (0)
State:
4.5% (12,357)
Number of households with income $50k - 60k:
Lindenhurst:
3.9% (13)
Illinois:
4.9% (13,568)
Number of households with income $60k - 75k:
Lindenhurst:
0.0% (0)
State:
7.1% (19,606)
Number of households with income $75k - 100k:
Lindenhurst:
17.6% (59)
State:
12.1% (33,349)
Number of households with income $100k - 125k:
Lindenhurst:
6.0% (20)
State:
9.7% (26,669)
Number of households with income $125k - 150k:
Lindenhurst:
7.2% (24)
Illinois:
7.3% (20,172)
Number of households with income $150k - 200k:
Lindenhurst:
0.0% (0)
State:
11.5% (31,711)
Number of households with income > $200k:
Lindenhurst:
49.6% (166)
State:
23.1% (63,411)
Aggregate household income in Lindenhurst in 2022: $58,108,682
Median family income in Lindenhurst in 2022:
Lindenhurst:
$137,942
State:
$124,630
Number of families with income $20k - 30k:
Lindenhurst:
15.4% (39)
Illinois:
4.4% (8,618)
Number of families with income $50k - 60k:
Lindenhurst:
5.3% (13)
Illinois:
4.1% (7,974)
Number of families with income $75k - 100k:
Lindenhurst:
23.8% (60)
State:
12.3% (24,156)
Number of families with income $100k - 125k:
Lindenhurst:
7.3% (18)
Illinois:
9.6% (18,808)
Number of families with income $125k - 150k:
Lindenhurst:
9.9% (25)
State:
8.0% (15,639)
Number of families with income > $200k:
Lindenhurst:
38.3% (96)
State:
28.0% (54,999)
Median per capita income in Lindenhurst in 2022:
Lindenhurst:
$58,944
Illinois:
$52,977
Change in median per capita income between 2000 and 2022:
Lindenhurst, Illinois:
+132.2%
Illinois:
+119.5%
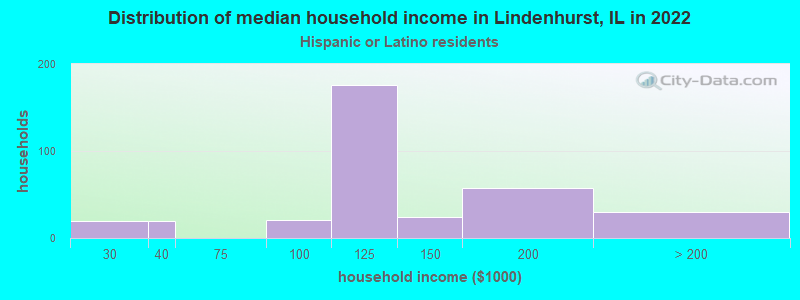
Income statistics for Hispanic or Latino residents
Median household income in Lindenhurst, IL in 2022:
Lindenhurst:
$119,087
Illinois:
$72,139
Change in median household income between 2000 and 2022:
Lindenhurst, Illinois:
+73.2%
State:
+75.7%
Number of households with income < $10k:
Lindenhurst:
0.0% (0)
State:
4.9% (33,145)
Number of households with income $10k - 20k:
Lindenhurst:
0.0% (0)
State:
5.4% (36,345)
Number of households with income $20k - 30k:
Lindenhurst:
5.5% (19)
State:
7.5% (50,677)
Number of households with income $30k - 40k:
Lindenhurst:
5.8% (20)
Illinois:
7.7% (52,008)
Number of households with income $40k - 50k:
Lindenhurst:
0.0% (0)
State:
8.1% (54,702)
Number of households with income $50k - 60k:
Lindenhurst:
0.0% (0)
State:
7.5% (51,062)
Number of households with income $60k - 75k:
Lindenhurst:
0.0% (0)
Illinois:
11.3% (76,576)
Number of households with income $75k - 100k:
Lindenhurst:
6.1% (21)
Illinois:
15.5% (105,152)
Number of households with income $100k - 125k:
Lindenhurst:
50.7% (176)
State:
11.5% (77,760)
Number of households with income $125k - 150k:
Lindenhurst:
6.9% (24)
State:
7.3% (49,310)
Number of households with income $150k - 200k:
Lindenhurst:
16.4% (57)
Illinois:
7.6% (51,233)
Number of households with income > $200k:
Lindenhurst:
8.6% (30)
State:
5.9% (40,028)
Aggregate household income in Lindenhurst in 2022: $39,434,595
Median family income in Lindenhurst in 2022:
Lindenhurst:
$121,957
State:
$76,467
Number of families with income $20k - 30k:
Lindenhurst:
4.5% (15)
State:
6.8% (34,467)
Number of families with income $30k - 40k:
Lindenhurst:
2.8% (10)
State:
7.5% (37,976)
Number of families with income $75k - 100k:
Lindenhurst:
10.2% (34)
State:
16.0% (81,055)
Number of families with income $100k - 125k:
Lindenhurst:
50.2% (169)
Illinois:
12.1% (61,491)
Number of families with income $125k - 150k:
Lindenhurst:
7.4% (25)
State:
8.0% (40,271)
Number of families with income $150k - 200k:
Lindenhurst:
15.5% (52)
Illinois:
8.6% (43,536)
Number of families with income > $200k:
Lindenhurst:
9.4% (31)
State:
6.6% (33,240)
Median per capita income in Lindenhurst in 2022:
Lindenhurst:
$32,442
Illinois:
$26,551
Change in median per capita income between 2000 and 2022:
Lindenhurst, Illinois:
+75.9%
State:
+111.0%
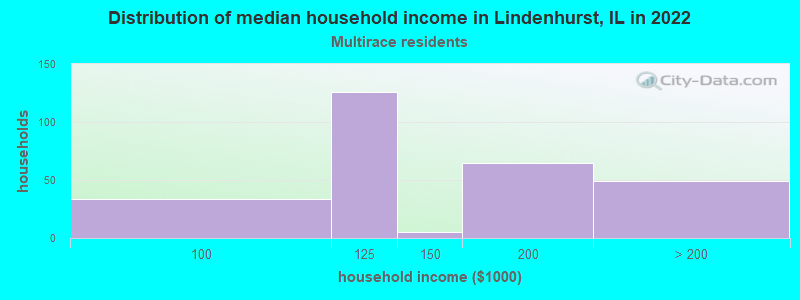
Income statistics for Multirace residents
Median household income in Lindenhurst, IL in 2022:
Lindenhurst:
$116,257
State:
$71,185
Change in median household income between 2000 and 2022:
Lindenhurst, Illinois:
+6.2%
State:
+81.4%
Number of households with income < $10k:
Lindenhurst:
0.0% (0)
State:
5.3% (21,595)
Number of households with income $10k - 20k:
Lindenhurst:
0.0% (0)
State:
6.5% (26,720)
Number of households with income $20k - 30k:
Lindenhurst:
0.0% (0)
Illinois:
8.0% (32,573)
Number of households with income $30k - 40k:
Lindenhurst:
0.0% (0)
State:
8.4% (34,383)
Number of households with income $40k - 50k:
Lindenhurst:
0.0% (0)
State:
7.4% (30,234)
Number of households with income $50k - 60k:
Lindenhurst:
0.0% (0)
Illinois:
6.9% (28,432)
Number of households with income $60k - 75k:
Lindenhurst:
0.0% (0)
State:
10.2% (41,780)
Number of households with income $75k - 100k:
Lindenhurst:
12.2% (34)
Illinois:
13.0% (53,426)
Number of households with income $100k - 125k:
Lindenhurst:
45.2% (126)
State:
10.5% (43,126)
Number of households with income $125k - 150k:
Lindenhurst:
1.8% (5)
State:
7.6% (31,153)
Number of households with income $150k - 200k:
Lindenhurst:
23.3% (65)
State:
7.6% (30,946)
Number of households with income > $200k:
Lindenhurst:
17.6% (49)
State:
8.6% (35,208)
Aggregate household income in Lindenhurst in 2022: $36,253,716
Median family income in Lindenhurst in 2022:
Lindenhurst:
$122,360
Illinois:
$84,400
Number of families with income $75k - 100k:
Lindenhurst:
12.7% (38)
State:
13.6% (37,857)
Number of families with income $100k - 125k:
Lindenhurst:
48.2% (143)
State:
12.2% (33,852)
Number of families with income $125k - 150k:
Lindenhurst:
1.9% (6)
State:
9.0% (25,085)
Number of families with income $150k - 200k:
Lindenhurst:
20.1% (60)
State:
9.5% (26,306)
Number of families with income > $200k:
Lindenhurst:
17.1% (51)
Illinois:
10.4% (28,926)
Median per capita income in Lindenhurst in 2022:
Lindenhurst:
$34,224
Illinois:
$29,285
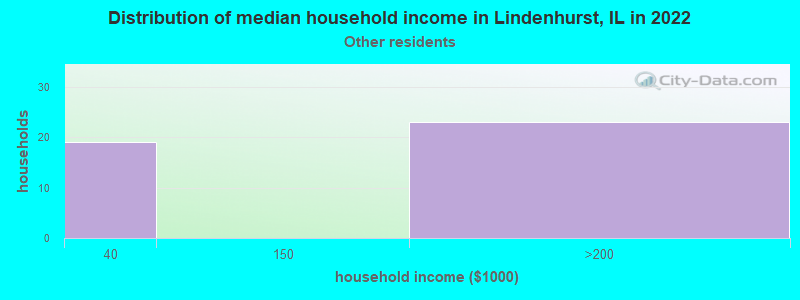
Income statistics for other residents
Median household income in Lindenhurst, IL in 2022:
Lindenhurst:
$151,614
Illinois:
$71,711
Number of households with income < $10k:
Lindenhurst:
0.0% (0)
Illinois:
5.7% (16,383)
Number of households with income $10k - 20k:
Lindenhurst:
0.0% (0)
Illinois:
4.8% (13,886)
Number of households with income $20k - 30k:
Lindenhurst:
0.0% (0)
Illinois:
7.0% (20,054)
Number of households with income $30k - 40k:
Lindenhurst:
45.2% (19)
State:
7.0% (20,038)
Number of households with income $40k - 50k:
Lindenhurst:
0.0% (0)
State:
8.3% (23,759)
Number of households with income $50k - 60k:
Lindenhurst:
0.0% (0)
State:
7.8% (22,410)
Number of households with income $60k - 75k:
Lindenhurst:
0.0% (0)
State:
12.0% (34,448)
Number of households with income $75k - 100k:
Lindenhurst:
0.0% (0)
State:
16.2% (46,508)
Number of households with income $100k - 125k:
Lindenhurst:
0.0% (0)
Illinois:
12.5% (35,952)
Number of households with income $125k - 150k:
Lindenhurst:
0.0% (0)
State:
6.9% (19,732)
Number of households with income $150k - 200k:
Lindenhurst:
54.8% (23)
State:
7.5% (21,422)
Number of households with income > $200k:
Lindenhurst:
0.0% (0)
State:
4.3% (12,194)
Aggregate household income in Lindenhurst in 2022: $6,952,031
Median family income in Lindenhurst in 2022:
Lindenhurst:
$149,051
State:
$74,069
Number of families with income $30k - 40k:
Lindenhurst:
50.9% (19)
State:
7.6% (17,087)
Number of families with income $150k - 200k:
Lindenhurst:
49.1% (19)
State:
7.7% (17,122)
Median per capita income in Lindenhurst in 2022:
Lindenhurst:
$26,474
State:
$25,392
Change in median per capita income between 2000 and 2022:
Lindenhurst, Illinois:
+23.7%
State:
+117.4%
Discuss Lindenhurst, Illinois (IL) on our hugely popular Illinois forum.