The median household income in Liberty Lake, WA in 2022 was $100,018, which was 8.7% greater than the median annual income of $91,306 across the entire state of Washington. Compared to the median income of $60,854 in 2000 this represents an increase of 39.2%. The per capita income in 2022 was $51,083, which means an increase of 43.0% compared to 2000 when it was $29,105.
Whole page based on the data from 2000 / 2022 when the population of Liberty Lake, Washington was 4,660 / 12,271
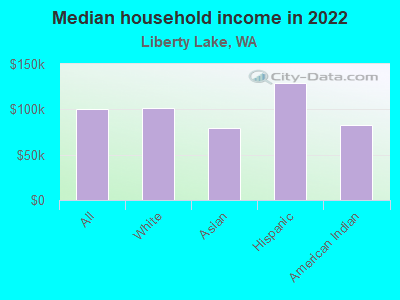
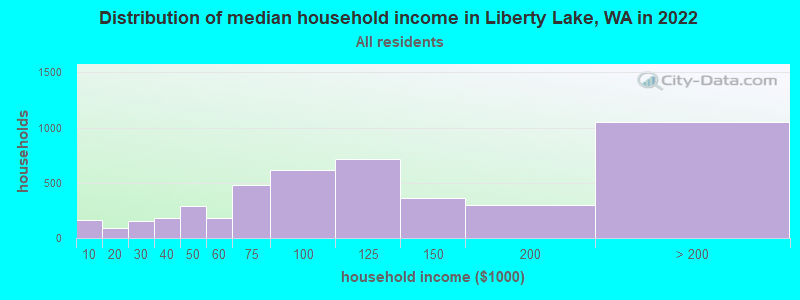
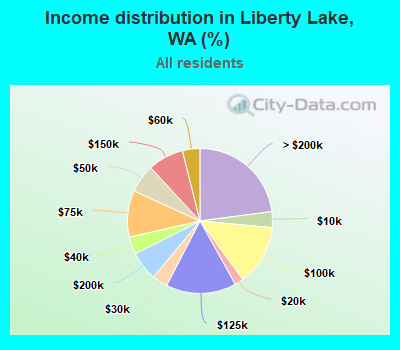
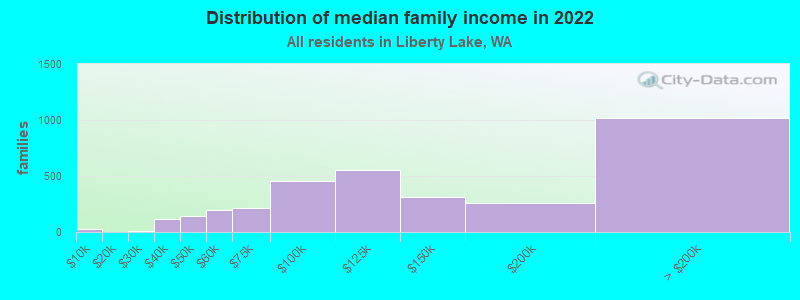
Income statistics for all residents
Median household income in Liberty Lake, WA in 2022:
Liberty Lake:
$100,019
State:
$91,306
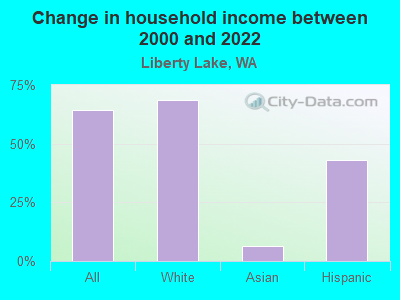
Change in median household income between 2000 and 2022:
Liberty Lake, Washington:
+64.4%
State:
+99.5%
Number of households with income < $10k:
Liberty Lake:
3.5% (162)
Washington:
4.5% (139,331)
Number of households with income $10k - 20k:
Liberty Lake:
2.0% (90)
Washington:
5.0% (154,508)
Number of households with income $20k - 30k:
Liberty Lake:
3.4% (158)
State:
5.4% (166,555)
Number of households with income $30k - 40k:
Liberty Lake:
3.9% (179)
Washington:
5.5% (170,324)
Number of households with income $40k - 50k:
Liberty Lake:
6.3% (289)
Washington:
6.0% (183,941)
Number of households with income $50k - 60k:
Liberty Lake:
3.9% (178)
Washington:
6.1% (187,395)
Number of households with income $60k - 75k:
Liberty Lake:
10.4% (476)
State:
8.7% (266,771)
Number of households with income $75k - 100k:
Liberty Lake:
13.5% (618)
Washington:
13.1% (404,672)
Number of households with income $100k - 125k:
Liberty Lake:
15.7% (719)
Washington:
11.0% (337,911)
Number of households with income $125k - 150k:
Liberty Lake:
8.0% (366)
State:
8.0% (244,934)
Number of households with income $150k - 200k:
Liberty Lake:
6.5% (297)
State:
10.5% (323,812)
Number of households with income > $200k:
Liberty Lake:
22.9% (1,051)
State:
16.2% (499,799)
Aggregate household income in Liberty Lake in 2022: $651,895,718
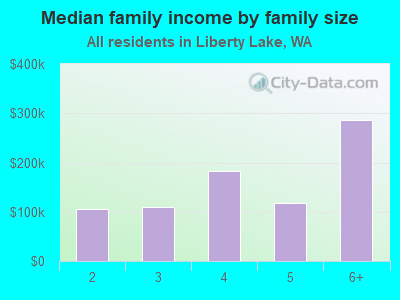
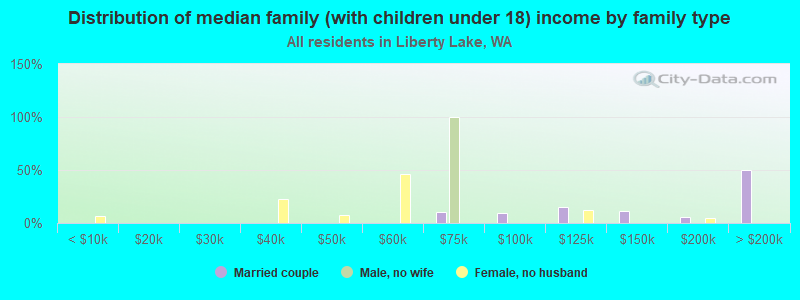
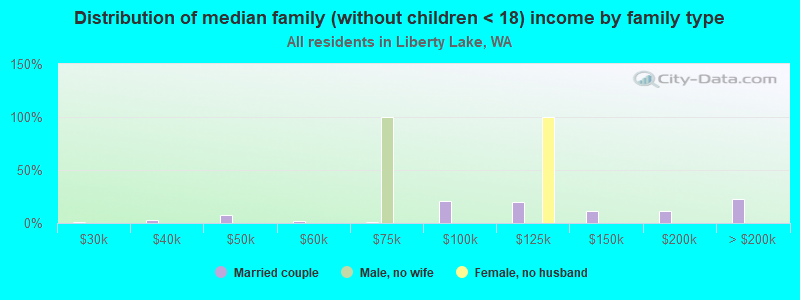
Median family income in Liberty Lake in 2022:
Liberty Lake:
$128,899
State:
$109,192
Number of families with income < $10k:
Liberty Lake:
0.8% (27)
State:
2.9% (55,953)
Number of families with income $20k - 30k:
Liberty Lake:
0.3% (11)
State:
3.2% (61,974)
Number of families with income $30k - 40k:
Liberty Lake:
3.5% (114)
State:
4.1% (80,240)
Number of families with income $40k - 50k:
Liberty Lake:
4.3% (143)
State:
4.9% (94,310)
Number of families with income $50k - 60k:
Liberty Lake:
5.9% (193)
Washington:
5.3% (101,674)
Number of families with income $60k - 75k:
Liberty Lake:
6.5% (215)
State:
8.2% (158,348)
Number of families with income $75k - 100k:
Liberty Lake:
13.7% (451)
Washington:
13.8% (267,812)
Number of families with income $100k - 125k:
Liberty Lake:
16.7% (551)
State:
12.4% (240,213)
Number of families with income $125k - 150k:
Liberty Lake:
9.6% (316)
State:
9.3% (180,011)
Number of families with income $150k - 200k:
Liberty Lake:
7.8% (258)
State:
13.0% (250,874)
Number of families with income > $200k:
Liberty Lake:
30.9% (1,019)
State:
20.4% (393,898)
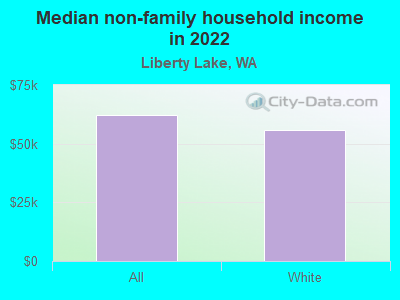
Median non-family income in Liberty Lake in 2022:
Liberty Lake:
$62,131
Washington:
$57,299
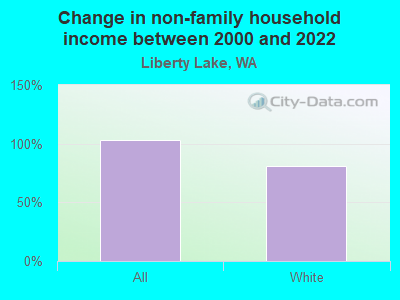
Change in median non-family income between 2000 and 2022:
Liberty Lake, Washington:
+103.0%
Washington:
+94.9%
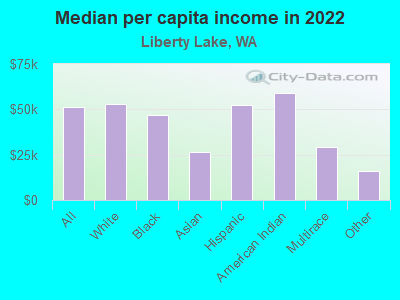
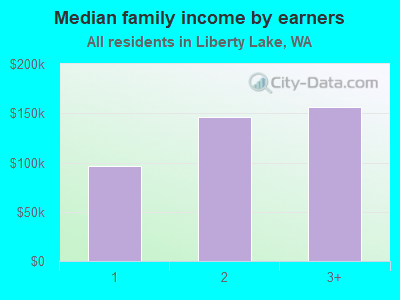
Median per capita income in Liberty Lake in 2022:
Liberty Lake:
$51,083
State:
$50,764
Change in median per capita income between 2000 and 2022:
Liberty Lake, Washington:
+75.5%
State:
+121.0%
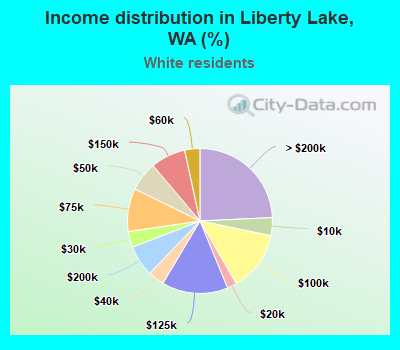
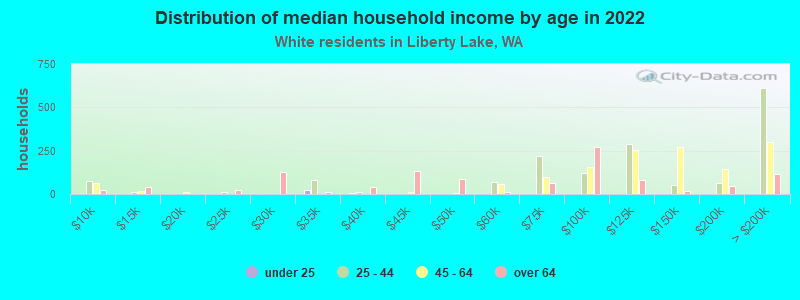
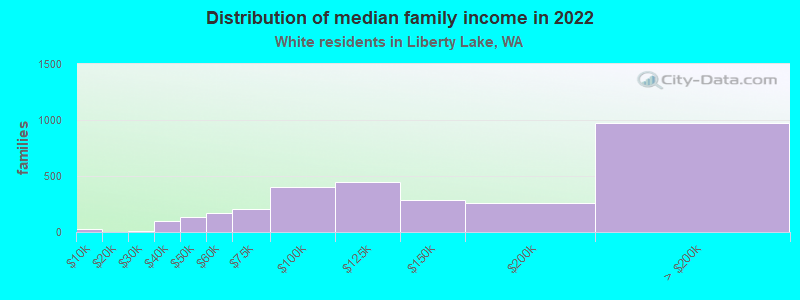
Income statistics for White residents
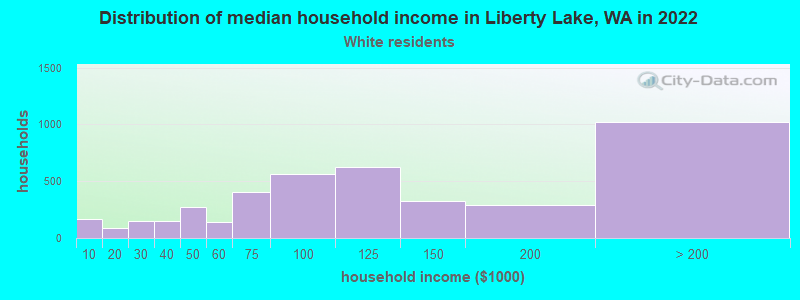
Median household income in Liberty Lake, WA in 2022:
Liberty Lake:
$101,760
State:
$91,916
Change in median household income between 2000 and 2022:
Liberty Lake, Washington:
+68.7%
State:
+95.4%
Number of households with income < $10k:
Liberty Lake:
4.0% (169)
State:
4.3% (95,850)
Number of households with income $10k - 20k:
Liberty Lake:
2.1% (90)
Washington:
4.8% (106,421)
Number of households with income $20k - 30k:
Liberty Lake:
3.6% (150)
State:
5.5% (122,860)
Number of households with income $30k - 40k:
Liberty Lake:
3.7% (154)
Washington:
5.4% (119,627)
Number of households with income $40k - 50k:
Liberty Lake:
6.5% (275)
State:
5.9% (132,276)
Number of households with income $50k - 60k:
Liberty Lake:
3.4% (143)
Washington:
6.1% (136,212)
Number of households with income $60k - 75k:
Liberty Lake:
9.6% (405)
Washington:
8.8% (196,086)
Number of households with income $75k - 100k:
Liberty Lake:
13.4% (564)
Washington:
13.4% (299,192)
Number of households with income $100k - 125k:
Liberty Lake:
14.8% (622)
Washington:
11.3% (252,209)
Number of households with income $125k - 150k:
Liberty Lake:
7.8% (328)
State:
7.9% (175,962)
Number of households with income $150k - 200k:
Liberty Lake:
6.9% (291)
State:
10.7% (239,156)
Number of households with income > $200k:
Liberty Lake:
24.3% (1,022)
Washington:
16.1% (359,917)
Aggregate household income in Liberty Lake in 2022: $608,803,471
Median family income in Liberty Lake in 2022:
Liberty Lake:
$131,409
Washington:
$112,511
Number of families with income < $10k:
Liberty Lake:
0.9% (27)
State:
2.4% (33,676)
Number of families with income $20k - 30k:
Liberty Lake:
0.4% (11)
Washington:
2.9% (39,288)
Number of families with income $30k - 40k:
Liberty Lake:
3.2% (95)
State:
3.6% (50,190)
Number of families with income $40k - 50k:
Liberty Lake:
4.5% (136)
State:
4.6% (63,009)
Number of families with income $50k - 60k:
Liberty Lake:
5.6% (168)
State:
5.0% (69,270)
Number of families with income $60k - 75k:
Liberty Lake:
6.8% (204)
State:
8.2% (112,369)
Number of families with income $75k - 100k:
Liberty Lake:
13.3% (402)
State:
14.1% (194,214)
Number of families with income $100k - 125k:
Liberty Lake:
14.9% (448)
State:
13.2% (182,184)
Number of families with income $125k - 150k:
Liberty Lake:
9.5% (286)
State:
9.5% (130,928)
Number of families with income $150k - 200k:
Liberty Lake:
8.5% (256)
State:
13.7% (188,621)
Number of families with income > $200k:
Liberty Lake:
32.4% (975)
State:
20.8% (285,982)
Median non-family income in Liberty Lake in 2022:
Liberty Lake:
$55,693
State:
$56,103
Change in median non-family income between 2000 and 2022:
Liberty Lake, Washington:
+81.5%
State:
+87.7%
Median per capita income in Liberty Lake in 2022:
Liberty Lake:
$53,068
State:
$55,212
Change in median per capita income between 2000 and 2022:
Liberty Lake, Washington:
+78.4%
Washington:
+123.8%
Income statistics for Black or African American residents
Median per capita income in Liberty Lake in 2022:
Liberty Lake:
$46,966
State:
$38,209
Change in median per capita income between 2000 and 2022:
Liberty Lake, Washington:
+132.9%
Washington:
+115.3%
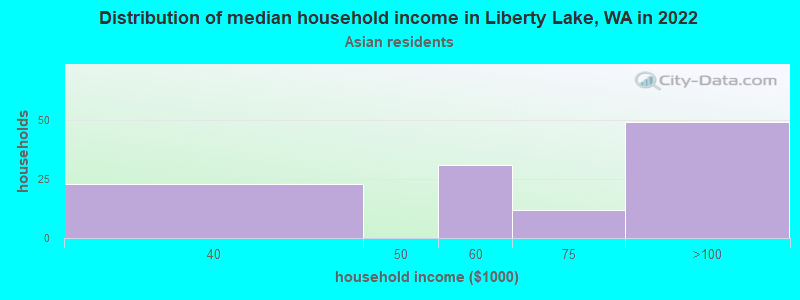
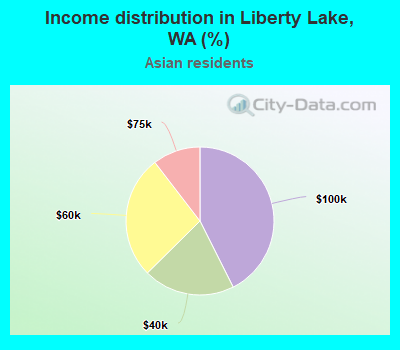
Income statistics for Asian residents
Median household income in Liberty Lake, WA in 2022:
Liberty Lake:
$78,999
State:
$125,692
Change in median household income between 2000 and 2022:
Liberty Lake, Washington:
+6.2%
State:
+164.5%
Number of households with income < $10k:
Liberty Lake:
0.0% (0)
State:
4.9% (14,099)
Number of households with income $10k - 20k:
Liberty Lake:
0.0% (0)
Washington:
3.5% (9,873)
Number of households with income $20k - 30k:
Liberty Lake:
0.0% (0)
Washington:
2.9% (8,352)
Number of households with income $30k - 40k:
Liberty Lake:
20.0% (23)
State:
4.0% (11,415)
Number of households with income $40k - 50k:
Liberty Lake:
0.0% (0)
State:
4.0% (11,421)
Number of households with income $50k - 60k:
Liberty Lake:
27.0% (31)
Washington:
4.2% (12,100)
Number of households with income $60k - 75k:
Liberty Lake:
10.4% (12)
State:
6.3% (17,903)
Number of households with income $75k - 100k:
Liberty Lake:
42.6% (49)
State:
10.4% (29,663)
Number of households with income $100k - 125k:
Liberty Lake:
0.0% (0)
State:
9.4% (26,839)
Number of households with income $125k - 150k:
Liberty Lake:
0.0% (0)
Washington:
8.5% (24,200)
Number of households with income $150k - 200k:
Liberty Lake:
0.0% (0)
Washington:
12.6% (35,976)
Number of households with income > $200k:
Liberty Lake:
0.0% (0)
State:
29.2% (83,109)
Aggregate household income in Liberty Lake in 2022: $6,222,862
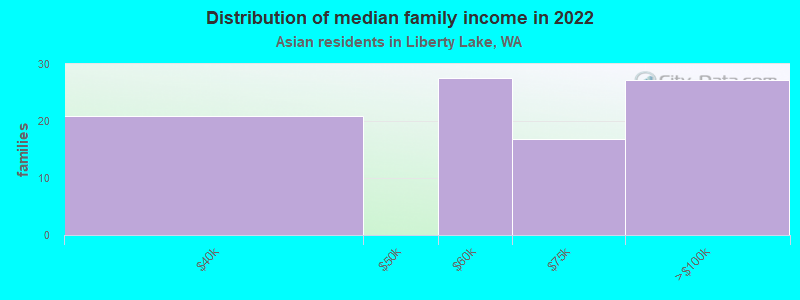
Median family income in Liberty Lake in 2022:
Liberty Lake:
$66,390
State:
$143,595
Number of families with income $30k - 40k:
Liberty Lake:
22.6% (21)
State:
3.1% (5,734)
Number of families with income $50k - 60k:
Liberty Lake:
29.8% (28)
State:
4.1% (7,663)
Number of families with income $60k - 75k:
Liberty Lake:
18.2% (17)
State:
5.1% (9,490)
Number of families with income $75k - 100k:
Liberty Lake:
29.5% (27)
State:
11.7% (21,919)
Median per capita income in Liberty Lake in 2022:
Liberty Lake:
$26,648
Washington:
$67,666
Change in median per capita income between 2000 and 2022:
Liberty Lake, Washington:
+1.4%
State:
+236.0%
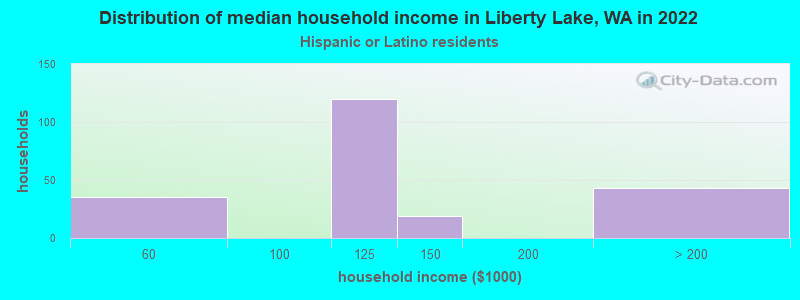
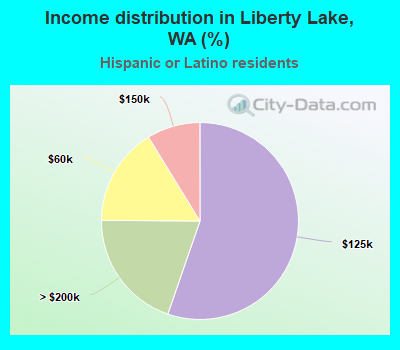
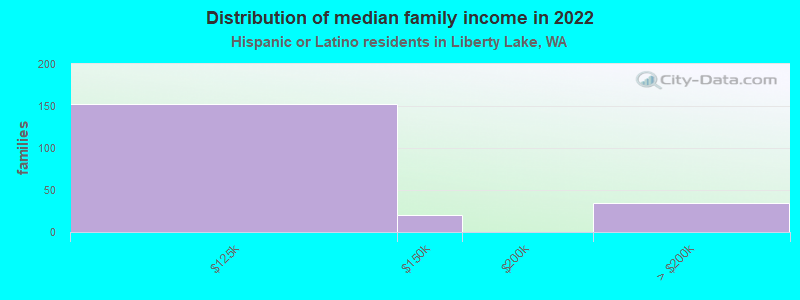
Income statistics for Hispanic or Latino residents
Median household income in Liberty Lake, WA in 2022:
Liberty Lake:
$129,398
State:
$74,770
Change in median household income between 2000 and 2022:
Liberty Lake, Washington:
+43.1%
State:
+128.3%
Number of households with income < $10k:
Liberty Lake:
0.0% (0)
State:
4.9% (14,456)
Number of households with income $10k - 20k:
Liberty Lake:
0.0% (0)
Washington:
5.3% (15,449)
Number of households with income $20k - 30k:
Liberty Lake:
0.0% (0)
Washington:
6.8% (20,016)
Number of households with income $30k - 40k:
Liberty Lake:
0.0% (0)
Washington:
7.7% (22,548)
Number of households with income $40k - 50k:
Liberty Lake:
0.0% (0)
State:
7.3% (21,450)
Number of households with income $50k - 60k:
Liberty Lake:
16.1% (35)
Washington:
7.7% (22,744)
Number of households with income $60k - 75k:
Liberty Lake:
0.0% (0)
Washington:
10.5% (30,737)
Number of households with income $75k - 100k:
Liberty Lake:
0.0% (0)
State:
14.9% (43,843)
Number of households with income $100k - 125k:
Liberty Lake:
55.3% (120)
State:
11.1% (32,554)
Number of households with income $125k - 150k:
Liberty Lake:
8.8% (19)
State:
7.4% (21,624)
Number of households with income $150k - 200k:
Liberty Lake:
0.0% (0)
State:
7.3% (21,360)
Number of households with income > $200k:
Liberty Lake:
19.8% (43)
Washington:
9.2% (27,055)
Aggregate household income in Liberty Lake in 2022: $26,627,260
Median family income in Liberty Lake in 2022:
Liberty Lake:
$126,661
State:
$76,866
Number of families with income $100k - 125k:
Liberty Lake:
73.6% (152)
Washington:
11.4% (24,331)
Number of families with income $125k - 150k:
Liberty Lake:
9.6% (20)
State:
7.5% (16,099)
Number of families with income > $200k:
Liberty Lake:
16.8% (35)
Washington:
9.7% (20,653)
Median per capita income in Liberty Lake in 2022:
Liberty Lake:
$52,182
Washington:
$28,252
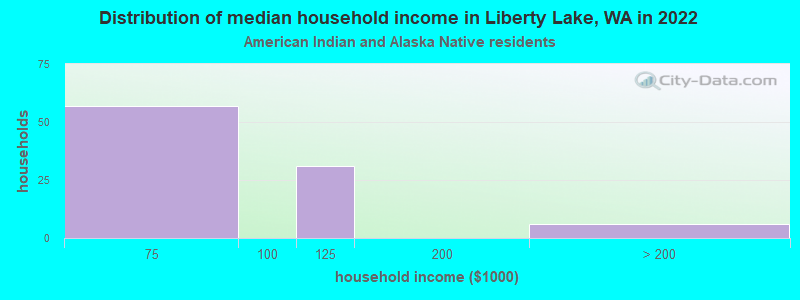
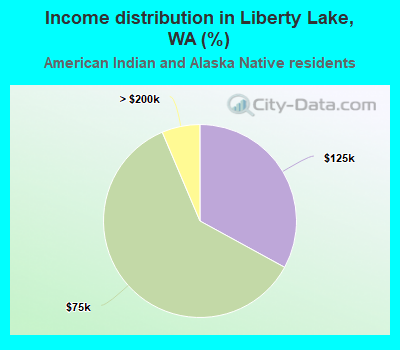
Income statistics for American Indian and Alaska Native residents
Median household income in Liberty Lake, WA in 2022:
Liberty Lake:
$83,208
Washington:
$71,255
Number of households with income < $10k:
Liberty Lake:
0.0% (0)
State:
5.9% (1,768)
Number of households with income $10k - 20k:
Liberty Lake:
0.0% (0)
State:
8.9% (2,694)
Number of households with income $20k - 30k:
Liberty Lake:
0.0% (0)
State:
8.0% (2,412)
Number of households with income $30k - 40k:
Liberty Lake:
0.0% (0)
State:
7.7% (2,327)
Number of households with income $40k - 50k:
Liberty Lake:
0.0% (0)
State:
5.8% (1,755)
Number of households with income $50k - 60k:
Liberty Lake:
0.0% (0)
State:
7.5% (2,259)
Number of households with income $60k - 75k:
Liberty Lake:
60.6% (57)
State:
8.8% (2,669)
Number of households with income $75k - 100k:
Liberty Lake:
0.0% (0)
State:
12.8% (3,861)
Number of households with income $100k - 125k:
Liberty Lake:
33.0% (31)
State:
12.0% (3,618)
Number of households with income $125k - 150k:
Liberty Lake:
0.0% (0)
Washington:
8.6% (2,580)
Number of households with income $150k - 200k:
Liberty Lake:
0.0% (0)
Washington:
5.9% (1,774)
Number of households with income > $200k:
Liberty Lake:
6.4% (6)
State:
8.1% (2,447)
Aggregate household income in Liberty Lake in 2022: $9,083,901
Median per capita income in Liberty Lake in 2022:
Liberty Lake:
$59,114
Washington:
$27,053
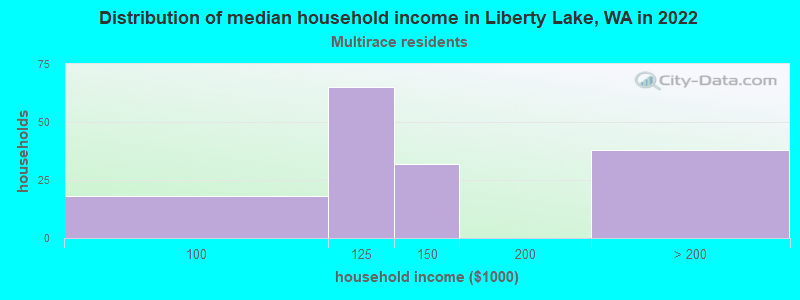
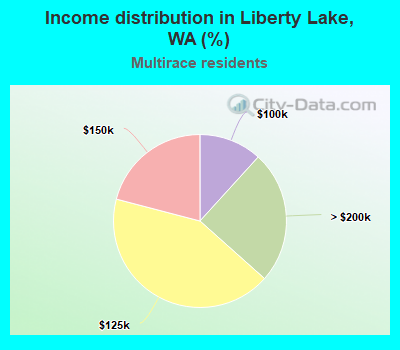
Income statistics for Multirace residents
Number of households with income < $10k:
Liberty Lake:
0.0% (0)
State:
4.3% (12,040)
Number of households with income $10k - 20k:
Liberty Lake:
0.0% (0)
Washington:
6.6% (18,437)
Number of households with income $20k - 30k:
Liberty Lake:
0.0% (0)
Washington:
5.2% (14,559)
Number of households with income $30k - 40k:
Liberty Lake:
0.0% (0)
State:
6.7% (18,491)
Number of households with income $40k - 50k:
Liberty Lake:
0.0% (0)
State:
6.3% (17,459)
Number of households with income $50k - 60k:
Liberty Lake:
0.0% (0)
State:
6.9% (19,086)
Number of households with income $60k - 75k:
Liberty Lake:
0.0% (0)
Washington:
9.1% (25,310)
Number of households with income $75k - 100k:
Liberty Lake:
11.8% (18)
Washington:
13.5% (37,493)
Number of households with income $100k - 125k:
Liberty Lake:
42.5% (65)
State:
10.7% (29,626)
Number of households with income $125k - 150k:
Liberty Lake:
20.9% (32)
State:
8.6% (23,899)
Number of households with income $150k - 200k:
Liberty Lake:
0.0% (0)
Washington:
10.2% (28,214)
Number of households with income > $200k:
Liberty Lake:
24.8% (38)
State:
11.9% (32,947)
Aggregate household income in Liberty Lake in 2022: $27,129,468
Median per capita income in Liberty Lake in 2022:
Liberty Lake:
$29,171
Washington:
$32,496
Change in median per capita income between 2000 and 2022:
Liberty Lake, Washington:
+119.9%
Washington:
+156.8%
Income statistics for other residents
Median per capita income in Liberty Lake in 2022:
Liberty Lake:
$16,240
State:
$27,542
Change in median per capita income between 2000 and 2022:: -63.9%
Liberty Lake, Washington:
-63.9%
State:
+167.8%
Discuss Liberty Lake, Washington (WA) on our hugely popular Washington forum.