Guilford, Connecticut (CT) income map, earnings map, and wages data
The median household income in Guilford, CT in 2022 was $130,029, which was 32.0% greater than the median annual income of $88,429 across the entire state of Connecticut. Compared to the median income of $76,843 in 2000 this represents an increase of 40.9%. The per capita income in 2022 was $67,978, which means an increase of 45.3% compared to 2000 when it was $37,161.
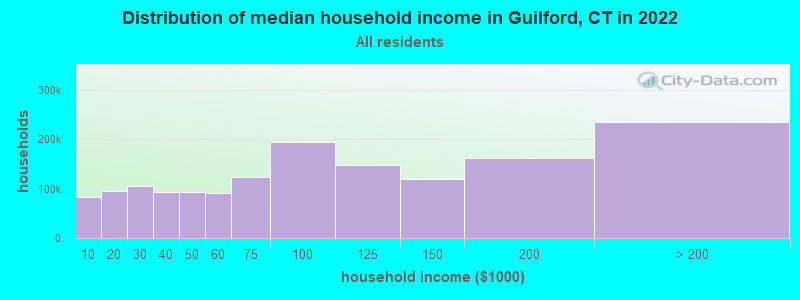
Income statistics for all residents
Median household income in Guilford, CT in 2022:| Guilford: | $130,029 |
| State: | $88,429 |
Change in median household income between 2000 and 2022:| Guilford, Connecticut: | +69.2% |
| State: | +64.0% |
Number of households with income < $10k:| Guilford: | 5.2% (52,963) |
| State: | 5.1% (72,746) |
Number of households with income $10k - 20k:| Guilford: | 5.8% (59,724) |
| State: | 5.7% (81,643) |
Number of households with income $20k - 30k:| Guilford: | 6.6% (67,602) |
| Connecticut: | 6.5% (92,844) |
Number of households with income $30k - 40k:| Guilford: | 5.9% (60,669) |
| Connecticut: | 5.9% (83,934) |
Number of households with income $40k - 50k:| Guilford: | 5.9% (60,279) |
| Connecticut: | 5.8% (83,025) |
Number of households with income $50k - 60k:| Guilford: | 5.8% (59,108) |
| Connecticut: | 5.7% (81,788) |
Number of households with income $60k - 75k:| Guilford: | 8.1% (82,817) |
| Connecticut: | 8.1% (115,651) |
Number of households with income $75k - 100k:| Guilford: | 12.6% (129,342) |
| State: | 12.6% (180,173) |
Number of households with income $100k - 125k:| Guilford: | 9.8% (100,691) |
| State: | 9.9% (141,231) |
Number of households with income $125k - 150k:| Guilford: | 7.8% (80,412) |
| Connecticut: | 7.9% (112,826) |
Number of households with income $150k - 200k:| Guilford: | 10.7% (109,997) |
| State: | 10.8% (154,641) |
Number of households with income > $200k:| Guilford: | 16.0% (164,328) |
| State: | 16.3% (233,133) |
Aggregate household income in Guilford in 2022: $34,075,292,849
Median family income in Guilford in 2022:| Guilford: | $155,462 |
| Connecticut: | $115,183 |
Median non-family income in Guilford in 2022:| Guilford: | $80,633 |
| State: | $50,964 |
Change in median non-family income between 2000 and 2022:| Guilford, Connecticut: | +71.5% |
| Connecticut: | +65.1% |
Median per capita income in Guilford in 2022:| Guilford: | $67,978 |
| State: | $51,581 |
Change in median per capita income between 2000 and 2022:| Guilford, Connecticut: | +82.9% |
| State: | +79.3% |
Income statistics for White residents
Median household income in Guilford, CT in 2022:| Guilford: | $129,709 |
| State: | $96,890 |
Change in median household income between 2000 and 2022:| Guilford, Connecticut: | +69.4% |
| State: | +68.5% |
Number of households with income < $10k:| Guilford: | 4.2% (28,370) |
| State: | 4.2% (42,265) |
Number of households with income $10k - 20k:| Guilford: | 4.9% (32,617) |
| Connecticut: | 4.8% (48,323) |
Number of households with income $20k - 30k:| Guilford: | 5.8% (38,790) |
| State: | 5.7% (57,716) |
Number of households with income $30k - 40k:| Guilford: | 5.4% (35,907) |
| State: | 5.3% (53,827) |
Number of households with income $40k - 50k:| Guilford: | 5.3% (35,757) |
| Connecticut: | 5.3% (53,301) |
Number of households with income $50k - 60k:| Guilford: | 5.6% (37,213) |
| Connecticut: | 5.5% (55,690) |
Number of households with income $60k - 75k:| Guilford: | 7.9% (53,179) |
| State: | 8.0% (80,329) |
Number of households with income $75k - 100k:| Guilford: | 12.7% (85,213) |
| State: | 12.7% (128,070) |
Number of households with income $100k - 125k:| Guilford: | 10.0% (66,912) |
| State: | 10.0% (101,210) |
Number of households with income $125k - 150k:| Guilford: | 8.0% (53,719) |
| State: | 8.0% (81,250) |
Number of households with income $150k - 200k:| Guilford: | 11.8% (78,989) |
| State: | 11.8% (119,527) |
Number of households with income > $200k:| Guilford: | 18.4% (123,653) |
| State: | 18.6% (187,875) |
Aggregate household income in Guilford in 2022: $25,036,594,221
Median family income in Guilford in 2022:| Guilford: | $159,211 |
| Connecticut: | $128,955 |
Number of families with income < $10k:| Guilford: | 1.2% (83) |
| State: | 1.9% (11,537) |
Number of families with income $10k - 20k:| Guilford: | 0.8% (51) |
| State: | 1.8% (11,289) |
Number of families with income $20k - 30k:| Guilford: | 1.0% (65) |
| State: | 3.0% (18,506) |
Number of families with income $30k - 40k:| Guilford: | 1.7% (116) |
| State: | 2.9% (18,160) |
Number of families with income $40k - 50k:| Guilford: | 1.9% (126) |
| State: | 3.9% (24,550) |
Number of families with income $50k - 60k:| Guilford: | 2.5% (170) |
| Connecticut: | 4.3% (26,723) |
Number of families with income $60k - 75k:| Guilford: | 5.3% (358) |
| State: | 7.1% (44,075) |
Number of families with income $75k - 100k:| Guilford: | 11.1% (749) |
| State: | 12.5% (77,679) |
Number of families with income $100k - 125k:| Guilford: | 10.8% (732) |
| Connecticut: | 11.1% (69,086) |
Number of families with income $125k - 150k:| Guilford: | 9.8% (667) |
| State: | 9.6% (59,616) |
Number of families with income $150k - 200k:| Guilford: | 23.3% (1,580) |
| State: | 15.7% (97,890) |
Number of families with income > $200k:| Guilford: | 30.7% (2,082) |
| State: | 26.3% (163,417) |
Median non-family income in Guilford in 2022:| Guilford: | $81,721 |
| Connecticut: | $54,067 |
Change in median non-family income between 2000 and 2022:| Guilford, Connecticut: | +73.7% |
| State: | +68.7% |
Median per capita income in Guilford in 2022:| Guilford: | $72,169 |
| Connecticut: | $59,916 |
Change in median per capita income between 2000 and 2022:| Guilford, Connecticut: | +92.1% |
| Connecticut: | +90.2% |
Income statistics for Black or African American residents
Median household income in Guilford, CT in 2022:| Guilford: | $115,796 |
| State: | $61,803 |
Change in median household income between 2000 and 2022:| Guilford, Connecticut: | +60.9% |
| Connecticut: | +76.1% |
Number of households with income < $10k:| Guilford: | 6.8% (19,463) |
| State: | 6.8% (9,494) |
Number of households with income $10k - 20k:| Guilford: | 7.9% (22,557) |
| State: | 7.9% (11,003) |
Number of households with income $20k - 30k:| Guilford: | 10.8% (30,842) |
| State: | 10.8% (15,045) |
Number of households with income $30k - 40k:| Guilford: | 8.2% (23,577) |
| Connecticut: | 8.2% (11,501) |
Number of households with income $40k - 50k:| Guilford: | 7.4% (21,353) |
| Connecticut: | 7.4% (10,416) |
Number of households with income $50k - 60k:| Guilford: | 7.5% (21,595) |
| Connecticut: | 7.5% (10,534) |
Number of households with income $60k - 75k:| Guilford: | 8.0% (23,050) |
| Connecticut: | 8.0% (11,244) |
Number of households with income $75k - 100k:| Guilford: | 9.6% (27,409) |
| State: | 9.6% (13,370) |
Number of households with income $100k - 125k:| Guilford: | 10.2% (29,201) |
| State: | 10.2% (14,244) |
Number of households with income $125k - 150k:| Guilford: | 8.0% (23,055) |
| State: | 8.0% (11,246) |
Number of households with income $150k - 200k:| Guilford: | 7.7% (21,991) |
| State: | 7.7% (10,727) |
Number of households with income > $200k:| Guilford: | 7.9% (22,727) |
| State: | 7.9% (11,086) |
Aggregate household income in Guilford in 2022: $20,882,668
Median family income in Guilford in 2022:| Guilford: | $161,851 |
| State: | $87,228 |
Number of families with income $20k - 30k:| Guilford: | 1.5% (2) |
| State: | 6.0% (5,015) |
Number of families with income $40k - 50k:| Guilford: | 4.2% (5) |
| Connecticut: | 6.6% (5,531) |
Number of families with income $60k - 75k:| Guilford: | 13.4% (16) |
| Connecticut: | 8.2% (6,861) |
Number of families with income $150k - 200k:| Guilford: | 34.9% (41) |
| State: | 11.4% (9,497) |
Number of families with income > $200k:| Guilford: | 46.0% (54) |
| State: | 10.8% (9,057) |
Median non-family income in Guilford in 2022:| Guilford: | $90,702 |
| State: | $38,608 |
Change in median non-family income between 2000 and 2022:| Guilford, Connecticut: | +77.0% |
| State: | +77.0% |
Median per capita income in Guilford in 2022:| Guilford: | $59,045 |
| State: | $36,289 |
Change in median per capita income between 2000 and 2022:| Guilford, Connecticut: | +115.2% |
| State: | +117.5% |
Income statistics for Asian residents
Median household income in Guilford, CT in 2022:| Guilford: | $230,067 |
| State: | $110,568 |
Change in median household income between 2000 and 2022:| Guilford, Connecticut: | +110.1% |
| State: | +79.5% |
Number of households with income < $10k:| Guilford: | 7.1% (7,548) |
| Connecticut: | 7.1% (4,245) |
Number of households with income $10k - 20k:| Guilford: | 3.5% (3,711) |
| State: | 3.5% (2,087) |
Number of households with income $20k - 30k:| Guilford: | 4.1% (4,382) |
| State: | 4.1% (2,464) |
Number of households with income $30k - 40k:| Guilford: | 4.1% (4,406) |
| Connecticut: | 4.1% (2,478) |
Number of households with income $40k - 50k:| Guilford: | 3.3% (3,526) |
| State: | 3.3% (1,983) |
Number of households with income $50k - 60k:| Guilford: | 3.9% (4,139) |
| Connecticut: | 3.9% (2,328) |
Number of households with income $60k - 75k:| Guilford: | 7.0% (7,518) |
| State: | 7.0% (4,228) |
Number of households with income $75k - 100k:| Guilford: | 11.5% (12,289) |
| Connecticut: | 11.5% (6,911) |
Number of households with income $100k - 125k:| Guilford: | 10.2% (10,895) |
| Connecticut: | 10.2% (6,127) |
Number of households with income $125k - 150k:| Guilford: | 8.5% (9,031) |
| State: | 8.5% (5,079) |
Number of households with income $150k - 200k:| Guilford: | 12.4% (13,219) |
| State: | 12.4% (7,434) |
Number of households with income > $200k:| Guilford: | 24.4% (26,069) |
| State: | 24.4% (14,661) |
Aggregate household income in Guilford in 2022: $75,686,501
Median family income in Guilford in 2022:| Guilford: | $213,706 |
| State: | $134,548 |
Number of families with income $20k - 30k:| Guilford: | 2.0% (7) |
| State: | 3.8% (1,682) |
Number of families with income $50k - 60k:| Guilford: | 4.5% (16) |
| State: | 3.7% (1,635) |
Number of families with income $60k - 75k:| Guilford: | 3.0% (11) |
| Connecticut: | 6.0% (2,651) |
Number of families with income $75k - 100k:| Guilford: | 12.0% (43) |
| Connecticut: | 11.0% (4,844) |
Number of families with income $100k - 125k:| Guilford: | 16.5% (59) |
| Connecticut: | 10.5% (4,621) |
Number of families with income $125k - 150k:| Guilford: | 10.7% (38) |
| State: | 8.2% (3,588) |
Number of families with income $150k - 200k:| Guilford: | 18.7% (67) |
| Connecticut: | 14.2% (6,237) |
Number of families with income > $200k:| Guilford: | 32.6% (116) |
| State: | 30.8% (13,522) |
Median per capita income in Guilford in 2022:| Guilford: | $77,033 |
| Connecticut: | $55,295 |
Change in median per capita income between 2000 and 2022:| Guilford, Connecticut: | +103.6% |
| State: | +97.8% |
Income statistics for Hispanic or Latino residents
Median household income in Guilford, CT in 2022:| Guilford: | $129,796 |
| State: | $60,275 |
Change in median household income between 2000 and 2022:| Guilford, Connecticut: | +67.8% |
| State: | +87.9% |
Number of households with income < $10k:| Guilford: | 8.7% (44,818) |
| Connecticut: | 8.7% (18,584) |
Number of households with income $10k - 20k:| Guilford: | 9.1% (46,389) |
| State: | 9.1% (19,235) |
Number of households with income $20k - 30k:| Guilford: | 8.9% (45,795) |
| State: | 8.9% (18,989) |
Number of households with income $30k - 40k:| Guilford: | 7.5% (38,507) |
| State: | 7.5% (15,967) |
Number of households with income $40k - 50k:| Guilford: | 8.7% (44,534) |
| State: | 8.7% (18,466) |
Number of households with income $50k - 60k:| Guilford: | 6.9% (35,466) |
| State: | 6.9% (14,706) |
Number of households with income $60k - 75k:| Guilford: | 8.9% (45,551) |
| State: | 8.9% (18,888) |
Number of households with income $75k - 100k:| Guilford: | 13.5% (69,140) |
| Connecticut: | 13.5% (28,669) |
Number of households with income $100k - 125k:| Guilford: | 8.2% (42,045) |
| State: | 8.2% (17,434) |
Number of households with income $125k - 150k:| Guilford: | 6.5% (33,165) |
| State: | 6.5% (13,752) |
Number of households with income $150k - 200k:| Guilford: | 6.6% (34,038) |
| Connecticut: | 6.6% (14,114) |
Number of households with income > $200k:| Guilford: | 6.4% (32,871) |
| Connecticut: | 6.4% (13,630) |
Aggregate household income in Guilford in 2022: $59,587,163
Median family income in Guilford in 2022:| Guilford: | $127,955 |
| Connecticut: | $68,336 |
Number of families with income < $10k:| Guilford: | 3.7% (42) |
| Connecticut: | 5.2% (7,456) |
Number of families with income $10k - 20k:| Guilford: | 3.4% (39) |
| State: | 6.0% (8,616) |
Number of families with income $20k - 30k:| Guilford: | 4.4% (50) |
| State: | 8.9% (12,680) |
Number of families with income $30k - 40k:| Guilford: | 5.8% (66) |
| State: | 8.5% (12,090) |
Number of families with income $40k - 50k:| Guilford: | 5.7% (65) |
| State: | 8.8% (12,624) |
Number of families with income $50k - 60k:| Guilford: | 7.0% (80) |
| State: | 8.4% (11,924) |
Number of families with income $60k - 75k:| Guilford: | 8.5% (97) |
| State: | 8.9% (12,677) |
Number of families with income $75k - 100k:| Guilford: | 17.1% (195) |
| State: | 14.3% (20,457) |
Number of families with income $100k - 125k:| Guilford: | 10.2% (117) |
| Connecticut: | 8.2% (11,720) |
Number of families with income $125k - 150k:| Guilford: | 11.1% (126) |
| Connecticut: | 8.2% (11,729) |
Number of families with income $150k - 200k:| Guilford: | 13.0% (149) |
| State: | 7.1% (10,096) |
Number of families with income > $200k:| Guilford: | 10.2% (116) |
| State: | 7.4% (10,622) |
Median non-family income in Guilford in 2022:| Guilford: | $142,651 |
| State: | $36,714 |
Change in median non-family income between 2000 and 2022:| Guilford, Connecticut: | +73.9% |
| Connecticut: | +90.0% |
Median per capita income in Guilford in 2022:| Guilford: | $33,825 |
| State: | $28,507 |
Change in median per capita income between 2000 and 2022:| Guilford, Connecticut: | +80.3% |
| State: | +117.2% |
Income statistics for American Indian and Alaska Native residents
Median household income in Guilford, CT in 2022:| Guilford: | $113,162 |
| State: | $41,848 |
Change in median household income between 2000 and 2022:| Guilford, Connecticut: | +12.9% |
| Connecticut: | +12.9% |
Number of households with income < $10k:| Guilford: | 8.4% (285,104) |
| State: | 10.2% (340) |
Number of households with income $10k - 20k:| Guilford: | 9.4% (318,168) |
| Connecticut: | 8.5% (283) |
Number of households with income $20k - 30k:| Guilford: | 8.5% (287,787) |
| State: | 9.4% (314) |
Number of households with income $30k - 40k:| Guilford: | 9.1% (308,329) |
| State: | 10.1% (337) |
Number of households with income $40k - 50k:| Guilford: | 8.3% (282,820) |
| State: | 13.4% (447) |
Number of households with income $50k - 60k:| Guilford: | 7.8% (266,676) |
| State: | 3.1% (104) |
Number of households with income $60k - 75k:| Guilford: | 9.8% (332,399) |
| State: | 5.6% (188) |
Number of households with income $75k - 100k:| Guilford: | 12.6% (429,074) |
| State: | 13.4% (447) |
Number of households with income $100k - 125k:| Guilford: | 9.4% (320,862) |
| State: | 9.5% (317) |
Number of households with income $125k - 150k:| Guilford: | 5.6% (192,098) |
| Connecticut: | 3.9% (131) |
Number of households with income $150k - 200k:| Guilford: | 6.0% (202,508) |
| State: | 6.3% (212) |
Number of households with income > $200k:| Guilford: | 5.2% (175,282) |
| Connecticut: | 6.8% (228) |
Aggregate household income in Guilford in 2022: $1,007,976
Median family income in Guilford in 2022:| Guilford: | $139,737 |
| State: | $57,217 |
Number of families with income $100k - 125k:| Guilford: | 100.0% (29) |
| Connecticut: | 7.9% (159) |
Median non-family income in Guilford in 2022:| Guilford: | $8,441 |
| State: | $40,310 |
Change in median non-family income between 2000 and 2022:| Guilford, Connecticut: | +125.1% |
| State: | +125.1% |
Median per capita income in Guilford in 2022:| Guilford: | $57,700 |
| State: | $25,355 |
Change in median per capita income between 2000 and 2022:| Guilford, Connecticut: | +45.9% |
| State: | +39.4% |
Income statistics for Multirace residents
Median household income in Guilford, CT in 2022:| Guilford: | $208,089 |
| State: | $77,277 |
Change in median household income between 2000 and 2022:| Guilford, Connecticut: | +119.4% |
| State: | +113.6% |
Number of households with income < $10k:| Guilford: | 6.0% (19,541) |
| Connecticut: | 6.0% (7,457) |
Number of households with income $10k - 20k:| Guilford: | 8.1% (26,570) |
| State: | 8.1% (10,139) |
Number of households with income $20k - 30k:| Guilford: | 7.0% (22,803) |
| State: | 7.0% (8,702) |
Number of households with income $30k - 40k:| Guilford: | 6.9% (22,395) |
| State: | 6.9% (8,546) |
Number of households with income $40k - 50k:| Guilford: | 7.0% (22,830) |
| Connecticut: | 7.0% (8,712) |
Number of households with income $50k - 60k:| Guilford: | 5.9% (19,211) |
| State: | 5.9% (7,331) |
Number of households with income $60k - 75k:| Guilford: | 8.5% (27,867) |
| State: | 8.5% (10,634) |
Number of households with income $75k - 100k:| Guilford: | 14.1% (46,121) |
| State: | 14.1% (17,600) |
Number of households with income $100k - 125k:| Guilford: | 9.9% (32,450) |
| State: | 9.9% (12,383) |
Number of households with income $125k - 150k:| Guilford: | 7.2% (23,378) |
| State: | 7.2% (8,921) |
Number of households with income $150k - 200k:| Guilford: | 8.8% (28,621) |
| State: | 8.8% (10,922) |
Number of households with income > $200k:| Guilford: | 10.6% (34,714) |
| Connecticut: | 10.6% (13,247) |
Aggregate household income in Guilford in 2022: $92,442,707
Median family income in Guilford in 2022:| Guilford: | $202,536 |
| Connecticut: | $84,255 |
Number of families with income < $10k:| Guilford: | 1.7% (11) |
| State: | 3.6% (3,027) |
Number of families with income $30k - 40k:| Guilford: | 1.3% (8) |
| State: | 6.8% (5,759) |
Number of families with income $60k - 75k:| Guilford: | 6.2% (42) |
| State: | 7.8% (6,550) |
Number of families with income $75k - 100k:| Guilford: | 16.9% (114) |
| State: | 14.5% (12,236) |
Number of families with income $100k - 125k:| Guilford: | 10.5% (71) |
| State: | 9.2% (7,787) |
Number of families with income $125k - 150k:| Guilford: | 25.7% (173) |
| State: | 8.9% (7,503) |
Number of families with income > $200k:| Guilford: | 37.6% (253) |
| State: | 13.7% (11,603) |
Median non-family income in Guilford in 2022:| Guilford: | $13,253 |
| Connecticut: | $44,462 |
Change in median non-family income between 2000 and 2022:| Guilford, Connecticut: | +81.0% |
| State: | +97.6% |
Median per capita income in Guilford in 2022:| Guilford: | $47,768 |
| Connecticut: | $32,794 |
Change in median per capita income between 2000 and 2022:| Guilford, Connecticut: | +95.5% |
| State: | +117.2% |
Income statistics for other residents
Number of households with income < $10k:| Guilford: | 9.3% (10) |
| State: | 9.0% (8,596) |
Number of households with income $10k - 20k:| Guilford: | 10.2% (11) |
| State: | 10.2% (9,773) |
Number of households with income $20k - 30k:| Guilford: | 9.3% (10) |
| State: | 9.1% (8,691) |
Number of households with income $30k - 40k:| Guilford: | 7.4% (8) |
| Connecticut: | 7.8% (7,447) |
Number of households with income $40k - 50k:| Guilford: | 8.3% (9) |
| State: | 8.2% (7,860) |
Number of households with income $50k - 60k:| Guilford: | 5.6% (6) |
| State: | 6.0% (5,757) |
Number of households with income $60k - 75k:| Guilford: | 9.3% (10) |
| Connecticut: | 9.3% (8,942) |
Number of households with income $75k - 100k:| Guilford: | 13.9% (15) |
| State: | 14.3% (13,700) |
Number of households with income $100k - 125k:| Guilford: | 7.4% (8) |
| State: | 7.2% (6,906) |
Number of households with income $125k - 150k:| Guilford: | 6.5% (7) |
| State: | 6.5% (6,215) |
Number of households with income $150k - 200k:| Guilford: | 6.5% (7) |
| Connecticut: | 6.1% (5,865) |
Number of households with income > $200k:| Guilford: | 6.5% (7) |
| State: | 6.3% (6,065) |
Aggregate household income in Guilford in 2022: $14,947,727
Median family income in Guilford in 2022:| Guilford: | $97,910 |
| State: | $67,610 |
Number of families with income $20k - 30k:| Guilford: | 14.6% (13) |
| State: | 8.7% (5,752) |
Number of families with income $40k - 50k:| Guilford: | 13.4% (12) |
| Connecticut: | 9.1% (6,039) |
Number of families with income $60k - 75k:| Guilford: | 18.5% (16) |
| State: | 9.4% (6,232) |
Number of families with income $100k - 125k:| Guilford: | 53.6% (47) |
| State: | 6.8% (4,502) |
Median per capita income in Guilford in 2022:| Guilford: | $30,512 |
| State: | $29,353 |