Gig Harbor Peninsula, Washington (WA) income map, earnings map, and wages data
The median household income in Gig Harbor Peninsula, WA in 2022 was $125,764, which was 27.4% greater than the median annual income of $91,306 across the entire state of Washington. Compared to the median income of $60,855 in 2000 this represents an increase of 51.6%. The per capita income in 2022 was $62,367, which means an increase of 53.5% compared to 2000 when it was $29,010.
Income statistics for all residents
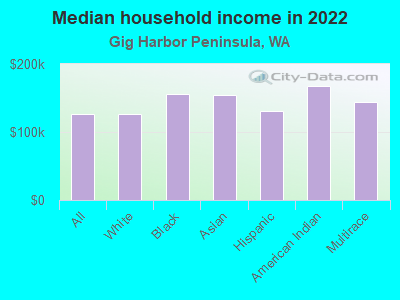
Median household income in Gig Harbor Peninsula, WA in 2022:| Gig Harbor Peninsula: | $125,765 |
| State: | $91,306 |
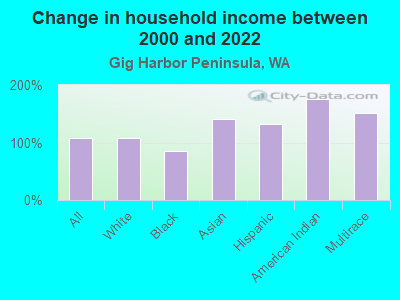
Change in median household income between 2000 and 2022:| Gig Harbor Peninsula, Washington: | +106.7% |
| Washington: | +99.5% |
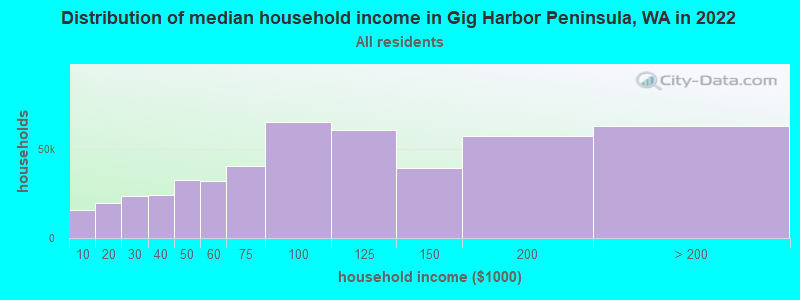
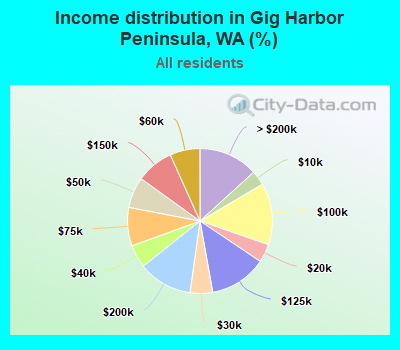
Number of households with income < $10k:| Gig Harbor Peninsula: | 3.3% (15,523) |
| State: | 4.5% (139,331) |
Number of households with income $10k - 20k:| Gig Harbor Peninsula: | 4.1% (19,438) |
| State: | 5.0% (154,508) |
Number of households with income $20k - 30k:| Gig Harbor Peninsula: | 5.0% (23,770) |
| Washington: | 5.4% (166,555) |
Number of households with income $30k - 40k:| Gig Harbor Peninsula: | 5.1% (24,361) |
| State: | 5.5% (170,324) |
Number of households with income $40k - 50k:| Gig Harbor Peninsula: | 6.9% (32,742) |
| Washington: | 6.0% (183,941) |
Number of households with income $50k - 60k:| Gig Harbor Peninsula: | 6.7% (31,778) |
| State: | 6.1% (187,395) |
Number of households with income $60k - 75k:| Gig Harbor Peninsula: | 8.6% (40,643) |
| Washington: | 8.7% (266,771) |
Number of households with income $75k - 100k:| Gig Harbor Peninsula: | 13.8% (65,170) |
| State: | 13.1% (404,672) |
Number of households with income $100k - 125k:| Gig Harbor Peninsula: | 12.8% (60,432) |
| State: | 11.0% (337,911) |
Number of households with income $125k - 150k:| Gig Harbor Peninsula: | 8.3% (39,509) |
| State: | 8.0% (244,934) |
Number of households with income $150k - 200k:| Gig Harbor Peninsula: | 12.1% (57,217) |
| Washington: | 10.5% (323,812) |
Number of households with income > $200k:| Gig Harbor Peninsula: | 13.3% (62,820) |
| State: | 16.2% (499,799) |
Aggregate household income in Gig Harbor Peninsula in 2022: $23,233,507,723
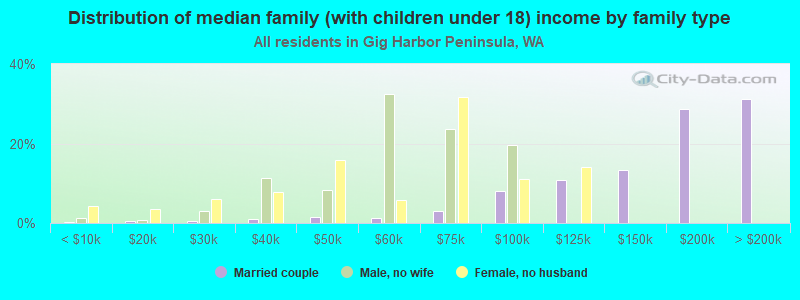
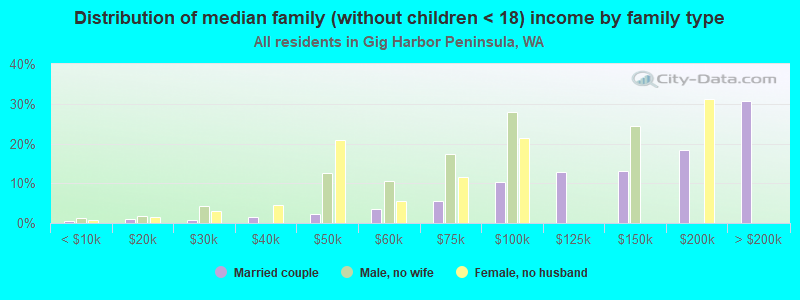
Median family income in Gig Harbor Peninsula in 2022:| Gig Harbor Peninsula: | $134,893 |
| State: | $109,192 |
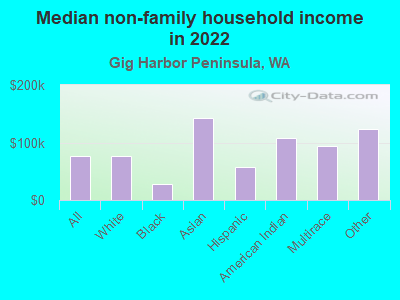
Median non-family income in Gig Harbor Peninsula in 2022:| Gig Harbor Peninsula: | $76,980 |
| State: | $57,299 |
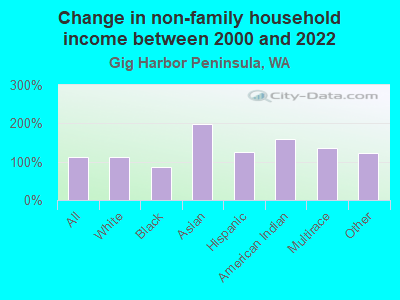
Change in median non-family income between 2000 and 2022:| Gig Harbor Peninsula, Washington: | +112.0% |
| Washington: | +94.9% |
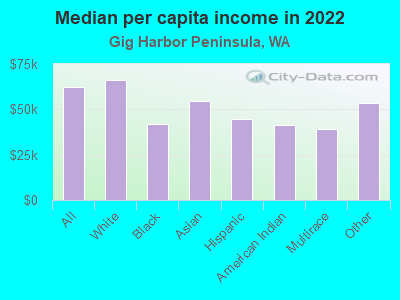
Median per capita income in Gig Harbor Peninsula in 2022:| Gig Harbor Peninsula: | $62,367 |
| State: | $50,764 |
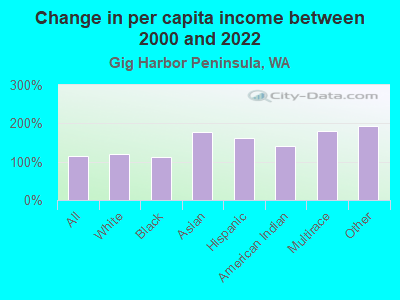
Change in median per capita income between 2000 and 2022:| Gig Harbor Peninsula, Washington: | +115.0% |
| State: | +121.0% |
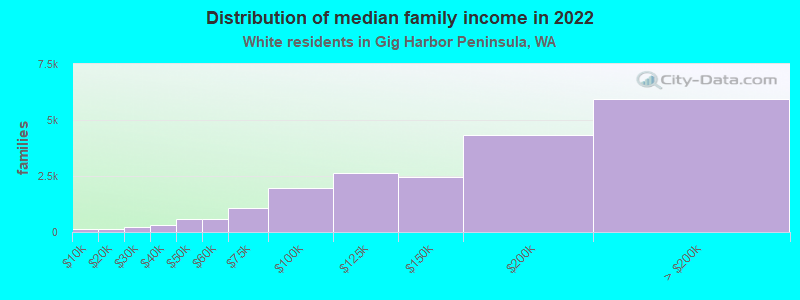
Income statistics for White residents
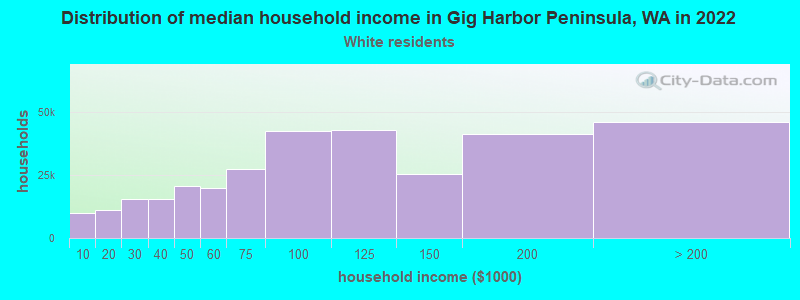
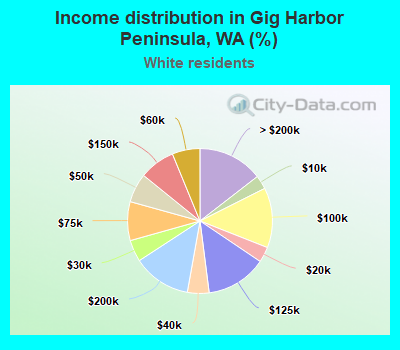
Median household income in Gig Harbor Peninsula, WA in 2022:| Gig Harbor Peninsula: | $126,216 |
| State: | $91,916 |
Change in median household income between 2000 and 2022:| Gig Harbor Peninsula, Washington: | +108.2% |
| Washington: | +95.4% |
Number of households with income < $10k:| Gig Harbor Peninsula: | 3.1% (9,778) |
| State: | 4.3% (95,850) |
Number of households with income $10k - 20k:| Gig Harbor Peninsula: | 3.5% (11,019) |
| State: | 4.8% (106,421) |
Number of households with income $20k - 30k:| Gig Harbor Peninsula: | 4.8% (15,375) |
| State: | 5.5% (122,860) |
Number of households with income $30k - 40k:| Gig Harbor Peninsula: | 4.8% (15,417) |
| Washington: | 5.4% (119,627) |
Number of households with income $40k - 50k:| Gig Harbor Peninsula: | 6.5% (20,714) |
| State: | 5.9% (132,276) |
Number of households with income $50k - 60k:| Gig Harbor Peninsula: | 6.2% (19,720) |
| State: | 6.1% (136,212) |
Number of households with income $60k - 75k:| Gig Harbor Peninsula: | 8.7% (27,630) |
| State: | 8.8% (196,086) |
Number of households with income $75k - 100k:| Gig Harbor Peninsula: | 13.4% (42,647) |
| State: | 13.4% (299,192) |
Number of households with income $100k - 125k:| Gig Harbor Peninsula: | 13.5% (43,100) |
| Washington: | 11.3% (252,209) |
Number of households with income $125k - 150k:| Gig Harbor Peninsula: | 8.0% (25,408) |
| Washington: | 7.9% (175,962) |
Number of households with income $150k - 200k:| Gig Harbor Peninsula: | 13.0% (41,339) |
| Washington: | 10.7% (239,156) |
Number of households with income > $200k:| Gig Harbor Peninsula: | 14.5% (46,206) |
| State: | 16.1% (359,917) |
Aggregate household income in Gig Harbor Peninsula in 2022: $16,431,099,992
Median family income in Gig Harbor Peninsula in 2022:| Gig Harbor Peninsula: | $137,457 |
| Washington: | $112,511 |
Number of families with income < $10k:| Gig Harbor Peninsula: | 0.6% (122) |
| State: | 2.4% (33,676) |
Number of families with income $10k - 20k:| Gig Harbor Peninsula: | 0.7% (149) |
| Washington: | 2.0% (28,228) |
Number of families with income $20k - 30k:| Gig Harbor Peninsula: | 1.2% (240) |
| Washington: | 2.9% (39,288) |
Number of families with income $30k - 40k:| Gig Harbor Peninsula: | 1.6% (332) |
| Washington: | 3.6% (50,190) |
Number of families with income $40k - 50k:| Gig Harbor Peninsula: | 2.9% (581) |
| State: | 4.6% (63,009) |
Number of families with income $50k - 60k:| Gig Harbor Peninsula: | 2.8% (560) |
| Washington: | 5.0% (69,270) |
Number of families with income $60k - 75k:| Gig Harbor Peninsula: | 5.3% (1,080) |
| State: | 8.2% (112,369) |
Number of families with income $75k - 100k:| Gig Harbor Peninsula: | 9.6% (1,950) |
| Washington: | 14.1% (194,214) |
Number of families with income $100k - 125k:| Gig Harbor Peninsula: | 12.8% (2,614) |
| State: | 13.2% (182,184) |
Number of families with income $125k - 150k:| Gig Harbor Peninsula: | 12.0% (2,450) |
| Washington: | 9.5% (130,928) |
Number of families with income $150k - 200k:| Gig Harbor Peninsula: | 21.3% (4,337) |
| Washington: | 13.7% (188,621) |
Number of families with income > $200k:| Gig Harbor Peninsula: | 29.2% (5,935) |
| State: | 20.8% (285,982) |
Median non-family income in Gig Harbor Peninsula in 2022:| Gig Harbor Peninsula: | $75,851 |
| Washington: | $56,103 |
Change in median non-family income between 2000 and 2022:| Gig Harbor Peninsula, Washington: | +110.7% |
| State: | +87.7% |
Median per capita income in Gig Harbor Peninsula in 2022:| Gig Harbor Peninsula: | $66,307 |
| State: | $55,212 |
Change in median per capita income between 2000 and 2022:| Gig Harbor Peninsula, Washington: | +121.3% |
| Washington: | +123.8% |
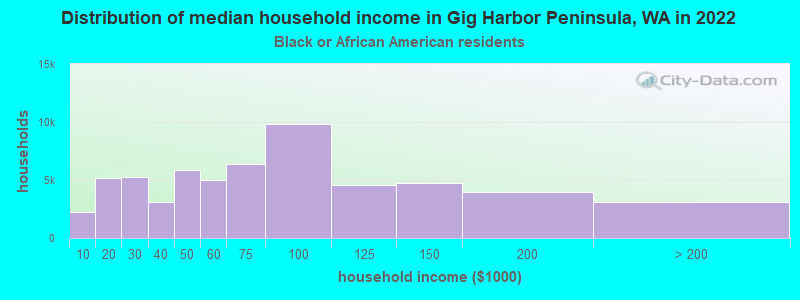
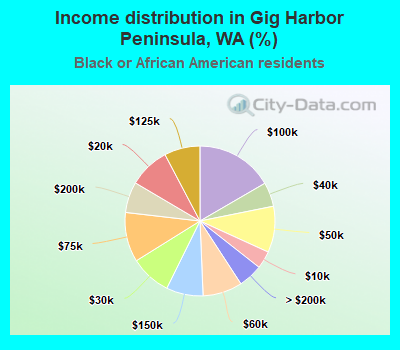
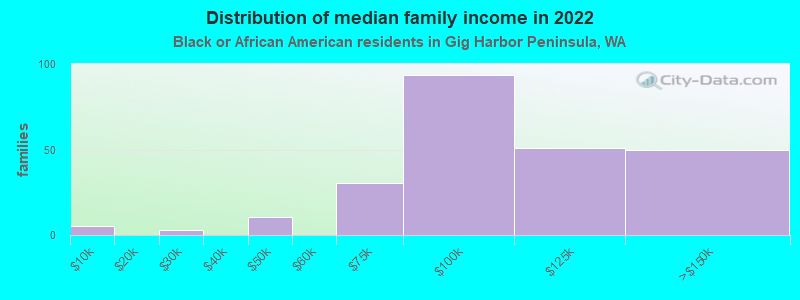
Income statistics for Black or African American residents
Median household income in Gig Harbor Peninsula, WA in 2022:| Gig Harbor Peninsula: | $155,891 |
| State: | $68,202 |
Change in median household income between 2000 and 2022:| Gig Harbor Peninsula, Washington: | +86.4% |
| State: | +89.9% |
Number of households with income < $10k:| Gig Harbor Peninsula: | 3.8% (2,242) |
| State: | 7.2% (8,014) |
Number of households with income $10k - 20k:| Gig Harbor Peninsula: | 8.8% (5,212) |
| Washington: | 8.0% (8,904) |
Number of households with income $20k - 30k:| Gig Harbor Peninsula: | 8.8% (5,221) |
| State: | 7.4% (8,207) |
Number of households with income $30k - 40k:| Gig Harbor Peninsula: | 5.2% (3,084) |
| Washington: | 5.6% (6,220) |
Number of households with income $40k - 50k:| Gig Harbor Peninsula: | 10.0% (5,898) |
| State: | 9.5% (10,585) |
Number of households with income $50k - 60k:| Gig Harbor Peninsula: | 8.5% (5,040) |
| State: | 7.3% (8,078) |
Number of households with income $60k - 75k:| Gig Harbor Peninsula: | 10.7% (6,339) |
| Washington: | 8.7% (9,704) |
Number of households with income $75k - 100k:| Gig Harbor Peninsula: | 16.6% (9,843) |
| State: | 12.9% (14,315) |
Number of households with income $100k - 125k:| Gig Harbor Peninsula: | 7.7% (4,561) |
| State: | 7.7% (8,592) |
Number of households with income $125k - 150k:| Gig Harbor Peninsula: | 8.0% (4,712) |
| Washington: | 8.9% (9,840) |
Number of households with income $150k - 200k:| Gig Harbor Peninsula: | 6.6% (3,934) |
| State: | 7.6% (8,434) |
Number of households with income > $200k:| Gig Harbor Peninsula: | 5.2% (3,095) |
| Washington: | 9.1% (10,075) |
Aggregate household income in Gig Harbor Peninsula in 2022: $25,616,897
Median family income in Gig Harbor Peninsula in 2022:| Gig Harbor Peninsula: | $155,565 |
| State: | $82,165 |
Number of families with income < $10k:| Gig Harbor Peninsula: | 2.2% (5) |
| State: | 5.5% (3,709) |
Number of families with income $20k - 30k:| Gig Harbor Peninsula: | 1.2% (3) |
| Washington: | 4.7% (3,151) |
Number of families with income $40k - 50k:| Gig Harbor Peninsula: | 4.4% (11) |
| Washington: | 6.8% (4,558) |
Number of families with income $60k - 75k:| Gig Harbor Peninsula: | 12.6% (31) |
| State: | 9.3% (6,231) |
Number of families with income $75k - 100k:| Gig Harbor Peninsula: | 38.4% (93) |
| Washington: | 14.8% (9,876) |
Number of families with income $100k - 125k:| Gig Harbor Peninsula: | 20.9% (51) |
| State: | 9.0% (6,018) |
Number of families with income $125k - 150k:| Gig Harbor Peninsula: | 20.3% (50) |
| State: | 9.5% (6,348) |
Median non-family income in Gig Harbor Peninsula in 2022:| Gig Harbor Peninsula: | $26,972 |
| State: | $49,169 |
Change in median non-family income between 2000 and 2022:| Gig Harbor Peninsula, Washington: | +85.6% |
| Washington: | +87.7% |
Median per capita income in Gig Harbor Peninsula in 2022:| Gig Harbor Peninsula: | $41,813 |
| State: | $38,209 |
Change in median per capita income between 2000 and 2022:| Gig Harbor Peninsula, Washington: | +113.3% |
| State: | +115.3% |
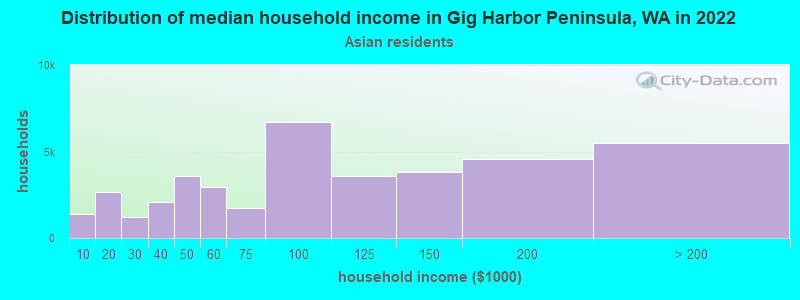
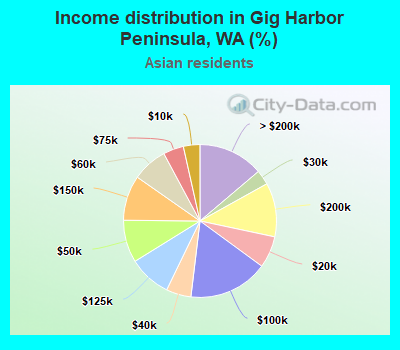
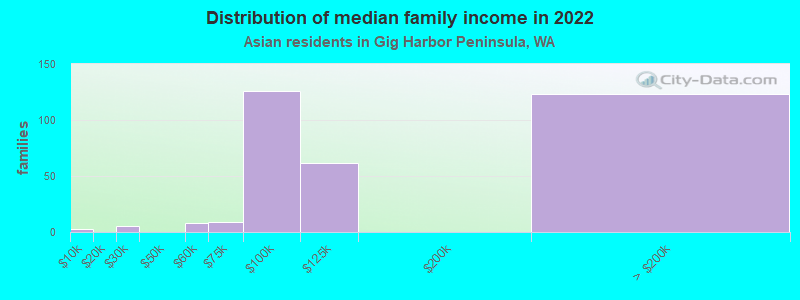
Income statistics for Asian residents
Median household income in Gig Harbor Peninsula, WA in 2022:| Gig Harbor Peninsula: | $154,481 |
| State: | $125,692 |
Change in median household income between 2000 and 2022:| Gig Harbor Peninsula, Washington: | +141.1% |
| Washington: | +164.5% |
Number of households with income < $10k:| Gig Harbor Peninsula: | 3.5% (1,390) |
| State: | 4.9% (14,099) |
Number of households with income $10k - 20k:| Gig Harbor Peninsula: | 6.7% (2,676) |
| State: | 3.5% (9,873) |
Number of households with income $20k - 30k:| Gig Harbor Peninsula: | 3.1% (1,237) |
| Washington: | 2.9% (8,352) |
Number of households with income $30k - 40k:| Gig Harbor Peninsula: | 5.3% (2,095) |
| State: | 4.0% (11,415) |
Number of households with income $40k - 50k:| Gig Harbor Peninsula: | 9.0% (3,578) |
| State: | 4.0% (11,421) |
Number of households with income $50k - 60k:| Gig Harbor Peninsula: | 7.5% (2,972) |
| State: | 4.2% (12,100) |
Number of households with income $60k - 75k:| Gig Harbor Peninsula: | 4.3% (1,721) |
| State: | 6.3% (17,903) |
Number of households with income $75k - 100k:| Gig Harbor Peninsula: | 16.9% (6,710) |
| State: | 10.4% (29,663) |
Number of households with income $100k - 125k:| Gig Harbor Peninsula: | 9.0% (3,583) |
| State: | 9.4% (26,839) |
Number of households with income $125k - 150k:| Gig Harbor Peninsula: | 9.6% (3,807) |
| State: | 8.5% (24,200) |
Number of households with income $150k - 200k:| Gig Harbor Peninsula: | 11.4% (4,543) |
| State: | 12.6% (35,976) |
Number of households with income > $200k:| Gig Harbor Peninsula: | 13.8% (5,502) |
| Washington: | 29.2% (83,109) |
Aggregate household income in Gig Harbor Peninsula in 2022: $58,244,207
Median family income in Gig Harbor Peninsula in 2022:| Gig Harbor Peninsula: | $180,451 |
| State: | $143,595 |
Number of families with income < $10k:| Gig Harbor Peninsula: | 1.0% (3) |
| State: | 2.9% (5,479) |
Number of families with income $20k - 30k:| Gig Harbor Peninsula: | 1.4% (5) |
| Washington: | 1.9% (3,558) |
Number of families with income $50k - 60k:| Gig Harbor Peninsula: | 2.4% (8) |
| State: | 4.1% (7,663) |
Number of families with income $60k - 75k:| Gig Harbor Peninsula: | 2.6% (9) |
| State: | 5.1% (9,490) |
Number of families with income $75k - 100k:| Gig Harbor Peninsula: | 37.5% (126) |
| State: | 11.7% (21,919) |
Number of families with income $100k - 125k:| Gig Harbor Peninsula: | 18.4% (62) |
| State: | 9.3% (17,280) |
Number of families with income > $200k:| Gig Harbor Peninsula: | 36.6% (123) |
| State: | 34.4% (64,250) |
Median non-family income in Gig Harbor Peninsula in 2022:| Gig Harbor Peninsula: | $143,255 |
| State: | $84,971 |
Median per capita income in Gig Harbor Peninsula in 2022:| Gig Harbor Peninsula: | $54,445 |
| Washington: | $67,666 |
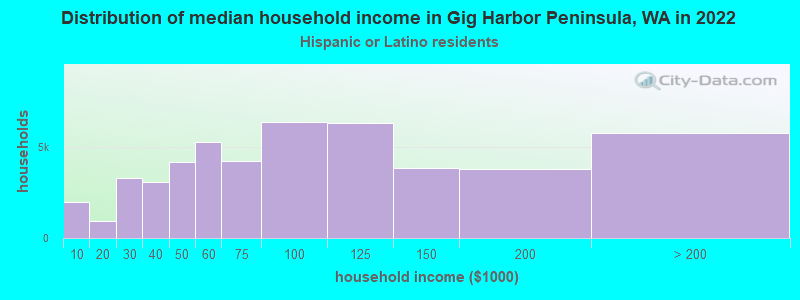
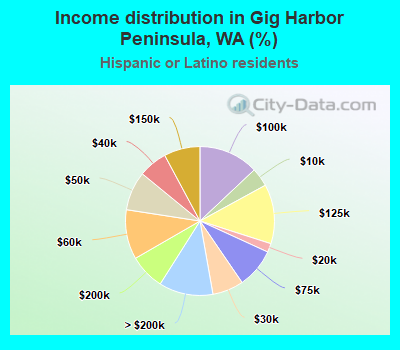
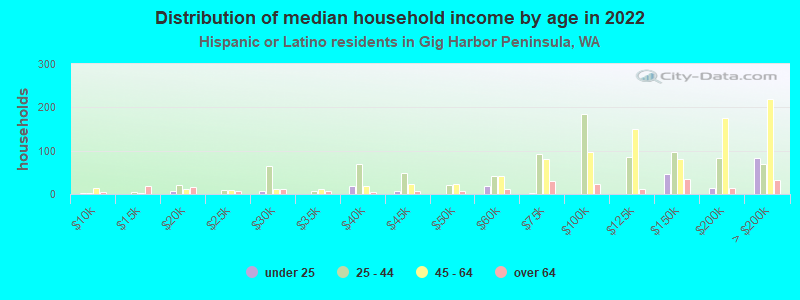
Income statistics for Hispanic or Latino residents
Median household income in Gig Harbor Peninsula, WA in 2022:| Gig Harbor Peninsula: | $131,488 |
| Washington: | $74,770 |
Change in median household income between 2000 and 2022:| Gig Harbor Peninsula, Washington: | +133.3% |
| State: | +128.3% |
Number of households with income < $10k:| Gig Harbor Peninsula: | 4.1% (1,987) |
| State: | 4.9% (14,456) |
Number of households with income $10k - 20k:| Gig Harbor Peninsula: | 1.9% (927) |
| Washington: | 5.3% (15,449) |
Number of households with income $20k - 30k:| Gig Harbor Peninsula: | 6.8% (3,306) |
| Washington: | 6.8% (20,016) |
Number of households with income $30k - 40k:| Gig Harbor Peninsula: | 6.2% (3,050) |
| State: | 7.7% (22,548) |
Number of households with income $40k - 50k:| Gig Harbor Peninsula: | 8.5% (4,144) |
| State: | 7.3% (21,450) |
Number of households with income $50k - 60k:| Gig Harbor Peninsula: | 10.8% (5,266) |
| State: | 7.7% (22,744) |
Number of households with income $60k - 75k:| Gig Harbor Peninsula: | 8.6% (4,206) |
| State: | 10.5% (30,737) |
Number of households with income $75k - 100k:| Gig Harbor Peninsula: | 13.0% (6,340) |
| State: | 14.9% (43,843) |
Number of households with income $100k - 125k:| Gig Harbor Peninsula: | 12.9% (6,301) |
| State: | 11.1% (32,554) |
Number of households with income $125k - 150k:| Gig Harbor Peninsula: | 7.8% (3,828) |
| State: | 7.4% (21,624) |
Number of households with income $150k - 200k:| Gig Harbor Peninsula: | 7.7% (3,752) |
| State: | 7.3% (21,360) |
Number of households with income > $200k:| Gig Harbor Peninsula: | 11.8% (5,748) |
| Washington: | 9.2% (27,055) |
Aggregate household income in Gig Harbor Peninsula in 2022: $117,201,781
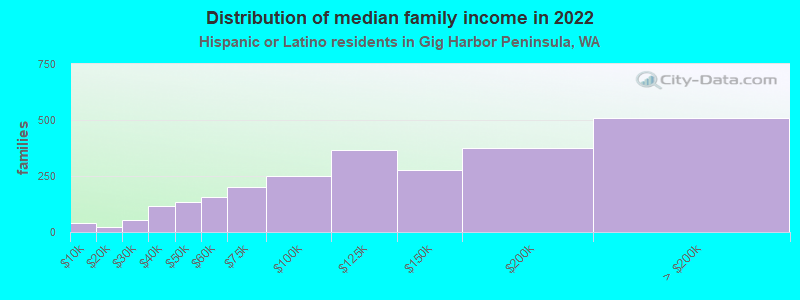
Median family income in Gig Harbor Peninsula in 2022:| Gig Harbor Peninsula: | $147,040 |
| State: | $76,866 |
Number of families with income < $10k:| Gig Harbor Peninsula: | 1.6% (40) |
| State: | 4.4% (9,443) |
Number of families with income $10k - 20k:| Gig Harbor Peninsula: | 1.0% (24) |
| State: | 3.5% (7,524) |
Number of families with income $20k - 30k:| Gig Harbor Peninsula: | 2.1% (52) |
| Washington: | 5.6% (12,052) |
Number of families with income $30k - 40k:| Gig Harbor Peninsula: | 4.6% (116) |
| State: | 8.3% (17,803) |
Number of families with income $40k - 50k:| Gig Harbor Peninsula: | 5.4% (134) |
| State: | 7.7% (16,361) |
Number of families with income $50k - 60k:| Gig Harbor Peninsula: | 6.2% (156) |
| Washington: | 7.9% (16,852) |
Number of families with income $60k - 75k:| Gig Harbor Peninsula: | 8.1% (203) |
| Washington: | 11.4% (24,342) |
Number of families with income $75k - 100k:| Gig Harbor Peninsula: | 9.9% (248) |
| State: | 14.4% (30,698) |
Number of families with income $100k - 125k:| Gig Harbor Peninsula: | 14.7% (368) |
| Washington: | 11.4% (24,331) |
Number of families with income $125k - 150k:| Gig Harbor Peninsula: | 11.0% (276) |
| State: | 7.5% (16,099) |
Number of families with income $150k - 200k:| Gig Harbor Peninsula: | 15.1% (377) |
| Washington: | 8.2% (17,551) |
Number of families with income > $200k:| Gig Harbor Peninsula: | 20.3% (507) |
| Washington: | 9.7% (20,653) |
Median non-family income in Gig Harbor Peninsula in 2022:| Gig Harbor Peninsula: | $57,215 |
| State: | $54,173 |
Change in median non-family income between 2000 and 2022:| Gig Harbor Peninsula, Washington: | +125.1% |
| Washington: | +105.8% |
Median per capita income in Gig Harbor Peninsula in 2022:| Gig Harbor Peninsula: | $44,829 |
| State: | $28,252 |
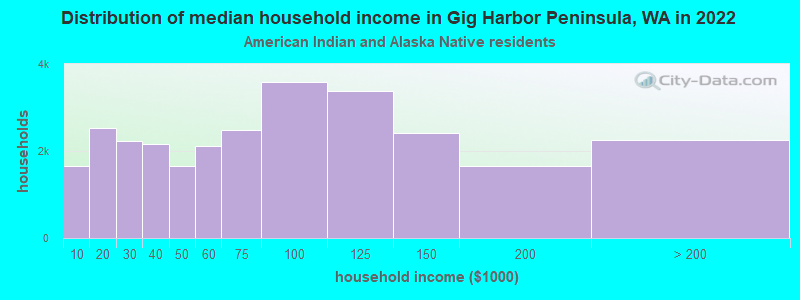
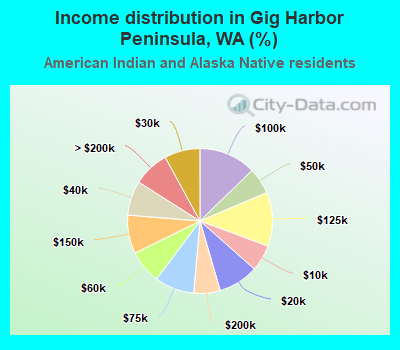
Income statistics for American Indian and Alaska Native residents
Median household income in Gig Harbor Peninsula, WA in 2022:| Gig Harbor Peninsula: | $167,617 |
| Washington: | $71,255 |
Number of households with income < $10k:| Gig Harbor Peninsula: | 5.9% (1,658) |
| State: | 5.9% (1,768) |
Number of households with income $10k - 20k:| Gig Harbor Peninsula: | 9.0% (2,530) |
| Washington: | 8.9% (2,694) |
Number of households with income $20k - 30k:| Gig Harbor Peninsula: | 8.0% (2,238) |
| State: | 8.0% (2,412) |
Number of households with income $30k - 40k:| Gig Harbor Peninsula: | 7.7% (2,169) |
| Washington: | 7.7% (2,327) |
Number of households with income $40k - 50k:| Gig Harbor Peninsula: | 5.9% (1,657) |
| State: | 5.8% (1,755) |
Number of households with income $50k - 60k:| Gig Harbor Peninsula: | 7.5% (2,108) |
| State: | 7.5% (2,259) |
Number of households with income $60k - 75k:| Gig Harbor Peninsula: | 8.8% (2,487) |
| State: | 8.8% (2,669) |
Number of households with income $75k - 100k:| Gig Harbor Peninsula: | 12.7% (3,584) |
| State: | 12.8% (3,861) |
Number of households with income $100k - 125k:| Gig Harbor Peninsula: | 12.0% (3,383) |
| State: | 12.0% (3,618) |
Number of households with income $125k - 150k:| Gig Harbor Peninsula: | 8.6% (2,416) |
| Washington: | 8.6% (2,580) |
Number of households with income $150k - 200k:| Gig Harbor Peninsula: | 5.9% (1,652) |
| State: | 5.9% (1,774) |
Number of households with income > $200k:| Gig Harbor Peninsula: | 8.0% (2,262) |
| State: | 8.1% (2,447) |
Aggregate household income in Gig Harbor Peninsula in 2022: $12,953,426
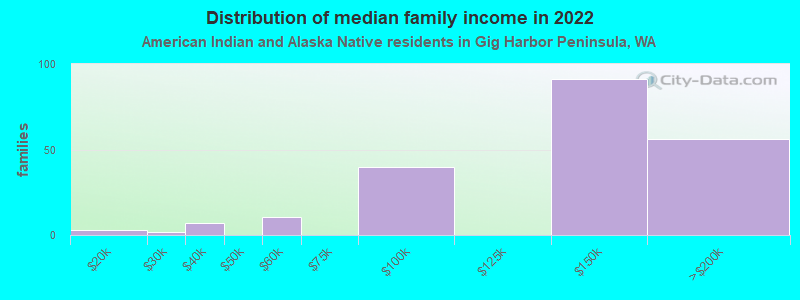
Median family income in Gig Harbor Peninsula in 2022:| Gig Harbor Peninsula: | $143,924 |
| Washington: | $79,010 |
Number of families with income $10k - 20k:| Gig Harbor Peninsula: | 1.3% (3) |
| State: | 5.2% (1,056) |
Number of families with income $20k - 30k:| Gig Harbor Peninsula: | 0.8% (2) |
| State: | 6.2% (1,258) |
Number of families with income $30k - 40k:| Gig Harbor Peninsula: | 3.4% (7) |
| State: | 5.9% (1,190) |
Number of families with income $50k - 60k:| Gig Harbor Peninsula: | 5.0% (10) |
| State: | 9.7% (1,973) |
Number of families with income $75k - 100k:| Gig Harbor Peninsula: | 19.0% (40) |
| State: | 13.1% (2,669) |
Number of families with income $125k - 150k:| Gig Harbor Peninsula: | 43.7% (92) |
| State: | 9.8% (2,000) |
Number of families with income $150k - 200k:| Gig Harbor Peninsula: | 26.9% (56) |
| Washington: | 7.8% (1,584) |
Median non-family income in Gig Harbor Peninsula in 2022:| Gig Harbor Peninsula: | $108,185 |
| State: | $35,591 |
Median per capita income in Gig Harbor Peninsula in 2022:| Gig Harbor Peninsula: | $41,178 |
| State: | $27,053 |
Change in median per capita income between 2000 and 2022:| Gig Harbor Peninsula, Washington: | +142.3% |
| State: | +98.6% |
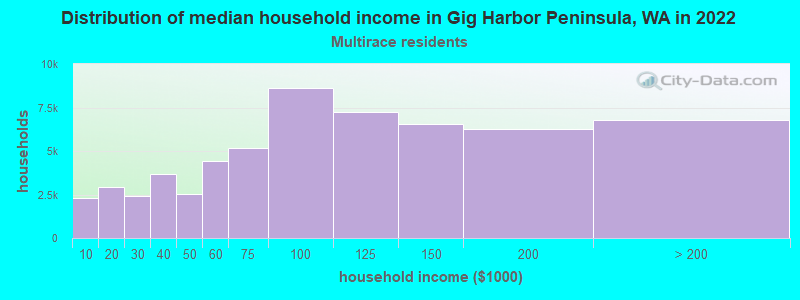
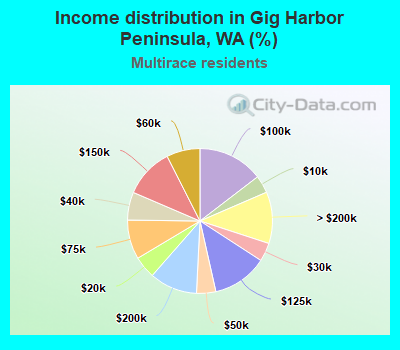
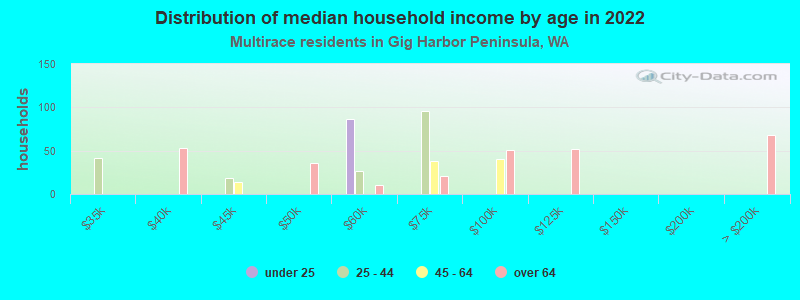
Income statistics for Multirace residents
Median household income in Gig Harbor Peninsula, WA in 2022:| Gig Harbor Peninsula: | $144,002 |
| Washington: | $84,303 |
Number of households with income < $10k:| Gig Harbor Peninsula: | 3.9% (2,321) |
| State: | 4.3% (12,040) |
Number of households with income $10k - 20k:| Gig Harbor Peninsula: | 5.0% (2,927) |
| State: | 6.6% (18,437) |
Number of households with income $20k - 30k:| Gig Harbor Peninsula: | 4.1% (2,437) |
| Washington: | 5.2% (14,559) |
Number of households with income $30k - 40k:| Gig Harbor Peninsula: | 6.3% (3,683) |
| State: | 6.7% (18,491) |
Number of households with income $40k - 50k:| Gig Harbor Peninsula: | 4.3% (2,536) |
| State: | 6.3% (17,459) |
Number of households with income $50k - 60k:| Gig Harbor Peninsula: | 7.5% (4,403) |
| Washington: | 6.9% (19,086) |
Number of households with income $60k - 75k:| Gig Harbor Peninsula: | 8.8% (5,172) |
| State: | 9.1% (25,310) |
Number of households with income $75k - 100k:| Gig Harbor Peninsula: | 14.6% (8,595) |
| Washington: | 13.5% (37,493) |
Number of households with income $100k - 125k:| Gig Harbor Peninsula: | 12.3% (7,262) |
| State: | 10.7% (29,626) |
Number of households with income $125k - 150k:| Gig Harbor Peninsula: | 11.1% (6,524) |
| Washington: | 8.6% (23,899) |
Number of households with income $150k - 200k:| Gig Harbor Peninsula: | 10.7% (6,288) |
| Washington: | 10.2% (28,214) |
Number of households with income > $200k:| Gig Harbor Peninsula: | 11.5% (6,777) |
| State: | 11.9% (32,947) |
Aggregate household income in Gig Harbor Peninsula in 2022: $158,266,210
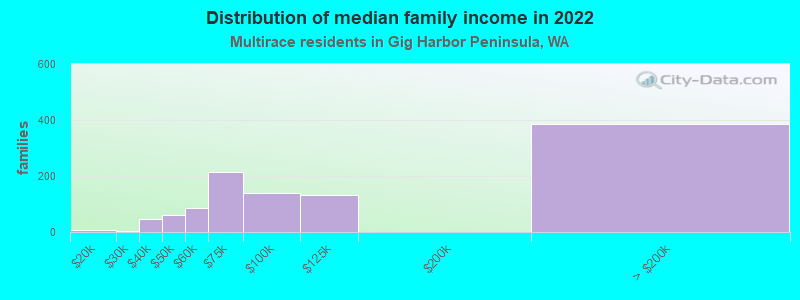
Median family income in Gig Harbor Peninsula in 2022:| Gig Harbor Peninsula: | $149,143 |
| State: | $95,629 |
Number of families with income $10k - 20k:| Gig Harbor Peninsula: | 0.5% (6) |
| State: | 4.3% (7,519) |
Number of families with income $20k - 30k:| Gig Harbor Peninsula: | 0.3% (3) |
| Washington: | 4.4% (7,775) |
Number of families with income $30k - 40k:| Gig Harbor Peninsula: | 4.2% (45) |
| State: | 5.8% (10,186) |
Number of families with income $40k - 50k:| Gig Harbor Peninsula: | 5.8% (62) |
| State: | 5.9% (10,412) |
Number of families with income $50k - 60k:| Gig Harbor Peninsula: | 8.0% (86) |
| Washington: | 5.6% (9,922) |
Number of families with income $60k - 75k:| Gig Harbor Peninsula: | 20.0% (215) |
| State: | 9.7% (17,113) |
Number of families with income $75k - 100k:| Gig Harbor Peninsula: | 13.0% (140) |
| State: | 13.6% (23,984) |
Number of families with income $100k - 125k:| Gig Harbor Peninsula: | 12.2% (131) |
| Washington: | 10.4% (18,288) |
Number of families with income > $200k:| Gig Harbor Peninsula: | 35.9% (386) |
| Washington: | 14.4% (25,289) |
Median non-family income in Gig Harbor Peninsula in 2022:| Gig Harbor Peninsula: | $93,338 |
| State: | $56,573 |
Change in median non-family income between 2000 and 2022:| Gig Harbor Peninsula, Washington: | +135.0% |
| State: | +115.0% |
Median per capita income in Gig Harbor Peninsula in 2022:| Gig Harbor Peninsula: | $38,929 |
| Washington: | $32,496 |
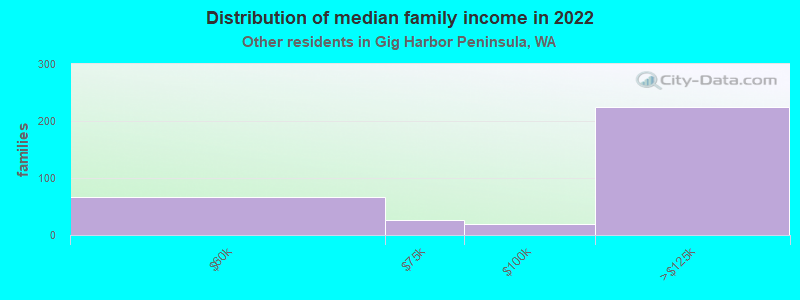
Income statistics for other residents
Number of households with income < $10k:| Gig Harbor Peninsula: | 5.0% (18) |
| Washington: | 5.3% (6,540) |
Number of households with income $10k - 20k:| Gig Harbor Peninsula: | 0.6% (2) |
| Washington: | 6.0% (7,385) |
Number of households with income $20k - 30k:| Gig Harbor Peninsula: | 10.4% (37) |
| Washington: | 7.5% (9,289) |
Number of households with income $30k - 40k:| Gig Harbor Peninsula: | 6.7% (24) |
| Washington: | 8.9% (11,015) |
Number of households with income $40k - 50k:| Gig Harbor Peninsula: | 13.7% (49) |
| State: | 7.6% (9,399) |
Number of households with income $50k - 60k:| Gig Harbor Peninsula: | 12.3% (44) |
| State: | 7.2% (8,867) |
Number of households with income $60k - 75k:| Gig Harbor Peninsula: | 4.5% (16) |
| State: | 10.5% (13,032) |
Number of households with income $75k - 100k:| Gig Harbor Peninsula: | 6.7% (24) |
| Washington: | 14.6% (18,007) |
Number of households with income $100k - 125k:| Gig Harbor Peninsula: | 16.2% (58) |
| State: | 12.2% (15,128) |
Number of households with income $125k - 150k:| Gig Harbor Peninsula: | 3.9% (14) |
| State: | 5.6% (6,950) |
Number of households with income $150k - 200k:| Gig Harbor Peninsula: | 11.5% (41) |
| Washington: | 7.1% (8,749) |
Number of households with income > $200k:| Gig Harbor Peninsula: | 8.4% (30) |
| Washington: | 7.5% (9,208) |
Aggregate household income in Gig Harbor Peninsula in 2022: $34,841,304
Median family income in Gig Harbor Peninsula in 2022:| Gig Harbor Peninsula: | $162,254 |
| State: | $72,588 |
Number of families with income $50k - 60k:| Gig Harbor Peninsula: | 19.4% (66) |
| Washington: | 7.7% (7,357) |
Number of families with income $60k - 75k:| Gig Harbor Peninsula: | 8.0% (27) |
| Washington: | 10.3% (9,864) |
Number of families with income $75k - 100k:| Gig Harbor Peninsula: | 5.9% (20) |
| State: | 14.5% (13,800) |
Number of families with income $100k - 125k:| Gig Harbor Peninsula: | 66.7% (225) |
| State: | 12.9% (12,298) |
Median non-family income in Gig Harbor Peninsula in 2022:| Gig Harbor Peninsula: | $123,370 |
| State: | $44,777 |
Change in median non-family income between 2000 and 2022:| Gig Harbor Peninsula, Washington: | +123.2% |
| Washington: | +84.2% |
Median per capita income in Gig Harbor Peninsula in 2022:| Gig Harbor Peninsula: | $53,574 |
| State: | $27,542 |