Essex, Connecticut (CT) income map, earnings map, and wages data
The median household income in Essex, CT in 2022 was $112,943, which was 21.7% greater than the median annual income of $88,429 across the entire state of Connecticut. Compared to the median income of $66,746 in 2000 this represents an increase of 40.9%. The per capita income in 2022 was $78,304, which means an increase of 45.3% compared to 2000 when it was $42,806.
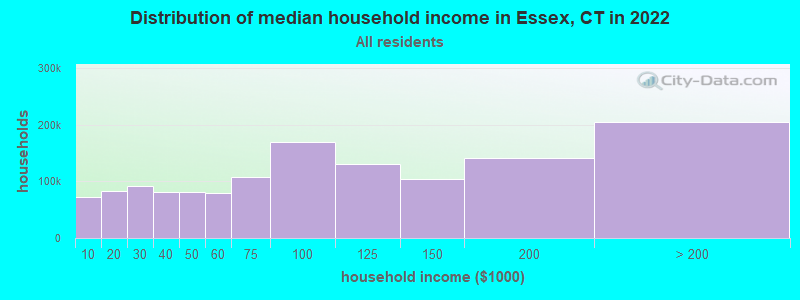
Income statistics for all residents
Median household income in Essex, CT in 2022:| Essex: | $112,943 |
| State: | $88,429 |
Change in median household income between 2000 and 2022:| Essex, Connecticut: | +69.2% |
| State: | +64.0% |
Number of households with income < $10k:| Essex: | 5.2% (46,004) |
| Connecticut: | 5.1% (72,746) |
Number of households with income $10k - 20k:| Essex: | 5.8% (51,876) |
| State: | 5.7% (81,643) |
Number of households with income $20k - 30k:| Essex: | 6.6% (58,719) |
| State: | 6.5% (92,844) |
Number of households with income $30k - 40k:| Essex: | 5.9% (52,697) |
| State: | 5.9% (83,934) |
Number of households with income $40k - 50k:| Essex: | 5.9% (52,358) |
| State: | 5.8% (83,025) |
Number of households with income $50k - 60k:| Essex: | 5.8% (51,341) |
| State: | 5.7% (81,788) |
Number of households with income $60k - 75k:| Essex: | 8.1% (71,935) |
| Connecticut: | 8.1% (115,651) |
Number of households with income $75k - 100k:| Essex: | 12.6% (112,346) |
| Connecticut: | 12.6% (180,173) |
Number of households with income $100k - 125k:| Essex: | 9.8% (87,461) |
| Connecticut: | 9.9% (141,231) |
Number of households with income $125k - 150k:| Essex: | 7.8% (69,846) |
| State: | 7.9% (112,826) |
Number of households with income $150k - 200k:| Essex: | 10.7% (95,543) |
| Connecticut: | 10.8% (154,641) |
Number of households with income > $200k:| Essex: | 16.0% (142,736) |
| State: | 16.3% (233,133) |
Aggregate household income in Essex in 2022: $11,863,111,309
Median family income in Essex in 2022:| Essex: | $158,753 |
| State: | $115,183 |
Median non-family income in Essex in 2022:| Essex: | $59,021 |
| Connecticut: | $50,964 |
Change in median non-family income between 2000 and 2022:| Essex, Connecticut: | +71.5% |
| State: | +65.1% |
Median per capita income in Essex in 2022:| Essex: | $78,305 |
| Connecticut: | $51,581 |
Change in median per capita income between 2000 and 2022:| Essex, Connecticut: | +82.9% |
| State: | +79.3% |
Income statistics for White residents
Median household income in Essex, CT in 2022:| Essex: | $115,524 |
| State: | $96,890 |
Change in median household income between 2000 and 2022:| Essex, Connecticut: | +69.4% |
| State: | +68.5% |
Number of households with income < $10k:| Essex: | 4.2% (25,268) |
| State: | 4.2% (42,265) |
Number of households with income $10k - 20k:| Essex: | 4.9% (29,050) |
| State: | 4.8% (48,323) |
Number of households with income $20k - 30k:| Essex: | 5.8% (34,548) |
| State: | 5.7% (57,716) |
Number of households with income $30k - 40k:| Essex: | 5.4% (31,979) |
| Connecticut: | 5.3% (53,827) |
Number of households with income $40k - 50k:| Essex: | 5.3% (31,847) |
| State: | 5.3% (53,301) |
Number of households with income $50k - 60k:| Essex: | 5.6% (33,143) |
| State: | 5.5% (55,690) |
Number of households with income $60k - 75k:| Essex: | 7.9% (47,364) |
| State: | 8.0% (80,329) |
Number of households with income $75k - 100k:| Essex: | 12.7% (75,894) |
| State: | 12.7% (128,070) |
Number of households with income $100k - 125k:| Essex: | 10.0% (59,595) |
| State: | 10.0% (101,210) |
Number of households with income $125k - 150k:| Essex: | 8.0% (47,845) |
| State: | 8.0% (81,250) |
Number of households with income $150k - 200k:| Essex: | 11.8% (70,351) |
| Connecticut: | 11.8% (119,527) |
Number of households with income > $200k:| Essex: | 18.4% (110,131) |
| Connecticut: | 18.6% (187,875) |
Aggregate household income in Essex in 2022: $9,002,178,662
Median family income in Essex in 2022:| Essex: | $162,917 |
| State: | $128,955 |
Number of families with income $10k - 20k:| Essex: | 0.9% (20) |
| Connecticut: | 1.8% (11,289) |
Number of families with income $20k - 30k:| Essex: | 0.8% (18) |
| State: | 3.0% (18,506) |
Number of families with income $30k - 40k:| Essex: | 1.9% (42) |
| State: | 2.9% (18,160) |
Number of families with income $40k - 50k:| Essex: | 1.8% (39) |
| State: | 3.9% (24,550) |
Number of families with income $50k - 60k:| Essex: | 2.5% (55) |
| State: | 4.3% (26,723) |
Number of families with income $60k - 75k:| Essex: | 4.5% (99) |
| State: | 7.1% (44,075) |
Number of families with income $75k - 100k:| Essex: | 9.1% (202) |
| Connecticut: | 12.5% (77,679) |
Number of families with income $100k - 125k:| Essex: | 9.1% (201) |
| State: | 11.1% (69,086) |
Number of families with income $125k - 150k:| Essex: | 9.1% (200) |
| State: | 9.6% (59,616) |
Number of families with income $150k - 200k:| Essex: | 20.8% (460) |
| State: | 15.7% (97,890) |
Number of families with income > $200k:| Essex: | 39.5% (874) |
| State: | 26.3% (163,417) |
Median non-family income in Essex in 2022:| Essex: | $65,045 |
| State: | $54,067 |
Change in median non-family income between 2000 and 2022:| Essex, Connecticut: | +73.7% |
| State: | +68.7% |
Median per capita income in Essex in 2022:| Essex: | $83,169 |
| State: | $59,916 |
Change in median per capita income between 2000 and 2022:| Essex, Connecticut: | +92.1% |
| Connecticut: | +90.2% |
Income statistics for Black or African American residents
Median household income in Essex, CT in 2022:| Essex: | $19,988 |
| State: | $61,803 |
Change in median household income between 2000 and 2022:| Essex, Connecticut: | +60.9% |
| State: | +76.1% |
Number of households with income < $10k:| Essex: | 6.8% (3,360) |
| State: | 6.8% (9,494) |
Number of households with income $10k - 20k:| Essex: | 7.9% (3,894) |
| State: | 7.9% (11,003) |
Number of households with income $20k - 30k:| Essex: | 10.8% (5,324) |
| State: | 10.8% (15,045) |
Number of households with income $30k - 40k:| Essex: | 8.2% (4,070) |
| State: | 8.2% (11,501) |
Number of households with income $40k - 50k:| Essex: | 7.4% (3,686) |
| Connecticut: | 7.4% (10,416) |
Number of households with income $50k - 60k:| Essex: | 7.5% (3,728) |
| State: | 7.5% (10,534) |
Number of households with income $60k - 75k:| Essex: | 8.0% (3,979) |
| State: | 8.0% (11,244) |
Number of households with income $75k - 100k:| Essex: | 9.6% (4,731) |
| State: | 9.6% (13,370) |
Number of households with income $100k - 125k:| Essex: | 10.2% (5,040) |
| State: | 10.2% (14,244) |
Number of households with income $125k - 150k:| Essex: | 8.0% (3,980) |
| State: | 8.0% (11,246) |
Number of households with income $150k - 200k:| Essex: | 7.7% (3,796) |
| Connecticut: | 7.7% (10,727) |
Number of households with income > $200k:| Essex: | 7.9% (3,923) |
| State: | 7.9% (11,086) |
Aggregate household income in Essex in 2022: $3,083,205
Median non-family income in Essex in 2022:| Essex: | $21,984 |
| Connecticut: | $38,608 |
Change in median non-family income between 2000 and 2022:| Essex, Connecticut: | +77.0% |
| Connecticut: | +77.0% |
Median per capita income in Essex in 2022:| Essex: | $34,457 |
| State: | $36,289 |
Change in median per capita income between 2000 and 2022:| Essex, Connecticut: | +115.2% |
| Connecticut: | +117.5% |
Income statistics for Asian residents
Median household income in Essex, CT in 2022:| Essex: | $18,383 |
| State: | $110,568 |
Change in median household income between 2000 and 2022:| Essex, Connecticut: | +110.1% |
| State: | +79.5% |
Number of households with income < $10k:| Essex: | 7.1% (603) |
| State: | 7.1% (4,245) |
Number of households with income $10k - 20k:| Essex: | 3.5% (297) |
| State: | 3.5% (2,087) |
Number of households with income $20k - 30k:| Essex: | 4.1% (350) |
| State: | 4.1% (2,464) |
Number of households with income $30k - 40k:| Essex: | 4.1% (352) |
| State: | 4.1% (2,478) |
Number of households with income $40k - 50k:| Essex: | 3.3% (281) |
| State: | 3.3% (1,983) |
Number of households with income $50k - 60k:| Essex: | 3.9% (331) |
| State: | 3.9% (2,328) |
Number of households with income $60k - 75k:| Essex: | 7.0% (601) |
| State: | 7.0% (4,228) |
Number of households with income $75k - 100k:| Essex: | 11.5% (982) |
| Connecticut: | 11.5% (6,911) |
Number of households with income $100k - 125k:| Essex: | 10.2% (870) |
| State: | 10.2% (6,127) |
Number of households with income $125k - 150k:| Essex: | 8.5% (722) |
| State: | 8.5% (5,079) |
Number of households with income $150k - 200k:| Essex: | 12.4% (1,056) |
| State: | 12.4% (7,434) |
Number of households with income > $200k:| Essex: | 24.4% (2,083) |
| State: | 24.4% (14,661) |
Aggregate household income in Essex in 2022: $603,906
Median non-family income in Essex in 2022:| Essex: | $21,751 |
| State: | $63,785 |
Change in median non-family income between 2000 and 2022:| Essex, Connecticut: | +148.6% |
| State: | +77.9% |
Median per capita income in Essex in 2022:| Essex: | $59,144 |
| State: | $55,295 |
Change in median per capita income between 2000 and 2022:| Essex, Connecticut: | +103.6% |
| State: | +97.8% |
Income statistics for Hispanic or Latino residents
Number of households with income < $10k:| Essex: | 8.7% (50,470) |
| State: | 8.7% (18,584) |
Number of households with income $10k - 20k:| Essex: | 9.1% (52,238) |
| State: | 9.1% (19,235) |
Number of households with income $20k - 30k:| Essex: | 8.9% (51,570) |
| State: | 8.9% (18,989) |
Number of households with income $30k - 40k:| Essex: | 7.5% (43,362) |
| State: | 7.5% (15,967) |
Number of households with income $40k - 50k:| Essex: | 8.7% (50,149) |
| State: | 8.7% (18,466) |
Number of households with income $50k - 60k:| Essex: | 6.9% (39,938) |
| State: | 6.9% (14,706) |
Number of households with income $60k - 75k:| Essex: | 8.9% (51,295) |
| Connecticut: | 8.9% (18,888) |
Number of households with income $75k - 100k:| Essex: | 13.5% (77,858) |
| State: | 13.5% (28,669) |
Number of households with income $100k - 125k:| Essex: | 8.2% (47,347) |
| State: | 8.2% (17,434) |
Number of households with income $125k - 150k:| Essex: | 6.5% (37,347) |
| State: | 6.5% (13,752) |
Number of households with income $150k - 200k:| Essex: | 6.6% (38,330) |
| State: | 6.6% (14,114) |
Number of households with income > $200k:| Essex: | 6.4% (37,016) |
| State: | 6.4% (13,630) |
Median per capita income in Essex in 2022:| Essex: | $64,268 |
| State: | $28,507 |
Change in median per capita income between 2000 and 2022:| Essex, Connecticut: | +80.3% |
| State: | +117.2% |
Income statistics for American Indian and Alaska Native residents
Median household income in Essex, CT in 2022:| Essex: | $23,984 |
| State: | $41,848 |
Change in median household income between 2000 and 2022:| Essex, Connecticut: | +12.9% |
| State: | +12.9% |
Number of households with income < $10k:| Essex: | 8.4% (60,426) |
| Connecticut: | 10.2% (340) |
Number of households with income $10k - 20k:| Essex: | 9.4% (67,434) |
| State: | 8.5% (283) |
Number of households with income $20k - 30k:| Essex: | 8.5% (60,994) |
| State: | 9.4% (314) |
Number of households with income $30k - 40k:| Essex: | 9.1% (65,348) |
| State: | 10.1% (337) |
Number of households with income $40k - 50k:| Essex: | 8.3% (59,941) |
| Connecticut: | 13.4% (447) |
Number of households with income $50k - 60k:| Essex: | 7.8% (56,520) |
| State: | 3.1% (104) |
Number of households with income $60k - 75k:| Essex: | 9.8% (70,450) |
| State: | 5.6% (188) |
Number of households with income $75k - 100k:| Essex: | 12.6% (90,939) |
| State: | 13.4% (447) |
Number of households with income $100k - 125k:| Essex: | 9.4% (68,004) |
| Connecticut: | 9.5% (317) |
Number of households with income $125k - 150k:| Essex: | 5.6% (40,714) |
| State: | 3.9% (131) |
Number of households with income $150k - 200k:| Essex: | 6.0% (42,920) |
| Connecticut: | 6.3% (212) |
Number of households with income > $200k:| Essex: | 5.2% (37,150) |
| State: | 6.8% (228) |
Aggregate household income in Essex in 2022: $470,032
Median non-family income in Essex in 2022:| Essex: | $47,830 |
| State: | $40,310 |
Change in median non-family income between 2000 and 2022:| Essex, Connecticut: | +125.1% |
| State: | +125.1% |
Median per capita income in Essex in 2022:| Essex: | $29,895 |
| State: | $25,355 |
Change in median per capita income between 2000 and 2022:| Essex, Connecticut: | +45.9% |
| Connecticut: | +39.4% |
Income statistics for Multirace residents
Number of households with income < $10k:| Essex: | 6.0% (2,936) |
| State: | 6.0% (7,457) |
Number of households with income $10k - 20k:| Essex: | 8.1% (3,992) |
| State: | 8.1% (10,139) |
Number of households with income $20k - 30k:| Essex: | 7.0% (3,426) |
| Connecticut: | 7.0% (8,702) |
Number of households with income $30k - 40k:| Essex: | 6.9% (3,364) |
| Connecticut: | 6.9% (8,546) |
Number of households with income $40k - 50k:| Essex: | 7.0% (3,430) |
| Connecticut: | 7.0% (8,712) |
Number of households with income $50k - 60k:| Essex: | 5.9% (2,886) |
| State: | 5.9% (7,331) |
Number of households with income $60k - 75k:| Essex: | 8.5% (4,186) |
| State: | 8.5% (10,634) |
Number of households with income $75k - 100k:| Essex: | 14.1% (6,929) |
| Connecticut: | 14.1% (17,600) |
Number of households with income $100k - 125k:| Essex: | 9.9% (4,875) |
| State: | 9.9% (12,383) |
Number of households with income $125k - 150k:| Essex: | 7.2% (3,512) |
| Connecticut: | 7.2% (8,921) |
Number of households with income $150k - 200k:| Essex: | 8.8% (4,300) |
| State: | 8.8% (10,922) |
Number of households with income > $200k:| Essex: | 10.6% (5,215) |
| Connecticut: | 10.6% (13,247) |
Median per capita income in Essex in 2022:| Essex: | $11,618 |
| State: | $32,794 |
Change in median per capita income between 2000 and 2022:| Essex, Connecticut: | +95.5% |
| State: | +117.2% |