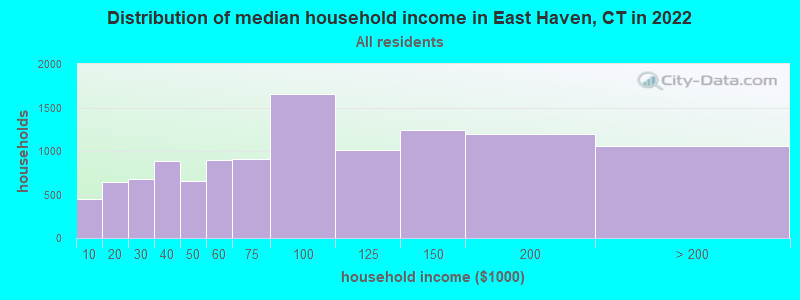
The median household income in East Haven, CT in 2022 was $81,837, which was 8.1% less than the median annual income of $88,429 across the entire state of Connecticut. Compared to the median income of $47,930 in 2000 this represents an increase of 41.4%. The per capita income in 2022 was $41,036, which means an increase of 45.4% compared to 2000 when it was $22,396.
Whole page based on the data from 2000 / 2022 when the population of East Haven, Connecticut was 28,189 / 27,986
Income statistics for all residents
Median household income in East Haven, CT in 2022:
East Haven:
$81,838
State:
$88,429
Change in median household income between 2000 and 2022:
East Haven, Connecticut:
+70.7%
State:
+64.0%
Number of households with income < $10k:
East Haven:
4.0% (446)
Connecticut:
5.1% (72,746)
Number of households with income $10k - 20k:
East Haven:
5.7% (639)
State:
5.7% (81,643)
Number of households with income $20k - 30k:
East Haven:
6.1% (683)
State:
6.5% (92,844)
Number of households with income $30k - 40k:
East Haven:
7.8% (880)
State:
5.9% (83,934)
Number of households with income $40k - 50k:
East Haven:
5.9% (660)
Connecticut:
5.8% (83,025)
Number of households with income $50k - 60k:
East Haven:
8.0% (901)
State:
5.7% (81,788)
Number of households with income $60k - 75k:
East Haven:
8.1% (910)
State:
8.1% (115,651)
Number of households with income $75k - 100k:
East Haven:
14.6% (1,651)
State:
12.6% (180,173)
Number of households with income $100k - 125k:
East Haven:
9.0% (1,013)
State:
9.9% (141,231)
Number of households with income $125k - 150k:
East Haven:
11.0% (1,242)
State:
7.9% (112,826)
Number of households with income $150k - 200k:
East Haven:
10.6% (1,198)
State:
10.8% (154,641)
Number of households with income > $200k:
East Haven:
9.4% (1,055)
Connecticut:
16.3% (233,133)
Aggregate household income in East Haven in 2022: $1,102,297,097
Median family income in East Haven in 2022:
East Haven:
$104,498
Connecticut:
$115,183
Number of families with income < $10k:
East Haven:
3.5% (246)
State:
2.6% (23,251)
Number of families with income $10k - 20k:
East Haven:
2.1% (149)
State:
2.8% (25,184)
Number of families with income $20k - 30k:
East Haven:
2.1% (144)
State:
4.1% (36,835)
Number of families with income $30k - 40k:
East Haven:
4.6% (318)
State:
4.2% (38,052)
Number of families with income $40k - 50k:
East Haven:
5.9% (412)
State:
4.8% (43,104)
Number of families with income $50k - 60k:
East Haven:
5.4% (376)
State:
4.8% (43,284)
Number of families with income $60k - 75k:
East Haven:
9.1% (636)
State:
7.4% (66,521)
Number of families with income $75k - 100k:
East Haven:
14.8% (1,033)
Connecticut:
12.9% (116,232)
Number of families with income $100k - 125k:
East Haven:
12.3% (856)
State:
10.6% (95,504)
Number of families with income $125k - 150k:
East Haven:
14.6% (1,015)
Connecticut:
9.5% (86,149)
Number of families with income $150k - 200k:
East Haven:
11.6% (811)
State:
14.0% (125,908)
Number of families with income > $200k:
East Haven:
14.0% (978)
State:
22.4% (202,515)
Median non-family income in East Haven in 2022:
East Haven:
$46,408
Connecticut:
$50,964
Change in median non-family income between 2000 and 2022:
East Haven, Connecticut:
+75.8%
State:
+65.1%
Median per capita income in East Haven in 2022:
East Haven:
$41,037
State:
$51,581
Change in median per capita income between 2000 and 2022:
East Haven, Connecticut:
+83.2%
State:
+79.3%
Income statistics for White residents
Median household income in East Haven, CT in 2022:
East Haven:
$83,811
Connecticut:
$96,890
Change in median household income between 2000 and 2022:
East Haven, Connecticut:
+74.2%
State:
+68.5%
Number of households with income < $10k:
East Haven:
3.8% (332)
State:
4.2% (42,265)
Number of households with income $10k - 20k:
East Haven:
6.4% (569)
State:
4.8% (48,323)
Number of households with income $20k - 30k:
East Haven:
5.3% (471)
State:
5.7% (57,716)
Number of households with income $30k - 40k:
East Haven:
8.0% (705)
State:
5.3% (53,827)
Number of households with income $40k - 50k:
East Haven:
6.2% (546)
Connecticut:
5.3% (53,301)
Number of households with income $50k - 60k:
East Haven:
5.8% (516)
Connecticut:
5.5% (55,690)
Number of households with income $60k - 75k:
East Haven:
8.2% (729)
Connecticut:
8.0% (80,329)
Number of households with income $75k - 100k:
East Haven:
15.2% (1,340)
State:
12.7% (128,070)
Number of households with income $100k - 125k:
East Haven:
10.1% (891)
Connecticut:
10.0% (101,210)
Number of households with income $125k - 150k:
East Haven:
9.5% (842)
State:
8.0% (81,250)
Number of households with income $150k - 200k:
East Haven:
11.7% (1,031)
State:
11.8% (119,527)
Number of households with income > $200k:
East Haven:
9.8% (868)
Connecticut:
18.6% (187,875)
Aggregate household income in East Haven in 2022: $871,759,972
Median family income in East Haven in 2022:
East Haven:
$107,326
State:
$128,955
Number of families with income < $10k:
East Haven:
2.7% (142)
Connecticut:
1.9% (11,537)
Number of families with income $10k - 20k:
East Haven:
1.9% (98)
State:
1.8% (11,289)
Number of families with income $20k - 30k:
East Haven:
1.7% (91)
State:
3.0% (18,506)
Number of families with income $30k - 40k:
East Haven:
4.3% (227)
State:
2.9% (18,160)
Number of families with income $40k - 50k:
East Haven:
5.6% (294)
State:
3.9% (24,550)
Number of families with income $50k - 60k:
East Haven:
4.1% (215)
State:
4.3% (26,723)
Number of families with income $60k - 75k:
East Haven:
9.5% (496)
State:
7.1% (44,075)
Number of families with income $75k - 100k:
East Haven:
15.4% (804)
Connecticut:
12.5% (77,679)
Number of families with income $100k - 125k:
East Haven:
14.5% (758)
State:
11.1% (69,086)
Number of families with income $125k - 150k:
East Haven:
11.9% (622)
State:
9.6% (59,616)
Number of families with income $150k - 200k:
East Haven:
13.2% (689)
State:
15.7% (97,890)
Number of families with income > $200k:
East Haven:
15.2% (793)
State:
26.3% (163,417)
Median non-family income in East Haven in 2022:
East Haven:
$44,160
State:
$54,067
Change in median non-family income between 2000 and 2022:
East Haven, Connecticut:
+66.8%
State:
+68.7%
Median per capita income in East Haven in 2022:
East Haven:
$43,854
Connecticut:
$59,916
Change in median per capita income between 2000 and 2022:
East Haven, Connecticut:
+92.9%
Connecticut:
+90.2%
Income statistics for Black or African American residents
Number of households with income < $10k:
East Haven:
5.2% (31)
State:
6.8% (9,494)
Number of households with income $10k - 20k:
East Haven:
2.7% (16)
Connecticut:
7.9% (11,003)
Number of households with income $20k - 30k:
East Haven:
15.3% (92)
State:
10.8% (15,045)
Number of households with income $30k - 40k:
East Haven:
4.8% (29)
State:
8.2% (11,501)
Number of households with income $40k - 50k:
East Haven:
3.5% (21)
State:
7.4% (10,416)
Number of households with income $50k - 60k:
East Haven:
0.0% (0)
State:
7.5% (10,534)
Number of households with income $60k - 75k:
East Haven:
15.2% (91)
State:
8.0% (11,244)
Number of households with income $75k - 100k:
East Haven:
1.7% (10)
Connecticut:
9.6% (13,370)
Number of households with income $100k - 125k:
East Haven:
10.5% (63)
State:
10.2% (14,244)
Number of households with income $125k - 150k:
East Haven:
29.2% (175)
State:
8.0% (11,246)
Number of households with income $150k - 200k:
East Haven:
4.3% (26)
State:
7.7% (10,727)
Number of households with income > $200k:
East Haven:
7.7% (46)
State:
7.9% (11,086)
Aggregate household income in East Haven in 2022: $57,037,711
Median family income in East Haven in 2022:
East Haven:
$135,440
State:
$87,228
Number of families with income < $10k:
East Haven:
5.3% (24)
State:
3.8% (3,184)
Number of families with income $30k - 40k:
East Haven:
5.1% (23)
State:
7.7% (6,445)
Number of families with income $40k - 50k:
East Haven:
1.1% (5)
Connecticut:
6.6% (5,531)
Number of families with income $60k - 75k:
East Haven:
18.4% (82)
State:
8.2% (6,861)
Number of families with income $100k - 125k:
East Haven:
13.1% (59)
State:
11.4% (9,482)
Number of families with income $125k - 150k:
East Haven:
40.8% (183)
State:
11.2% (9,356)
Number of families with income $150k - 200k:
East Haven:
6.0% (27)
State:
11.4% (9,497)
Number of families with income > $200k:
East Haven:
10.3% (46)
State:
10.8% (9,057)
Median non-family income in East Haven in 2022:
East Haven:
$24,380
State:
$38,608
Change in median non-family income between 2000 and 2022:
East Haven, Connecticut:
+1.5%
Connecticut:
+77.0%
Median per capita income in East Haven in 2022:
East Haven:
$41,383
State:
$36,289
Change in median per capita income between 2000 and 2022:
East Haven, Connecticut:
+121.5%
State:
+117.5%
Income statistics for Asian residents
Median household income in East Haven, CT in 2022:
East Haven:
$129,522
State:
$110,568
Number of households with income < $10k:
East Haven:
3.4% (6)
State:
7.1% (4,245)
Number of households with income $10k - 20k:
East Haven:
9.0% (16)
State:
3.5% (2,087)
Number of households with income $20k - 30k:
East Haven:
14.0% (25)
Connecticut:
4.1% (2,464)
Number of households with income $30k - 40k:
East Haven:
4.5% (8)
State:
4.1% (2,478)
Number of households with income $40k - 50k:
East Haven:
1.1% (2)
Connecticut:
3.3% (1,983)
Number of households with income $50k - 60k:
East Haven:
3.9% (7)
Connecticut:
3.9% (2,328)
Number of households with income $60k - 75k:
East Haven:
1.1% (2)
State:
7.0% (4,228)
Number of households with income $75k - 100k:
East Haven:
2.8% (5)
Connecticut:
11.5% (6,911)
Number of households with income $100k - 125k:
East Haven:
0.0% (0)
State:
10.2% (6,127)
Number of households with income $125k - 150k:
East Haven:
20.8% (37)
State:
8.5% (5,079)
Number of households with income $150k - 200k:
East Haven:
9.6% (17)
State:
12.4% (7,434)
Number of households with income > $200k:
East Haven:
29.8% (53)
State:
24.4% (14,661)
Aggregate household income in East Haven in 2022: $30,900,945
Median family income in East Haven in 2022:
East Haven:
$135,025
State:
$134,548
Number of families with income < $10k:
East Haven:
3.7% (6)
State:
4.3% (1,875)
Number of families with income $10k - 20k:
East Haven:
5.2% (8)
State:
1.6% (700)
Number of families with income $20k - 30k:
East Haven:
17.0% (28)
State:
3.8% (1,682)
Number of families with income $40k - 50k:
East Haven:
0.8% (1)
State:
2.0% (863)
Number of families with income $50k - 60k:
East Haven:
4.7% (8)
Connecticut:
3.7% (1,635)
Number of families with income $60k - 75k:
East Haven:
1.4% (2)
State:
6.0% (2,651)
Number of families with income $75k - 100k:
East Haven:
3.1% (5)
State:
11.0% (4,844)
Number of families with income $125k - 150k:
East Haven:
19.9% (32)
State:
8.2% (3,588)
Number of families with income $150k - 200k:
East Haven:
10.5% (17)
State:
14.2% (6,237)
Number of families with income > $200k:
East Haven:
33.8% (55)
State:
30.8% (13,522)
Median per capita income in East Haven in 2022:
East Haven:
$52,432
State:
$55,295
Income statistics for Hispanic or Latino residents
Median household income in East Haven, CT in 2022:
East Haven:
$68,279
State:
$60,275
Change in median household income between 2000 and 2022:
East Haven, Connecticut:
+41.0%
State:
+87.9%
Number of households with income < $10k:
East Haven:
6.6% (106)
State:
8.7% (18,584)
Number of households with income $10k - 20k:
East Haven:
2.1% (34)
State:
9.1% (19,235)
Number of households with income $20k - 30k:
East Haven:
2.8% (45)
State:
8.9% (18,989)
Number of households with income $30k - 40k:
East Haven:
6.1% (98)
State:
7.5% (15,967)
Number of households with income $40k - 50k:
East Haven:
3.2% (51)
State:
8.7% (18,466)
Number of households with income $50k - 60k:
East Haven:
20.9% (335)
State:
6.9% (14,706)
Number of households with income $60k - 75k:
East Haven:
10.9% (175)
Connecticut:
8.9% (18,888)
Number of households with income $75k - 100k:
East Haven:
16.9% (271)
State:
13.5% (28,669)
Number of households with income $100k - 125k:
East Haven:
1.0% (16)
State:
8.2% (17,434)
Number of households with income $125k - 150k:
East Haven:
14.5% (233)
State:
6.5% (13,752)
Number of households with income $150k - 200k:
East Haven:
9.4% (150)
State:
6.6% (14,114)
Number of households with income > $200k:
East Haven:
5.5% (88)
State:
6.4% (13,630)
Aggregate household income in East Haven in 2022: $139,287,496
Median family income in East Haven in 2022:
East Haven:
$85,065
State:
$68,336
Number of families with income < $10k:
East Haven:
8.3% (92)
State:
5.2% (7,456)
Number of families with income $10k - 20k:
East Haven:
1.8% (20)
State:
6.0% (8,616)
Number of families with income $20k - 30k:
East Haven:
1.2% (13)
State:
8.9% (12,680)
Number of families with income $30k - 40k:
East Haven:
3.9% (44)
Connecticut:
8.5% (12,090)
Number of families with income $40k - 50k:
East Haven:
5.2% (57)
State:
8.8% (12,624)
Number of families with income $50k - 60k:
East Haven:
16.1% (178)
State:
8.4% (11,924)
Number of families with income $60k - 75k:
East Haven:
10.3% (114)
State:
8.9% (12,677)
Number of families with income $75k - 100k:
East Haven:
15.9% (177)
Connecticut:
14.3% (20,457)
Number of families with income $100k - 125k:
East Haven:
6.2% (68)
State:
8.2% (11,720)
Number of families with income $125k - 150k:
East Haven:
18.5% (205)
State:
8.2% (11,729)
Number of families with income $150k - 200k:
East Haven:
5.0% (55)
State:
7.1% (10,096)
Number of families with income > $200k:
East Haven:
7.5% (83)
Connecticut:
7.4% (10,622)
Median non-family income in East Haven in 2022:
East Haven:
$57,126
State:
$36,714
Median per capita income in East Haven in 2022:
East Haven:
$30,223
Connecticut:
$28,507
Change in median per capita income between 2000 and 2022:
East Haven, Connecticut:
+88.8%
State:
+117.2%
Income statistics for American Indian and Alaska Native residents
Aggregate household income in East Haven in 2022: $1,393,788
Median per capita income in East Haven in 2022:
East Haven:
$33,228
State:
$25,355
Change in median per capita income between 2000 and 2022:
East Haven, Connecticut:
+85.3%
State:
+39.4%
Income statistics for Multirace residents
Median household income in East Haven, CT in 2022:
East Haven:
$56,991
State:
$77,277
Change in median household income between 2000 and 2022:
East Haven, Connecticut:
+30.9%
Connecticut:
+113.6%
Number of households with income < $10k:
East Haven:
13.5% (77)
State:
6.0% (7,457)
Number of households with income $10k - 20k:
East Haven:
0.0% (0)
State:
8.1% (10,139)
Number of households with income $20k - 30k:
East Haven:
5.3% (30)
Connecticut:
7.0% (8,702)
Number of households with income $30k - 40k:
East Haven:
13.2% (75)
Connecticut:
6.9% (8,546)
Number of households with income $40k - 50k:
East Haven:
3.9% (22)
Connecticut:
7.0% (8,712)
Number of households with income $50k - 60k:
East Haven:
27.2% (155)
State:
5.9% (7,331)
Number of households with income $60k - 75k:
East Haven:
1.9% (11)
State:
8.5% (10,634)
Number of households with income $75k - 100k:
East Haven:
11.6% (66)
Connecticut:
14.1% (17,600)
Number of households with income $100k - 125k:
East Haven:
0.0% (0)
State:
9.9% (12,383)
Number of households with income $125k - 150k:
East Haven:
0.0% (0)
Connecticut:
7.2% (8,921)
Number of households with income $150k - 200k:
East Haven:
14.9% (85)
State:
8.8% (10,922)
Number of households with income > $200k:
East Haven:
8.4% (48)
Connecticut:
10.6% (13,247)
Aggregate household income in East Haven in 2022: $54,079,981
Median family income in East Haven in 2022:
East Haven:
$51,622
State:
$84,255
Number of families with income < $10k:
East Haven:
19.4% (82)
State:
3.6% (3,027)
Number of families with income $20k - 30k:
East Haven:
1.7% (7)
State:
6.9% (5,812)
Number of families with income $40k - 50k:
East Haven:
26.3% (112)
State:
6.9% (5,792)
Number of families with income $50k - 60k:
East Haven:
20.2% (86)
State:
7.6% (6,420)
Number of families with income $60k - 75k:
East Haven:
2.2% (10)
State:
7.8% (6,550)
Number of families with income $75k - 100k:
East Haven:
4.8% (20)
State:
14.5% (12,236)
Number of families with income $150k - 200k:
East Haven:
13.8% (59)
Connecticut:
9.3% (7,818)
Number of families with income > $200k:
East Haven:
11.6% (49)
State:
13.7% (11,603)
Median per capita income in East Haven in 2022:
East Haven:
$35,756
State:
$32,794
Change in median per capita income between 2000 and 2022:
East Haven, Connecticut:
+73.9%
State:
+117.2%
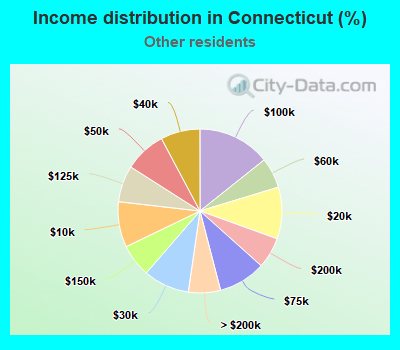
Income statistics for other residents
Median household income in East Haven, CT in 2022:
East Haven:
$68,951
State:
$59,588
Number of households with income < $10k:
East Haven:
0.0% (0)
State:
9.0% (8,596)
Number of households with income $10k - 20k:
East Haven:
3.9% (37)
State:
10.2% (9,773)
Number of households with income $20k - 30k:
East Haven:
4.1% (39)
State:
9.1% (8,691)
Number of households with income $30k - 40k:
East Haven:
5.0% (48)
State:
7.8% (7,447)
Number of households with income $40k - 50k:
East Haven:
2.4% (23)
State:
8.2% (7,860)
Number of households with income $50k - 60k:
East Haven:
25.1% (240)
State:
6.0% (5,757)
Number of households with income $60k - 75k:
East Haven:
3.9% (37)
State:
9.3% (8,942)
Number of households with income $75k - 100k:
East Haven:
25.9% (248)
State:
14.3% (13,700)
Number of households with income $100k - 125k:
East Haven:
0.0% (0)
Connecticut:
7.2% (6,906)
Number of households with income $125k - 150k:
East Haven:
22.0% (211)
Connecticut:
6.5% (6,215)
Number of households with income $150k - 200k:
East Haven:
3.2% (31)
State:
6.1% (5,865)
Number of households with income > $200k:
East Haven:
4.5% (43)
Connecticut:
6.3% (6,065)
Aggregate household income in East Haven in 2022: $88,230,119
Median family income in East Haven in 2022:
East Haven:
$99,836
State:
$67,610
Number of families with income < $10k:
East Haven:
1.3% (9)
Connecticut:
5.0% (3,311)
Number of families with income $10k - 20k:
East Haven:
3.9% (27)
State:
7.5% (4,961)
Number of families with income $20k - 30k:
East Haven:
0.9% (6)
State:
8.7% (5,752)
Number of families with income $30k - 40k:
East Haven:
4.4% (30)
State:
9.1% (5,996)
Number of families with income $40k - 50k:
East Haven:
3.3% (23)
State:
9.1% (6,039)
Number of families with income $50k - 60k:
East Haven:
13.8% (95)
State:
5.9% (3,868)
Number of families with income $60k - 75k:
East Haven:
2.4% (17)
State:
9.4% (6,232)
Number of families with income $75k - 100k:
East Haven:
28.8% (198)
State:
15.7% (10,362)
Number of families with income $125k - 150k:
East Haven:
32.8% (226)
Connecticut:
9.0% (5,971)
Number of families with income $150k - 200k:
East Haven:
2.4% (17)
State:
6.6% (4,339)
Number of families with income > $200k:
East Haven:
6.0% (41)
State:
7.1% (4,717)
Median non-family income in East Haven in 2022:
East Haven:
$69,343
State:
$34,285
Median per capita income in East Haven in 2022:
East Haven:
$29,380
State:
$29,353
Change in median per capita income between 2000 and 2022:
East Haven, Connecticut:
+70.5%
State:
+165.8%
Discuss East Haven, Connecticut (CT) on our hugely popular Connecticut forum.