District 7, Cresaptown/Bel Air, Maryland (MD) income map, earnings map, and wages data
The median household income in District 7, Cresaptown/Bel Air, MD in 2022 was $62,044, which was 53.1% less than the median annual income of $94,991 across the entire state of Maryland. Compared to the median income of $40,762 in 2000 this represents an increase of 34.3%. The per capita income in 2022 was $35,112, which means an increase of 42.9% compared to 2000 when it was $20,060.
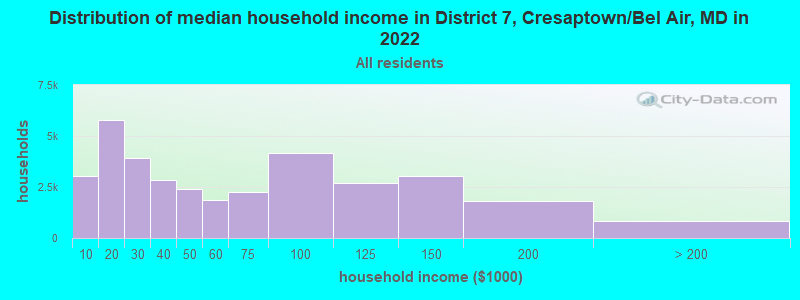
Income statistics for all residents
Median household income in District 7, Cresaptown/Bel Air, MD in 2022:| District 7, Cresaptown/Bel Air: | $62,044 |
| Maryland: | $94,991 |
Change in median household income between 2000 and 2022:| District 7, Cresaptown/Bel Air, Maryland: | +52.2% |
| State: | +79.7% |
Number of households with income < $10k:| District 7, Cresaptown/Bel Air: | 8.8% (3,058) |
| State: | 4.8% (114,450) |
Number of households with income $10k - 20k:| District 7, Cresaptown/Bel Air: | 16.6% (5,772) |
| State: | 5.0% (117,883) |
Number of households with income $20k - 30k:| District 7, Cresaptown/Bel Air: | 11.4% (3,942) |
| State: | 5.2% (123,350) |
Number of households with income $30k - 40k:| District 7, Cresaptown/Bel Air: | 8.2% (2,847) |
| State: | 5.6% (134,104) |
Number of households with income $40k - 50k:| District 7, Cresaptown/Bel Air: | 7.0% (2,417) |
| State: | 5.6% (132,932) |
Number of households with income $50k - 60k:| District 7, Cresaptown/Bel Air: | 5.4% (1,865) |
| State: | 5.6% (132,707) |
Number of households with income $60k - 75k:| District 7, Cresaptown/Bel Air: | 6.5% (2,269) |
| State: | 7.9% (188,335) |
Number of households with income $75k - 100k:| District 7, Cresaptown/Bel Air: | 12.0% (4,169) |
| State: | 12.5% (297,873) |
Number of households with income $100k - 125k:| District 7, Cresaptown/Bel Air: | 7.8% (2,693) |
| Maryland: | 10.5% (250,497) |
Number of households with income $125k - 150k:| District 7, Cresaptown/Bel Air: | 8.8% (3,042) |
| State: | 8.1% (193,208) |
Number of households with income $150k - 200k:| District 7, Cresaptown/Bel Air: | 5.2% (1,793) |
| State: | 11.6% (274,905) |
Number of households with income > $200k:| District 7, Cresaptown/Bel Air: | 2.4% (844) |
| State: | 17.5% (415,740) |
Aggregate household income in District 7, Cresaptown/Bel Air in 2022: $155,607,197
Median family income in District 7, Cresaptown/Bel Air in 2022:| District 7, Cresaptown/Bel Air: | $92,949 |
| State: | $117,294 |
Median non-family income in District 7, Cresaptown/Bel Air in 2022:| District 7, Cresaptown/Bel Air: | $31,569 |
| State: | $57,179 |
Change in median non-family income between 2000 and 2022:| District 7, Cresaptown/Bel Air, Maryland: | +47.3% |
| State: | +75.1% |
Median per capita income in District 7, Cresaptown/Bel Air in 2022:| District 7, Cresaptown/Bel Air: | $35,112 |
| State: | $49,236 |
Change in median per capita income between 2000 and 2022:| District 7, Cresaptown/Bel Air, Maryland: | +75.0% |
| State: | +92.2% |
Income statistics for White residents
Median household income in District 7, Cresaptown/Bel Air, MD in 2022:| District 7, Cresaptown/Bel Air: | $62,984 |
| State: | $107,160 |
Change in median household income between 2000 and 2022:| District 7, Cresaptown/Bel Air, Maryland: | +55.5% |
| State: | +85.3% |
Number of households with income < $10k:| District 7, Cresaptown/Bel Air: | 8.3% (2,644) |
| State: | 3.7% (47,387) |
Number of households with income $10k - 20k:| District 7, Cresaptown/Bel Air: | 16.3% (5,211) |
| State: | 4.1% (52,102) |
Number of households with income $20k - 30k:| District 7, Cresaptown/Bel Air: | 10.8% (3,446) |
| State: | 4.6% (58,758) |
Number of households with income $30k - 40k:| District 7, Cresaptown/Bel Air: | 8.6% (2,765) |
| State: | 4.7% (59,745) |
Number of households with income $40k - 50k:| District 7, Cresaptown/Bel Air: | 7.0% (2,236) |
| Maryland: | 5.0% (62,576) |
Number of households with income $50k - 60k:| District 7, Cresaptown/Bel Air: | 5.2% (1,663) |
| State: | 5.1% (64,484) |
Number of households with income $60k - 75k:| District 7, Cresaptown/Bel Air: | 7.0% (2,243) |
| State: | 7.7% (97,019) |
Number of households with income $75k - 100k:| District 7, Cresaptown/Bel Air: | 11.8% (3,770) |
| State: | 11.8% (149,205) |
Number of households with income $100k - 125k:| District 7, Cresaptown/Bel Air: | 8.3% (2,643) |
| State: | 10.6% (134,231) |
Number of households with income $125k - 150k:| District 7, Cresaptown/Bel Air: | 9.1% (2,902) |
| State: | 8.8% (111,081) |
Number of households with income $150k - 200k:| District 7, Cresaptown/Bel Air: | 5.4% (1,732) |
| State: | 12.9% (162,966) |
Number of households with income > $200k:| District 7, Cresaptown/Bel Air: | 2.3% (746) |
| State: | 20.9% (264,377) |
Aggregate household income in District 7, Cresaptown/Bel Air in 2022: $144,110,554
Median family income in District 7, Cresaptown/Bel Air in 2022:| District 7, Cresaptown/Bel Air: | $92,112 |
| State: | $134,708 |
Number of families with income < $10k:| District 7, Cresaptown/Bel Air: | 2.9% (33) |
| State: | 1.6% (13,064) |
Number of families with income $10k - 20k:| District 7, Cresaptown/Bel Air: | 2.1% (24) |
| Maryland: | 2.0% (16,048) |
Number of families with income $20k - 30k:| District 7, Cresaptown/Bel Air: | 4.3% (50) |
| State: | 2.2% (18,018) |
Number of families with income $30k - 40k:| District 7, Cresaptown/Bel Air: | 7.2% (82) |
| State: | 3.3% (26,886) |
Number of families with income $40k - 50k:| District 7, Cresaptown/Bel Air: | 7.8% (89) |
| State: | 3.6% (29,194) |
Number of families with income $50k - 60k:| District 7, Cresaptown/Bel Air: | 5.6% (65) |
| Maryland: | 4.1% (33,120) |
Number of families with income $60k - 75k:| District 7, Cresaptown/Bel Air: | 13.7% (157) |
| State: | 6.6% (53,501) |
Number of families with income $75k - 100k:| District 7, Cresaptown/Bel Air: | 29.5% (338) |
| State: | 11.3% (91,779) |
Number of families with income $100k - 125k:| District 7, Cresaptown/Bel Air: | 13.0% (149) |
| State: | 11.3% (91,483) |
Number of families with income $125k - 150k:| District 7, Cresaptown/Bel Air: | 12.0% (137) |
| Maryland: | 9.9% (80,832) |
Number of families with income > $200k:| District 7, Cresaptown/Bel Air: | 1.8% (21) |
| State: | 28.1% (228,324) |
Median non-family income in District 7, Cresaptown/Bel Air in 2022:| District 7, Cresaptown/Bel Air: | $32,241 |
| Maryland: | $61,991 |
Change in median non-family income between 2000 and 2022:| District 7, Cresaptown/Bel Air, Maryland: | +51.7% |
| State: | +76.8% |
Median per capita income in District 7, Cresaptown/Bel Air in 2022:| District 7, Cresaptown/Bel Air: | $34,390 |
| State: | $59,750 |
Change in median per capita income between 2000 and 2022:| District 7, Cresaptown/Bel Air, Maryland: | +91.9% |
| State: | +104.5% |
Income statistics for Black or African American residents
Median household income in District 7, Cresaptown/Bel Air, MD in 2022:| District 7, Cresaptown/Bel Air: | $20,083 |
| State: | $77,368 |
Change in median household income between 2000 and 2022:| District 7, Cresaptown/Bel Air, Maryland: | +106.6% |
| Maryland: | +85.7% |
Number of households with income < $10k:| District 7, Cresaptown/Bel Air: | 7.0% (5,846) |
| State: | 7.0% (50,093) |
Number of households with income $10k - 20k:| District 7, Cresaptown/Bel Air: | 7.2% (6,052) |
| State: | 7.2% (51,849) |
Number of households with income $20k - 30k:| District 7, Cresaptown/Bel Air: | 5.8% (4,845) |
| Maryland: | 5.8% (41,510) |
Number of households with income $30k - 40k:| District 7, Cresaptown/Bel Air: | 6.9% (5,772) |
| Maryland: | 6.9% (49,466) |
Number of households with income $40k - 50k:| District 7, Cresaptown/Bel Air: | 6.6% (5,550) |
| Maryland: | 6.6% (47,557) |
Number of households with income $50k - 60k:| District 7, Cresaptown/Bel Air: | 6.2% (5,229) |
| State: | 6.2% (44,818) |
Number of households with income $60k - 75k:| District 7, Cresaptown/Bel Air: | 8.6% (7,204) |
| State: | 8.6% (61,728) |
Number of households with income $75k - 100k:| District 7, Cresaptown/Bel Air: | 13.2% (11,100) |
| Maryland: | 13.2% (95,107) |
Number of households with income $100k - 125k:| District 7, Cresaptown/Bel Air: | 10.2% (8,587) |
| State: | 10.2% (73,579) |
Number of households with income $125k - 150k:| District 7, Cresaptown/Bel Air: | 7.2% (6,066) |
| Maryland: | 7.2% (51,970) |
Number of households with income $150k - 200k:| District 7, Cresaptown/Bel Air: | 9.4% (7,893) |
| State: | 9.4% (67,623) |
Number of households with income > $200k:| District 7, Cresaptown/Bel Air: | 11.7% (9,792) |
| Maryland: | 11.7% (83,862) |
Aggregate household income in District 7, Cresaptown/Bel Air in 2022: $6,038,450
Median family income in District 7, Cresaptown/Bel Air in 2022:| District 7, Cresaptown/Bel Air: | $19,667 |
| State: | $96,241 |
Median non-family income in District 7, Cresaptown/Bel Air in 2022:| District 7, Cresaptown/Bel Air: | $69,267 |
| State: | $49,944 |
Change in median non-family income between 2000 and 2022:| District 7, Cresaptown/Bel Air, Maryland: | +67.9% |
| State: | +71.8% |
Median per capita income in District 7, Cresaptown/Bel Air in 2022:| District 7, Cresaptown/Bel Air: | $10,299 |
| State: | $40,756 |
Income statistics for Asian residents
Median household income in District 7, Cresaptown/Bel Air, MD in 2022:| District 7, Cresaptown/Bel Air: | $209,183 |
| State: | $117,771 |
Change in median household income between 2000 and 2022:| District 7, Cresaptown/Bel Air, Maryland: | +94.9% |
| State: | +97.6% |
Number of households with income < $10k:| District 7, Cresaptown/Bel Air: | 4.6% (11,519) |
| Maryland: | 4.6% (6,395) |
Number of households with income $10k - 20k:| District 7, Cresaptown/Bel Air: | 3.6% (8,995) |
| State: | 3.6% (4,994) |
Number of households with income $20k - 30k:| District 7, Cresaptown/Bel Air: | 4.6% (11,527) |
| State: | 4.6% (6,399) |
Number of households with income $30k - 40k:| District 7, Cresaptown/Bel Air: | 3.4% (8,433) |
| State: | 3.4% (4,682) |
Number of households with income $40k - 50k:| District 7, Cresaptown/Bel Air: | 4.6% (11,496) |
| State: | 4.6% (6,382) |
Number of households with income $50k - 60k:| District 7, Cresaptown/Bel Air: | 4.6% (11,532) |
| State: | 4.6% (6,402) |
Number of households with income $60k - 75k:| District 7, Cresaptown/Bel Air: | 5.4% (13,376) |
| State: | 5.4% (7,426) |
Number of households with income $75k - 100k:| District 7, Cresaptown/Bel Air: | 11.1% (27,583) |
| State: | 11.1% (15,313) |
Number of households with income $100k - 125k:| District 7, Cresaptown/Bel Air: | 10.6% (26,370) |
| State: | 10.6% (14,640) |
Number of households with income $125k - 150k:| District 7, Cresaptown/Bel Air: | 8.3% (20,651) |
| State: | 8.3% (11,465) |
Number of households with income $150k - 200k:| District 7, Cresaptown/Bel Air: | 13.4% (33,305) |
| State: | 13.4% (18,490) |
Number of households with income > $200k:| District 7, Cresaptown/Bel Air: | 25.6% (63,723) |
| State: | 25.6% (35,377) |
Aggregate household income in District 7, Cresaptown/Bel Air in 2022: $11,252,190
Median family income in District 7, Cresaptown/Bel Air in 2022:| District 7, Cresaptown/Bel Air: | $229,722 |
| State: | $137,857 |
Number of families with income $75k - 100k:| District 7, Cresaptown/Bel Air: | 11.6% (17) |
| Maryland: | 10.9% (11,658) |
Number of families with income $100k - 125k:| District 7, Cresaptown/Bel Air: | 12.3% (18) |
| Maryland: | 10.6% (11,243) |
Number of families with income $150k - 200k:| District 7, Cresaptown/Bel Air: | 11.6% (17) |
| State: | 15.2% (16,182) |
Number of families with income > $200k:| District 7, Cresaptown/Bel Air: | 64.6% (94) |
| Maryland: | 30.3% (32,297) |
Median per capita income in District 7, Cresaptown/Bel Air in 2022:| District 7, Cresaptown/Bel Air: | $76,601 |
| State: | $53,546 |
Change in median per capita income between 2000 and 2022:| District 7, Cresaptown/Bel Air, Maryland: | +71.9% |
| Maryland: | +122.9% |
Income statistics for Hispanic or Latino residents
Median household income in District 7, Cresaptown/Bel Air, MD in 2022:| District 7, Cresaptown/Bel Air: | $108,596 |
| State: | $82,138 |
Change in median household income between 2000 and 2022:| District 7, Cresaptown/Bel Air, Maryland: | +84.8% |
| State: | +70.2% |
Number of households with income < $10k:| District 7, Cresaptown/Bel Air: | 3.7% (4,121) |
| State: | 3.7% (6,871) |
Number of households with income $10k - 20k:| District 7, Cresaptown/Bel Air: | 3.0% (3,345) |
| State: | 2.9% (5,465) |
Number of households with income $20k - 30k:| District 7, Cresaptown/Bel Air: | 6.0% (6,714) |
| State: | 5.9% (11,012) |
Number of households with income $30k - 40k:| District 7, Cresaptown/Bel Air: | 7.9% (8,920) |
| State: | 7.9% (14,668) |
Number of households with income $40k - 50k:| District 7, Cresaptown/Bel Air: | 7.6% (8,583) |
| State: | 7.6% (14,074) |
Number of households with income $50k - 60k:| District 7, Cresaptown/Bel Air: | 7.7% (8,623) |
| Maryland: | 7.6% (14,166) |
Number of households with income $60k - 75k:| District 7, Cresaptown/Bel Air: | 10.0% (11,222) |
| State: | 9.9% (18,486) |
Number of households with income $75k - 100k:| District 7, Cresaptown/Bel Air: | 16.2% (18,205) |
| State: | 16.1% (30,032) |
Number of households with income $100k - 125k:| District 7, Cresaptown/Bel Air: | 9.4% (10,555) |
| State: | 9.4% (17,432) |
Number of households with income $125k - 150k:| District 7, Cresaptown/Bel Air: | 7.5% (8,415) |
| State: | 7.5% (13,963) |
Number of households with income $150k - 200k:| District 7, Cresaptown/Bel Air: | 10.0% (11,301) |
| State: | 10.1% (18,750) |
Number of households with income > $200k:| District 7, Cresaptown/Bel Air: | 11.3% (12,681) |
| State: | 11.4% (21,133) |
Aggregate household income in District 7, Cresaptown/Bel Air in 2022: $4,798,284
Median per capita income in District 7, Cresaptown/Bel Air in 2022:| District 7, Cresaptown/Bel Air: | $13,256 |
| Maryland: | $29,024 |
Change in median per capita income between 2000 and 2022:| District 7, Cresaptown/Bel Air, Maryland: | +2.3% |
| Maryland: | +79.2% |
Income statistics for Multirace residents
Number of households with income < $10k:| District 7, Cresaptown/Bel Air: | 4.8% (2,070) |
| State: | 4.8% (6,469) |
Number of households with income $10k - 20k:| District 7, Cresaptown/Bel Air: | 3.3% (1,428) |
| State: | 3.3% (4,464) |
Number of households with income $20k - 30k:| District 7, Cresaptown/Bel Air: | 5.8% (2,502) |
| State: | 5.8% (7,826) |
Number of households with income $30k - 40k:| District 7, Cresaptown/Bel Air: | 8.1% (3,533) |
| State: | 8.1% (11,077) |
Number of households with income $40k - 50k:| District 7, Cresaptown/Bel Air: | 4.4% (1,888) |
| State: | 4.3% (5,895) |
Number of households with income $50k - 60k:| District 7, Cresaptown/Bel Air: | 3.9% (1,710) |
| Maryland: | 3.9% (5,346) |
Number of households with income $60k - 75k:| District 7, Cresaptown/Bel Air: | 6.7% (2,928) |
| State: | 6.7% (9,159) |
Number of households with income $75k - 100k:| District 7, Cresaptown/Bel Air: | 13.6% (5,880) |
| State: | 13.6% (18,420) |
Number of households with income $100k - 125k:| District 7, Cresaptown/Bel Air: | 12.9% (5,591) |
| State: | 12.9% (17,488) |
Number of households with income $125k - 150k:| District 7, Cresaptown/Bel Air: | 8.1% (3,520) |
| State: | 8.1% (11,039) |
Number of households with income $150k - 200k:| District 7, Cresaptown/Bel Air: | 11.5% (5,005) |
| State: | 11.5% (15,675) |
Number of households with income > $200k:| District 7, Cresaptown/Bel Air: | 16.9% (7,337) |
| Maryland: | 17.0% (23,059) |
Median per capita income in District 7, Cresaptown/Bel Air in 2022:| District 7, Cresaptown/Bel Air: | $15,297 |
| Maryland: | $35,630 |
Change in median per capita income between 2000 and 2022:| District 7, Cresaptown/Bel Air, Maryland: | +51.1% |
| Maryland: | +125.1% |