District 5, Queenstown, Maryland (MD) income map, earnings map, and wages data
The median household income in District 5, Queenstown, MD in 2022 was $114,412, which was 17.0% greater than the median annual income of $94,991 across the entire state of Maryland. Compared to the median income of $61,402 in 2000 this represents an increase of 46.3%. The per capita income in 2022 was $60,761, which means an increase of 49.4% compared to 2000 when it was $30,748.
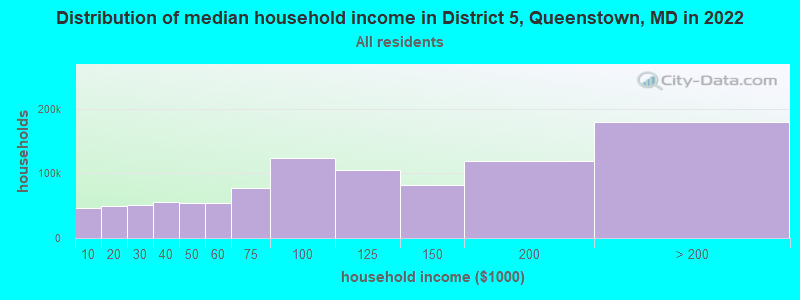
Income statistics for all residents
Median household income in District 5, Queenstown, MD in 2022:| District 5, Queenstown: | $114,413 |
| State: | $94,991 |
Change in median household income between 2000 and 2022:| District 5, Queenstown, Maryland: | +86.3% |
| Maryland: | +79.7% |
Number of households with income < $10k:| District 5, Queenstown: | 4.8% (66,655) |
| State: | 4.8% (114,450) |
Number of households with income $10k - 20k:| District 5, Queenstown: | 5.0% (68,531) |
| State: | 5.0% (117,883) |
Number of households with income $20k - 30k:| District 5, Queenstown: | 5.2% (71,697) |
| State: | 5.2% (123,350) |
Number of households with income $30k - 40k:| District 5, Queenstown: | 5.6% (77,934) |
| Maryland: | 5.6% (134,104) |
Number of households with income $40k - 50k:| District 5, Queenstown: | 5.6% (77,330) |
| State: | 5.6% (132,932) |
Number of households with income $50k - 60k:| District 5, Queenstown: | 5.6% (77,176) |
| Maryland: | 5.6% (132,707) |
Number of households with income $60k - 75k:| District 5, Queenstown: | 7.9% (109,509) |
| Maryland: | 7.9% (188,335) |
Number of households with income $75k - 100k:| District 5, Queenstown: | 12.5% (173,073) |
| Maryland: | 12.5% (297,873) |
Number of households with income $100k - 125k:| District 5, Queenstown: | 10.5% (145,444) |
| State: | 10.5% (250,497) |
Number of households with income $125k - 150k:| District 5, Queenstown: | 8.1% (112,180) |
| Maryland: | 8.1% (193,208) |
Number of households with income $150k - 200k:| District 5, Queenstown: | 11.5% (159,170) |
| Maryland: | 11.6% (274,905) |
Number of households with income > $200k:| District 5, Queenstown: | 17.5% (240,866) |
| State: | 17.5% (415,740) |
Aggregate household income in District 5, Queenstown in 2022: $16,589,581,429
Median family income in District 5, Queenstown in 2022:| District 5, Queenstown: | $140,108 |
| Maryland: | $117,294 |
Median non-family income in District 5, Queenstown in 2022:| District 5, Queenstown: | $60,152 |
| State: | $57,179 |
Change in median non-family income between 2000 and 2022:| District 5, Queenstown, Maryland: | +75.0% |
| State: | +75.1% |
Median per capita income in District 5, Queenstown in 2022:| District 5, Queenstown: | $60,761 |
| State: | $49,236 |
Change in median per capita income between 2000 and 2022:| District 5, Queenstown, Maryland: | +97.6% |
| State: | +92.2% |
Income statistics for White residents
Median household income in District 5, Queenstown, MD in 2022:| District 5, Queenstown: | $127,404 |
| Maryland: | $107,160 |
Change in median household income between 2000 and 2022:| District 5, Queenstown, Maryland: | +87.6% |
| Maryland: | +85.3% |
Number of households with income < $10k:| District 5, Queenstown: | 3.7% (27,823) |
| State: | 3.7% (47,387) |
Number of households with income $10k - 20k:| District 5, Queenstown: | 4.1% (30,598) |
| State: | 4.1% (52,102) |
Number of households with income $20k - 30k:| District 5, Queenstown: | 4.6% (34,504) |
| Maryland: | 4.6% (58,758) |
Number of households with income $30k - 40k:| District 5, Queenstown: | 4.7% (35,091) |
| Maryland: | 4.7% (59,745) |
Number of households with income $40k - 50k:| District 5, Queenstown: | 5.0% (36,746) |
| State: | 5.0% (62,576) |
Number of households with income $50k - 60k:| District 5, Queenstown: | 5.1% (37,870) |
| State: | 5.1% (64,484) |
Number of households with income $60k - 75k:| District 5, Queenstown: | 7.7% (56,968) |
| State: | 7.7% (97,019) |
Number of households with income $75k - 100k:| District 5, Queenstown: | 11.8% (87,618) |
| State: | 11.8% (149,205) |
Number of households with income $100k - 125k:| District 5, Queenstown: | 10.6% (78,833) |
| Maryland: | 10.6% (134,231) |
Number of households with income $125k - 150k:| District 5, Queenstown: | 8.8% (65,227) |
| State: | 8.8% (111,081) |
Number of households with income $150k - 200k:| District 5, Queenstown: | 12.9% (95,734) |
| State: | 12.9% (162,966) |
Number of households with income > $200k:| District 5, Queenstown: | 20.9% (155,256) |
| Maryland: | 20.9% (264,377) |
Aggregate household income in District 5, Queenstown in 2022: $8,927,161,438
Median family income in District 5, Queenstown in 2022:| District 5, Queenstown: | $153,550 |
| State: | $134,708 |
Number of families with income < $10k:| District 5, Queenstown: | 0.8% (19) |
| State: | 1.6% (13,064) |
Number of families with income $10k - 20k:| District 5, Queenstown: | 2.0% (50) |
| Maryland: | 2.0% (16,048) |
Number of families with income $20k - 30k:| District 5, Queenstown: | 1.8% (44) |
| State: | 2.2% (18,018) |
Number of families with income $30k - 40k:| District 5, Queenstown: | 2.0% (48) |
| State: | 3.3% (26,886) |
Number of families with income $40k - 50k:| District 5, Queenstown: | 2.6% (63) |
| State: | 3.6% (29,194) |
Number of families with income $50k - 60k:| District 5, Queenstown: | 3.0% (75) |
| State: | 4.1% (33,120) |
Number of families with income $60k - 75k:| District 5, Queenstown: | 3.3% (81) |
| State: | 6.6% (53,501) |
Number of families with income $75k - 100k:| District 5, Queenstown: | 10.5% (258) |
| Maryland: | 11.3% (91,779) |
Number of families with income $100k - 125k:| District 5, Queenstown: | 10.7% (263) |
| State: | 11.3% (91,483) |
Number of families with income $125k - 150k:| District 5, Queenstown: | 5.5% (135) |
| State: | 9.9% (80,832) |
Number of families with income $150k - 200k:| District 5, Queenstown: | 25.5% (627) |
| State: | 16.0% (130,295) |
Number of families with income > $200k:| District 5, Queenstown: | 32.5% (799) |
| State: | 28.1% (228,324) |
Median non-family income in District 5, Queenstown in 2022:| District 5, Queenstown: | $66,345 |
| Maryland: | $61,991 |
Change in median non-family income between 2000 and 2022:| District 5, Queenstown, Maryland: | +76.1% |
| State: | +76.8% |
Median per capita income in District 5, Queenstown in 2022:| District 5, Queenstown: | $67,753 |
| State: | $59,750 |
Change in median per capita income between 2000 and 2022:| District 5, Queenstown, Maryland: | +105.9% |
| Maryland: | +104.5% |
Income statistics for Black or African American residents
Median household income in District 5, Queenstown, MD in 2022:| District 5, Queenstown: | $66,705 |
| State: | $77,368 |
Change in median household income between 2000 and 2022:| District 5, Queenstown, Maryland: | +106.6% |
| Maryland: | +85.7% |
Number of households with income < $10k:| District 5, Queenstown: | 7.0% (19,416) |
| State: | 7.0% (50,093) |
Number of households with income $10k - 20k:| District 5, Queenstown: | 7.2% (20,102) |
| State: | 7.2% (51,849) |
Number of households with income $20k - 30k:| District 5, Queenstown: | 5.8% (16,093) |
| Maryland: | 5.8% (41,510) |
Number of households with income $30k - 40k:| District 5, Queenstown: | 6.9% (19,173) |
| Maryland: | 6.9% (49,466) |
Number of households with income $40k - 50k:| District 5, Queenstown: | 6.6% (18,434) |
| State: | 6.6% (47,557) |
Number of households with income $50k - 60k:| District 5, Queenstown: | 6.2% (17,369) |
| State: | 6.2% (44,818) |
Number of households with income $60k - 75k:| District 5, Queenstown: | 8.6% (23,928) |
| State: | 8.6% (61,728) |
Number of households with income $75k - 100k:| District 5, Queenstown: | 13.2% (36,870) |
| Maryland: | 13.2% (95,107) |
Number of households with income $100k - 125k:| District 5, Queenstown: | 10.2% (28,523) |
| State: | 10.2% (73,579) |
Number of households with income $125k - 150k:| District 5, Queenstown: | 7.2% (20,147) |
| State: | 7.2% (51,970) |
Number of households with income $150k - 200k:| District 5, Queenstown: | 9.4% (26,216) |
| State: | 9.4% (67,623) |
Number of households with income > $200k:| District 5, Queenstown: | 11.7% (32,525) |
| Maryland: | 11.7% (83,862) |
Aggregate household income in District 5, Queenstown in 2022: $378,768,105
Median family income in District 5, Queenstown in 2022:| District 5, Queenstown: | $97,084 |
| State: | $96,241 |
Number of families with income < $10k:| District 5, Queenstown: | 5.3% (19) |
| State: | 4.5% (19,574) |
Number of families with income $10k - 20k:| District 5, Queenstown: | 6.5% (23) |
| Maryland: | 3.8% (16,604) |
Number of families with income $20k - 30k:| District 5, Queenstown: | 5.3% (19) |
| State: | 4.3% (18,629) |
Number of families with income $30k - 40k:| District 5, Queenstown: | 1.8% (6) |
| State: | 6.1% (26,770) |
Number of families with income $40k - 50k:| District 5, Queenstown: | 5.8% (21) |
| State: | 6.2% (27,138) |
Number of families with income $50k - 60k:| District 5, Queenstown: | 3.9% (14) |
| State: | 5.9% (25,636) |
Number of families with income $60k - 75k:| District 5, Queenstown: | 2.6% (9) |
| Maryland: | 8.0% (35,163) |
Number of families with income $75k - 100k:| District 5, Queenstown: | 13.9% (50) |
| State: | 12.8% (55,976) |
Number of families with income $100k - 125k:| District 5, Queenstown: | 7.8% (28) |
| Maryland: | 11.4% (49,778) |
Number of families with income $125k - 150k:| District 5, Queenstown: | 7.0% (25) |
| State: | 8.8% (38,547) |
Number of families with income $150k - 200k:| District 5, Queenstown: | 20.8% (75) |
| State: | 11.8% (51,381) |
Number of families with income > $200k:| District 5, Queenstown: | 19.2% (69) |
| Maryland: | 16.5% (71,997) |
Median non-family income in District 5, Queenstown in 2022:| District 5, Queenstown: | $24,839 |
| State: | $49,944 |
Change in median non-family income between 2000 and 2022:| District 5, Queenstown, Maryland: | +67.9% |
| Maryland: | +71.8% |
Median per capita income in District 5, Queenstown in 2022:| District 5, Queenstown: | $45,682 |
| State: | $40,756 |
Change in median per capita income between 2000 and 2022:| District 5, Queenstown, Maryland: | +121.0% |
| Maryland: | +113.5% |
Income statistics for Asian residents
Number of households with income < $10k:| District 5, Queenstown: | 4.6% (2,895) |
| State: | 4.6% (6,395) |
Number of households with income $10k - 20k:| District 5, Queenstown: | 3.6% (2,260) |
| Maryland: | 3.6% (4,994) |
Number of households with income $20k - 30k:| District 5, Queenstown: | 4.6% (2,896) |
| State: | 4.6% (6,399) |
Number of households with income $30k - 40k:| District 5, Queenstown: | 3.4% (2,120) |
| State: | 3.4% (4,682) |
Number of households with income $40k - 50k:| District 5, Queenstown: | 4.6% (2,889) |
| State: | 4.6% (6,382) |
Number of households with income $50k - 60k:| District 5, Queenstown: | 4.6% (2,898) |
| State: | 4.6% (6,402) |
Number of households with income $60k - 75k:| District 5, Queenstown: | 5.4% (3,361) |
| Maryland: | 5.4% (7,426) |
Number of households with income $75k - 100k:| District 5, Queenstown: | 11.1% (6,931) |
| State: | 11.1% (15,313) |
Number of households with income $100k - 125k:| District 5, Queenstown: | 10.6% (6,627) |
| Maryland: | 10.6% (14,640) |
Number of households with income $125k - 150k:| District 5, Queenstown: | 8.3% (5,190) |
| State: | 8.3% (11,465) |
Number of households with income $150k - 200k:| District 5, Queenstown: | 13.4% (8,370) |
| Maryland: | 13.4% (18,490) |
Number of households with income > $200k:| District 5, Queenstown: | 25.6% (16,014) |
| State: | 25.6% (35,377) |
Median per capita income in District 5, Queenstown in 2022:| District 5, Queenstown: | $26,870 |
| State: | $53,546 |
Change in median per capita income between 2000 and 2022:| District 5, Queenstown, Maryland: | +147.1% |
| State: | +122.9% |
Income statistics for Hispanic or Latino residents
Median household income in District 5, Queenstown, MD in 2022:| District 5, Queenstown: | $47,762 |
| State: | $82,138 |
Change in median household income between 2000 and 2022:| District 5, Queenstown, Maryland: | +84.1% |
| State: | +70.2% |
Number of households with income < $10k:| District 5, Queenstown: | 3.7% (1,820) |
| State: | 3.7% (6,871) |
Number of households with income $10k - 20k:| District 5, Queenstown: | 3.0% (1,477) |
| State: | 2.9% (5,465) |
Number of households with income $20k - 30k:| District 5, Queenstown: | 6.0% (2,965) |
| Maryland: | 5.9% (11,012) |
Number of households with income $30k - 40k:| District 5, Queenstown: | 7.9% (3,939) |
| State: | 7.9% (14,668) |
Number of households with income $40k - 50k:| District 5, Queenstown: | 7.6% (3,790) |
| State: | 7.6% (14,074) |
Number of households with income $50k - 60k:| District 5, Queenstown: | 7.7% (3,807) |
| State: | 7.6% (14,166) |
Number of households with income $60k - 75k:| District 5, Queenstown: | 10.0% (4,955) |
| State: | 9.9% (18,486) |
Number of households with income $75k - 100k:| District 5, Queenstown: | 16.2% (8,037) |
| State: | 16.1% (30,032) |
Number of households with income $100k - 125k:| District 5, Queenstown: | 9.4% (4,660) |
| Maryland: | 9.4% (17,432) |
Number of households with income $125k - 150k:| District 5, Queenstown: | 7.5% (3,715) |
| State: | 7.5% (13,963) |
Number of households with income $150k - 200k:| District 5, Queenstown: | 10.0% (4,989) |
| State: | 10.1% (18,750) |
Number of households with income > $200k:| District 5, Queenstown: | 11.3% (5,599) |
| State: | 11.4% (21,133) |
Aggregate household income in District 5, Queenstown in 2022: $20,245,098
Median family income in District 5, Queenstown in 2022:| District 5, Queenstown: | $45,962 |
| Maryland: | $80,127 |
Number of families with income < $10k:| District 5, Queenstown: | 2.1% (5) |
| Maryland: | 3.1% (4,499) |
Number of families with income $10k - 20k:| District 5, Queenstown: | 2.3% (6) |
| State: | 2.2% (3,250) |
Number of families with income $20k - 30k:| District 5, Queenstown: | 5.8% (15) |
| State: | 6.8% (10,000) |
Number of families with income $30k - 40k:| District 5, Queenstown: | 4.9% (13) |
| Maryland: | 7.6% (11,123) |
Number of families with income $40k - 50k:| District 5, Queenstown: | 5.8% (15) |
| Maryland: | 8.1% (11,900) |
Number of families with income $50k - 60k:| District 5, Queenstown: | 7.0% (18) |
| Maryland: | 8.5% (12,561) |
Number of families with income $60k - 75k:| District 5, Queenstown: | 5.7% (15) |
| State: | 10.2% (15,051) |
Number of families with income $75k - 100k:| District 5, Queenstown: | 15.2% (40) |
| Maryland: | 14.6% (21,440) |
Number of families with income $100k - 125k:| District 5, Queenstown: | 9.7% (25) |
| State: | 9.6% (14,146) |
Number of families with income $125k - 150k:| District 5, Queenstown: | 4.8% (13) |
| State: | 6.9% (10,202) |
Number of families with income $150k - 200k:| District 5, Queenstown: | 19.3% (51) |
| State: | 10.7% (15,752) |
Number of families with income > $200k:| District 5, Queenstown: | 17.4% (45) |
| State: | 11.6% (17,028) |
Median per capita income in District 5, Queenstown in 2022:| District 5, Queenstown: | $16,658 |
| Maryland: | $29,024 |
Change in median per capita income between 2000 and 2022:| District 5, Queenstown, Maryland: | +92.8% |
| State: | +79.2% |
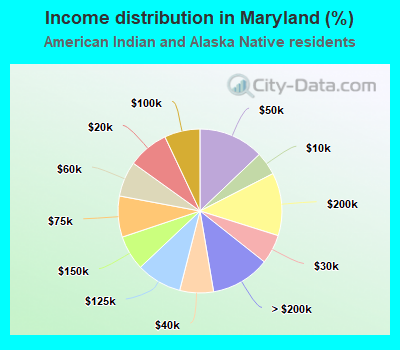
Income statistics for American Indian and Alaska Native residents
Median household income in District 5, Queenstown, MD in 2022:| District 5, Queenstown: | $118,215 |
| State: | $71,440 |
Change in median household income between 2000 and 2022:| District 5, Queenstown, Maryland: | +30.0% |
| Maryland: | +36.4% |
Number of households with income < $10k:| District 5, Queenstown: | 4.6% (625) |
| State: | 4.6% (360) |
Number of households with income $10k - 20k:| District 5, Queenstown: | 8.1% (1,098) |
| Maryland: | 8.1% (632) |
Number of households with income $20k - 30k:| District 5, Queenstown: | 5.8% (789) |
| State: | 5.8% (454) |
Number of households with income $30k - 40k:| District 5, Queenstown: | 6.7% (907) |
| Maryland: | 6.7% (522) |
Number of households with income $40k - 50k:| District 5, Queenstown: | 12.9% (1,754) |
| Maryland: | 12.9% (1,010) |
Number of households with income $50k - 60k:| District 5, Queenstown: | 7.0% (948) |
| State: | 7.0% (546) |
Number of households with income $60k - 75k:| District 5, Queenstown: | 8.1% (1,103) |
| Maryland: | 8.1% (635) |
Number of households with income $75k - 100k:| District 5, Queenstown: | 7.0% (957) |
| State: | 7.0% (551) |
Number of households with income $100k - 125k:| District 5, Queenstown: | 9.0% (1,219) |
| State: | 9.0% (702) |
Number of households with income $125k - 150k:| District 5, Queenstown: | 6.9% (940) |
| State: | 6.9% (541) |
Number of households with income $150k - 200k:| District 5, Queenstown: | 12.4% (1,688) |
| Maryland: | 12.4% (972) |
Number of households with income > $200k:| District 5, Queenstown: | 11.7% (1,591) |
| State: | 11.7% (916) |
Aggregate household income in District 5, Queenstown in 2022: $1,321,608
Median family income in District 5, Queenstown in 2022:| District 5, Queenstown: | $115,362 |
| State: | $83,298 |
Median per capita income in District 5, Queenstown in 2022:| District 5, Queenstown: | $78,971 |
| Maryland: | $35,089 |
Change in median per capita income between 2000 and 2022:| District 5, Queenstown, Maryland: | +45.6% |
| State: | +56.2% |
Income statistics for Multirace residents
Median household income in District 5, Queenstown, MD in 2022:| District 5, Queenstown: | $36,873 |
| Maryland: | $99,027 |
Change in median household income between 2000 and 2022:| District 5, Queenstown, Maryland: | +126.9% |
| State: | +111.4% |
Number of households with income < $10k:| District 5, Queenstown: | 4.8% (1,126) |
| State: | 4.8% (6,469) |
Number of households with income $10k - 20k:| District 5, Queenstown: | 3.3% (778) |
| State: | 3.3% (4,464) |
Number of households with income $20k - 30k:| District 5, Queenstown: | 5.8% (1,360) |
| State: | 5.8% (7,826) |
Number of households with income $30k - 40k:| District 5, Queenstown: | 8.1% (1,913) |
| State: | 8.1% (11,077) |
Number of households with income $40k - 50k:| District 5, Queenstown: | 4.4% (1,029) |
| Maryland: | 4.3% (5,895) |
Number of households with income $50k - 60k:| District 5, Queenstown: | 4.0% (930) |
| Maryland: | 3.9% (5,346) |
Number of households with income $60k - 75k:| District 5, Queenstown: | 6.8% (1,591) |
| State: | 6.7% (9,159) |
Number of households with income $75k - 100k:| District 5, Queenstown: | 13.6% (3,189) |
| Maryland: | 13.6% (18,420) |
Number of households with income $100k - 125k:| District 5, Queenstown: | 12.9% (3,038) |
| Maryland: | 12.9% (17,488) |
Number of households with income $125k - 150k:| District 5, Queenstown: | 8.1% (1,906) |
| State: | 8.1% (11,039) |
Number of households with income $150k - 200k:| District 5, Queenstown: | 11.5% (2,716) |
| State: | 11.5% (15,675) |
Number of households with income > $200k:| District 5, Queenstown: | 16.8% (3,959) |
| State: | 17.0% (23,059) |
Aggregate household income in District 5, Queenstown in 2022: $4,173,457
Median family income in District 5, Queenstown in 2022:| District 5, Queenstown: | $55,668 |
| State: | $110,784 |
Number of families with income $10k - 20k:| District 5, Queenstown: | 42.6% (7) |
| Maryland: | 2.2% (2,090) |
Number of families with income $20k - 30k:| District 5, Queenstown: | 57.4% (10) |
| Maryland: | 4.2% (4,034) |
Median non-family income in District 5, Queenstown in 2022:| District 5, Queenstown: | $13,039 |
| State: | $60,702 |
Change in median non-family income between 2000 and 2022:| District 5, Queenstown, Maryland: | +108.6% |
| State: | +98.2% |
Median per capita income in District 5, Queenstown in 2022:| District 5, Queenstown: | $11,070 |
| Maryland: | $35,630 |
Change in median per capita income between 2000 and 2022:| District 5, Queenstown, Maryland: | +136.0% |
| Maryland: | +125.1% |
Income statistics for other residents
Aggregate household income in District 5, Queenstown in 2022: $1,087,207
Median family income in District 5, Queenstown in 2022:| District 5, Queenstown: | $25,334 |
| State: | $69,179 |
Median per capita income in District 5, Queenstown in 2022:| District 5, Queenstown: | $4,071 |
| State: | $24,415 |
Change in median per capita income between 2000 and 2022:| District 5, Queenstown, Maryland: | +86.2% |
| State: | +73.6% |