District 1, Taneytown, Maryland (MD) income map, earnings map, and wages data
The median household income in District 1, Taneytown, MD in 2022 was $83,712, which was 13.5% less than the median annual income of $94,991 across the entire state of Maryland. Compared to the median income of $47,879 in 2000 this represents an increase of 42.8%. The per capita income in 2022 was $38,800, which means an increase of 52.0% compared to 2000 when it was $18,623.
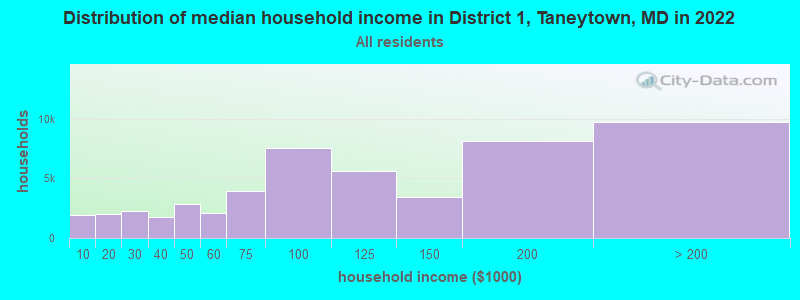
Income statistics for all residents
Median household income in District 1, Taneytown, MD in 2022:| District 1, Taneytown: | $83,713 |
| Maryland: | $94,991 |
Change in median household income between 2000 and 2022:| District 1, Taneytown, Maryland: | +74.8% |
| Maryland: | +79.7% |
Number of households with income < $10k:| District 1, Taneytown: | 3.7% (1,919) |
| Maryland: | 4.8% (114,450) |
Number of households with income $10k - 20k:| District 1, Taneytown: | 4.0% (2,034) |
| State: | 5.0% (117,883) |
Number of households with income $20k - 30k:| District 1, Taneytown: | 4.4% (2,249) |
| Maryland: | 5.2% (123,350) |
Number of households with income $30k - 40k:| District 1, Taneytown: | 3.4% (1,766) |
| State: | 5.6% (134,104) |
Number of households with income $40k - 50k:| District 1, Taneytown: | 5.5% (2,844) |
| State: | 5.6% (132,932) |
Number of households with income $50k - 60k:| District 1, Taneytown: | 4.0% (2,076) |
| Maryland: | 5.6% (132,707) |
Number of households with income $60k - 75k:| District 1, Taneytown: | 7.7% (3,947) |
| State: | 7.9% (188,335) |
Number of households with income $75k - 100k:| District 1, Taneytown: | 14.6% (7,526) |
| Maryland: | 12.5% (297,873) |
Number of households with income $100k - 125k:| District 1, Taneytown: | 11.0% (5,658) |
| State: | 10.5% (250,497) |
Number of households with income $125k - 150k:| District 1, Taneytown: | 6.8% (3,479) |
| State: | 8.1% (193,208) |
Number of households with income $150k - 200k:| District 1, Taneytown: | 15.9% (8,158) |
| State: | 11.6% (274,905) |
Number of households with income > $200k:| District 1, Taneytown: | 19.0% (9,743) |
| State: | 17.5% (415,740) |
Aggregate household income in District 1, Taneytown in 2022: $582,183,432
Median family income in District 1, Taneytown in 2022:| District 1, Taneytown: | $95,312 |
| State: | $117,294 |
Median non-family income in District 1, Taneytown in 2022:| District 1, Taneytown: | $47,369 |
| State: | $57,179 |
Change in median non-family income between 2000 and 2022:| District 1, Taneytown, Maryland: | +93.5% |
| Maryland: | +75.1% |
Median per capita income in District 1, Taneytown in 2022:| District 1, Taneytown: | $38,800 |
| State: | $49,236 |
Change in median per capita income between 2000 and 2022:| District 1, Taneytown, Maryland: | +108.3% |
| State: | +92.2% |
Income statistics for White residents
Median household income in District 1, Taneytown, MD in 2022:| District 1, Taneytown: | $84,374 |
| State: | $107,160 |
Change in median household income between 2000 and 2022:| District 1, Taneytown, Maryland: | +75.6% |
| State: | +85.3% |
Number of households with income < $10k:| District 1, Taneytown: | 2.9% (1,332) |
| State: | 3.7% (47,387) |
Number of households with income $10k - 20k:| District 1, Taneytown: | 3.6% (1,643) |
| State: | 4.1% (52,102) |
Number of households with income $20k - 30k:| District 1, Taneytown: | 4.3% (1,986) |
| Maryland: | 4.6% (58,758) |
Number of households with income $30k - 40k:| District 1, Taneytown: | 3.6% (1,667) |
| Maryland: | 4.7% (59,745) |
Number of households with income $40k - 50k:| District 1, Taneytown: | 5.6% (2,580) |
| State: | 5.0% (62,576) |
Number of households with income $50k - 60k:| District 1, Taneytown: | 4.4% (2,027) |
| Maryland: | 5.1% (64,484) |
Number of households with income $60k - 75k:| District 1, Taneytown: | 8.1% (3,701) |
| State: | 7.7% (97,019) |
Number of households with income $75k - 100k:| District 1, Taneytown: | 14.4% (6,568) |
| State: | 11.8% (149,205) |
Number of households with income $100k - 125k:| District 1, Taneytown: | 11.4% (5,206) |
| State: | 10.6% (134,231) |
Number of households with income $125k - 150k:| District 1, Taneytown: | 6.2% (2,856) |
| State: | 8.8% (111,081) |
Number of households with income $150k - 200k:| District 1, Taneytown: | 16.8% (7,696) |
| State: | 12.9% (162,966) |
Number of households with income > $200k:| District 1, Taneytown: | 18.6% (8,491) |
| Maryland: | 20.9% (264,377) |
Aggregate household income in District 1, Taneytown in 2022: $502,380,728
Median family income in District 1, Taneytown in 2022:| District 1, Taneytown: | $96,823 |
| State: | $134,708 |
Number of families with income < $10k:| District 1, Taneytown: | 5.5% (86) |
| State: | 1.6% (13,064) |
Number of families with income $10k - 20k:| District 1, Taneytown: | 0.9% (15) |
| State: | 2.0% (16,048) |
Number of families with income $20k - 30k:| District 1, Taneytown: | 4.1% (65) |
| State: | 2.2% (18,018) |
Number of families with income $30k - 40k:| District 1, Taneytown: | 4.3% (67) |
| State: | 3.3% (26,886) |
Number of families with income $40k - 50k:| District 1, Taneytown: | 9.3% (145) |
| State: | 3.6% (29,194) |
Number of families with income $50k - 60k:| District 1, Taneytown: | 7.9% (124) |
| State: | 4.1% (33,120) |
Number of families with income $60k - 75k:| District 1, Taneytown: | 10.5% (164) |
| Maryland: | 6.6% (53,501) |
Number of families with income $75k - 100k:| District 1, Taneytown: | 10.4% (163) |
| State: | 11.3% (91,779) |
Number of families with income $100k - 125k:| District 1, Taneytown: | 6.9% (108) |
| State: | 11.3% (91,483) |
Number of families with income $125k - 150k:| District 1, Taneytown: | 4.3% (67) |
| State: | 9.9% (80,832) |
Number of families with income $150k - 200k:| District 1, Taneytown: | 25.2% (394) |
| State: | 16.0% (130,295) |
Number of families with income > $200k:| District 1, Taneytown: | 10.7% (167) |
| State: | 28.1% (228,324) |
Median non-family income in District 1, Taneytown in 2022:| District 1, Taneytown: | $48,361 |
| State: | $61,991 |
Change in median non-family income between 2000 and 2022:| District 1, Taneytown, Maryland: | +95.8% |
| Maryland: | +76.8% |
Median per capita income in District 1, Taneytown in 2022:| District 1, Taneytown: | $39,996 |
| State: | $59,750 |
Change in median per capita income between 2000 and 2022:| District 1, Taneytown, Maryland: | +114.2% |
| State: | +104.5% |
Income statistics for Black or African American residents
Median household income in District 1, Taneytown, MD in 2022:| District 1, Taneytown: | $42,175 |
| State: | $77,368 |
Change in median household income between 2000 and 2022:| District 1, Taneytown, Maryland: | +106.6% |
| State: | +85.7% |
Number of households with income < $10k:| District 1, Taneytown: | 7.0% (12,276) |
| State: | 7.0% (50,093) |
Number of households with income $10k - 20k:| District 1, Taneytown: | 7.2% (12,710) |
| Maryland: | 7.2% (51,849) |
Number of households with income $20k - 30k:| District 1, Taneytown: | 5.8% (10,175) |
| State: | 5.8% (41,510) |
Number of households with income $30k - 40k:| District 1, Taneytown: | 6.9% (12,122) |
| Maryland: | 6.9% (49,466) |
Number of households with income $40k - 50k:| District 1, Taneytown: | 6.6% (11,655) |
| Maryland: | 6.6% (47,557) |
Number of households with income $50k - 60k:| District 1, Taneytown: | 6.2% (10,982) |
| State: | 6.2% (44,818) |
Number of households with income $60k - 75k:| District 1, Taneytown: | 8.6% (15,129) |
| Maryland: | 8.6% (61,728) |
Number of households with income $75k - 100k:| District 1, Taneytown: | 13.2% (23,312) |
| State: | 13.2% (95,107) |
Number of households with income $100k - 125k:| District 1, Taneytown: | 10.2% (18,034) |
| State: | 10.2% (73,579) |
Number of households with income $125k - 150k:| District 1, Taneytown: | 7.2% (12,738) |
| State: | 7.2% (51,970) |
Number of households with income $150k - 200k:| District 1, Taneytown: | 9.4% (16,576) |
| State: | 9.4% (67,623) |
Number of households with income > $200k:| District 1, Taneytown: | 11.7% (20,564) |
| State: | 11.7% (83,862) |
Aggregate household income in District 1, Taneytown in 2022: $2,696,390
Median family income in District 1, Taneytown in 2022:| District 1, Taneytown: | $43,829 |
| State: | $96,241 |
Number of families with income < $10k:| District 1, Taneytown: | 20.3% (5) |
| State: | 4.5% (19,574) |
Number of families with income $10k - 20k:| District 1, Taneytown: | 13.8% (3) |
| State: | 3.8% (16,604) |
Number of families with income $20k - 30k:| District 1, Taneytown: | 4.6% (1) |
| State: | 4.3% (18,629) |
Number of families with income $30k - 40k:| District 1, Taneytown: | 8.7% (2) |
| Maryland: | 6.1% (26,770) |
Number of families with income $40k - 50k:| District 1, Taneytown: | 6.0% (1) |
| State: | 6.2% (27,138) |
Number of families with income $125k - 150k:| District 1, Taneytown: | 46.5% (11) |
| State: | 8.8% (38,547) |
Median non-family income in District 1, Taneytown in 2022:| District 1, Taneytown: | $31,951 |
| State: | $49,944 |
Median per capita income in District 1, Taneytown in 2022:| District 1, Taneytown: | $19,561 |
| State: | $40,756 |
Change in median per capita income between 2000 and 2022:| District 1, Taneytown, Maryland: | +6.8% |
| State: | +113.5% |
Income statistics for Asian residents
Median household income in District 1, Taneytown, MD in 2022:| District 1, Taneytown: | $128,248 |
| State: | $117,771 |
Change in median household income between 2000 and 2022:| District 1, Taneytown, Maryland: | +76.9% |
| State: | +97.6% |
Number of households with income < $10k:| District 1, Taneytown: | 4.6% (7,781) |
| State: | 4.6% (6,395) |
Number of households with income $10k - 20k:| District 1, Taneytown: | 3.6% (6,076) |
| State: | 3.6% (4,994) |
Number of households with income $20k - 30k:| District 1, Taneytown: | 4.6% (7,785) |
| State: | 4.6% (6,399) |
Number of households with income $30k - 40k:| District 1, Taneytown: | 3.4% (5,697) |
| State: | 3.4% (4,682) |
Number of households with income $40k - 50k:| District 1, Taneytown: | 4.6% (7,765) |
| State: | 4.6% (6,382) |
Number of households with income $50k - 60k:| District 1, Taneytown: | 4.6% (7,789) |
| State: | 4.6% (6,402) |
Number of households with income $60k - 75k:| District 1, Taneytown: | 5.4% (9,035) |
| Maryland: | 5.4% (7,426) |
Number of households with income $75k - 100k:| District 1, Taneytown: | 11.1% (18,631) |
| State: | 11.1% (15,313) |
Number of households with income $100k - 125k:| District 1, Taneytown: | 10.6% (17,812) |
| State: | 10.6% (14,640) |
Number of households with income $125k - 150k:| District 1, Taneytown: | 8.3% (13,949) |
| State: | 8.3% (11,465) |
Number of households with income $150k - 200k:| District 1, Taneytown: | 13.4% (22,496) |
| State: | 13.4% (18,490) |
Number of households with income > $200k:| District 1, Taneytown: | 25.6% (43,042) |
| State: | 25.6% (35,377) |
Aggregate household income in District 1, Taneytown in 2022: $8,217,654
Median family income in District 1, Taneytown in 2022:| District 1, Taneytown: | $208,287 |
| State: | $137,857 |
Number of families with income $125k - 150k:| District 1, Taneytown: | 100.0% (15) |
| State: | 9.2% (9,834) |
Median non-family income in District 1, Taneytown in 2022:| District 1, Taneytown: | $34,468 |
| State: | $62,510 |
Change in median non-family income between 2000 and 2022:| District 1, Taneytown, Maryland: | +83.8% |
| State: | +83.8% |
Median per capita income in District 1, Taneytown in 2022:| District 1, Taneytown: | $114,046 |
| Maryland: | $53,546 |
Income statistics for Hispanic or Latino residents
Median household income in District 1, Taneytown, MD in 2022:| District 1, Taneytown: | $80,206 |
| State: | $82,138 |
Change in median household income between 2000 and 2022:| District 1, Taneytown, Maryland: | +81.6% |
| State: | +70.2% |
Number of households with income < $10k:| District 1, Taneytown: | 3.7% (3,098) |
| State: | 3.7% (6,871) |
Number of households with income $10k - 20k:| District 1, Taneytown: | 3.0% (2,515) |
| Maryland: | 2.9% (5,465) |
Number of households with income $20k - 30k:| District 1, Taneytown: | 6.0% (5,048) |
| State: | 5.9% (11,012) |
Number of households with income $30k - 40k:| District 1, Taneytown: | 7.9% (6,707) |
| State: | 7.9% (14,668) |
Number of households with income $40k - 50k:| District 1, Taneytown: | 7.6% (6,453) |
| State: | 7.6% (14,074) |
Number of households with income $50k - 60k:| District 1, Taneytown: | 7.7% (6,482) |
| Maryland: | 7.6% (14,166) |
Number of households with income $60k - 75k:| District 1, Taneytown: | 10.0% (8,437) |
| State: | 9.9% (18,486) |
Number of households with income $75k - 100k:| District 1, Taneytown: | 16.2% (13,686) |
| Maryland: | 16.1% (30,032) |
Number of households with income $100k - 125k:| District 1, Taneytown: | 9.4% (7,935) |
| State: | 9.4% (17,432) |
Number of households with income $125k - 150k:| District 1, Taneytown: | 7.5% (6,326) |
| State: | 7.5% (13,963) |
Number of households with income $150k - 200k:| District 1, Taneytown: | 10.0% (8,496) |
| State: | 10.1% (18,750) |
Number of households with income > $200k:| District 1, Taneytown: | 11.3% (9,533) |
| State: | 11.4% (21,133) |
Aggregate household income in District 1, Taneytown in 2022: $11,048,475
Median family income in District 1, Taneytown in 2022:| District 1, Taneytown: | $73,998 |
| Maryland: | $80,127 |
Number of families with income < $10k:| District 1, Taneytown: | 5.9% (13) |
| State: | 3.1% (4,499) |
Number of families with income $10k - 20k:| District 1, Taneytown: | 2.7% (6) |
| State: | 2.2% (3,250) |
Number of families with income $20k - 30k:| District 1, Taneytown: | 10.2% (23) |
| Maryland: | 6.8% (10,000) |
Number of families with income $30k - 40k:| District 1, Taneytown: | 12.7% (29) |
| Maryland: | 7.6% (11,123) |
Number of families with income $40k - 50k:| District 1, Taneytown: | 11.8% (27) |
| Maryland: | 8.1% (11,900) |
Number of families with income $50k - 60k:| District 1, Taneytown: | 16.5% (37) |
| State: | 8.5% (12,561) |
Number of families with income $60k - 75k:| District 1, Taneytown: | 13.2% (30) |
| State: | 10.2% (15,051) |
Number of families with income $75k - 100k:| District 1, Taneytown: | 10.1% (23) |
| Maryland: | 14.6% (21,440) |
Number of families with income $100k - 125k:| District 1, Taneytown: | 4.2% (9) |
| State: | 9.6% (14,146) |
Number of families with income $125k - 150k:| District 1, Taneytown: | 3.4% (8) |
| Maryland: | 6.9% (10,202) |
Number of families with income $150k - 200k:| District 1, Taneytown: | 7.2% (16) |
| State: | 10.7% (15,752) |
Number of families with income > $200k:| District 1, Taneytown: | 1.9% (4) |
| Maryland: | 11.6% (17,028) |
Median per capita income in District 1, Taneytown in 2022:| District 1, Taneytown: | $19,075 |
| State: | $29,024 |
Change in median per capita income between 2000 and 2022:| District 1, Taneytown, Maryland: | +57.4% |
| State: | +79.2% |
Income statistics for American Indian and Alaska Native residents
Aggregate household income in District 1, Taneytown in 2022: $714,073
Median per capita income in District 1, Taneytown in 2022:| District 1, Taneytown: | $52,966 |
| State: | $35,089 |
Change in median per capita income between 2000 and 2022:| District 1, Taneytown, Maryland: | +11.9% |
| State: | +56.2% |
Income statistics for Multirace residents
Median household income in District 1, Taneytown, MD in 2022:| District 1, Taneytown: | $61,968 |
| State: | $99,027 |
Change in median household income between 2000 and 2022:| District 1, Taneytown, Maryland: | +92.5% |
| State: | +111.4% |
Number of households with income < $10k:| District 1, Taneytown: | 4.8% (2,231) |
| State: | 4.8% (6,469) |
Number of households with income $10k - 20k:| District 1, Taneytown: | 3.3% (1,540) |
| Maryland: | 3.3% (4,464) |
Number of households with income $20k - 30k:| District 1, Taneytown: | 5.8% (2,694) |
| State: | 5.8% (7,826) |
Number of households with income $30k - 40k:| District 1, Taneytown: | 8.1% (3,790) |
| State: | 8.1% (11,077) |
Number of households with income $40k - 50k:| District 1, Taneytown: | 4.4% (2,038) |
| State: | 4.3% (5,895) |
Number of households with income $50k - 60k:| District 1, Taneytown: | 3.9% (1,841) |
| State: | 3.9% (5,346) |
Number of households with income $60k - 75k:| District 1, Taneytown: | 6.8% (3,152) |
| State: | 6.7% (9,159) |
Number of households with income $75k - 100k:| District 1, Taneytown: | 13.6% (6,317) |
| State: | 13.6% (18,420) |
Number of households with income $100k - 125k:| District 1, Taneytown: | 12.9% (6,018) |
| State: | 12.9% (17,488) |
Number of households with income $125k - 150k:| District 1, Taneytown: | 8.1% (3,775) |
| State: | 8.1% (11,039) |
Number of households with income $150k - 200k:| District 1, Taneytown: | 11.5% (5,379) |
| State: | 11.5% (15,675) |
Number of households with income > $200k:| District 1, Taneytown: | 16.8% (7,842) |
| State: | 17.0% (23,059) |
Aggregate household income in District 1, Taneytown in 2022: $13,454,814
Median family income in District 1, Taneytown in 2022:| District 1, Taneytown: | $76,568 |
| State: | $110,784 |
Number of families with income $20k - 30k:| District 1, Taneytown: | 12.2% (6) |
| State: | 4.2% (4,034) |
Number of families with income $30k - 40k:| District 1, Taneytown: | 36.6% (18) |
| Maryland: | 7.8% (7,382) |
Number of families with income $50k - 60k:| District 1, Taneytown: | 14.9% (7) |
| Maryland: | 4.2% (3,995) |
Number of families with income $75k - 100k:| District 1, Taneytown: | 36.3% (18) |
| State: | 11.7% (11,110) |
Median per capita income in District 1, Taneytown in 2022:| District 1, Taneytown: | $31,620 |
| Maryland: | $35,630 |
Income statistics for other residents
Number of households with income < $10k:| District 1, Taneytown: | 5.0% (1) |
| State: | 3.4% (3,746) |
Number of households with income $10k - 20k:| District 1, Taneytown: | 0.0% (0) |
| Maryland: | 3.5% (3,842) |
Number of households with income $20k - 30k:| District 1, Taneytown: | 10.0% (2) |
| State: | 7.6% (8,343) |
Number of households with income $30k - 40k:| District 1, Taneytown: | 10.0% (2) |
| State: | 7.5% (8,251) |
Number of households with income $40k - 50k:| District 1, Taneytown: | 10.0% (2) |
| State: | 8.6% (9,414) |
Number of households with income $50k - 60k:| District 1, Taneytown: | 10.0% (2) |
| State: | 10.0% (11,048) |
Number of households with income $60k - 75k:| District 1, Taneytown: | 10.0% (2) |
| State: | 11.2% (12,339) |
Number of households with income $75k - 100k:| District 1, Taneytown: | 15.0% (3) |
| State: | 17.5% (19,277) |
Number of households with income $100k - 125k:| District 1, Taneytown: | 10.0% (2) |
| State: | 8.9% (9,813) |
Number of households with income $125k - 150k:| District 1, Taneytown: | 5.0% (1) |
| Maryland: | 6.3% (6,907) |
Number of households with income $150k - 200k:| District 1, Taneytown: | 10.0% (2) |
| State: | 8.2% (9,023) |
Number of households with income > $200k:| District 1, Taneytown: | 5.0% (1) |
| State: | 7.3% (8,036) |
Aggregate household income in District 1, Taneytown in 2022: $7,397,589
Median family income in District 1, Taneytown in 2022:| District 1, Taneytown: | $123,917 |
| State: | $69,179 |
Number of families with income $40k - 50k:| District 1, Taneytown: | 100.0% (17) |
| State: | 10.0% (8,917) |
Median per capita income in District 1, Taneytown in 2022:| District 1, Taneytown: | $23,801 |
| State: | $24,415 |
Change in median per capita income between 2000 and 2022:| District 1, Taneytown, Maryland: | +105.8% |
| State: | +73.6% |