The median household income in Danville, IL in 2022 was $41,401, which was 85.3% less than the median annual income of $76,708 across the entire state of Illinois. Compared to the median income of $30,431 in 2000 this represents an increase of 26.5%. The per capita income in 2022 was $25,913, which means an increase of 36.4% compared to 2000 when it was $16,476.
Whole page based on the data from 2000 / 2022 when the population of Danville, Illinois was 33,904 / 28,403
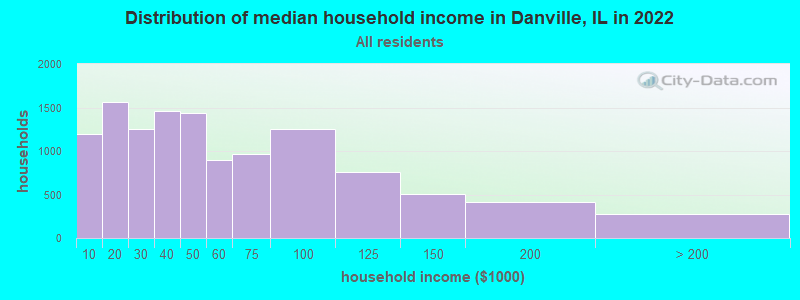
Income statistics for all residents
Median household income in Danville, IL in 2022:
Danville:
$41,402
State:
$76,708
Change in median household income between 2000 and 2022:
Danville, Illinois:
+36.1%
Illinois:
+64.6%
Number of households with income < $10k:
Danville:
9.9% (1,191)
State:
5.9% (296,090)
Number of households with income $10k - 20k:
Danville:
13.1% (1,567)
State:
6.6% (333,259)
Number of households with income $20k - 30k:
Danville:
10.5% (1,255)
Illinois:
6.8% (342,921)
Number of households with income $30k - 40k:
Danville:
12.2% (1,460)
Illinois:
7.0% (355,254)
Number of households with income $40k - 50k:
Danville:
12.0% (1,440)
State:
6.7% (340,678)
Number of households with income $50k - 60k:
Danville:
7.5% (897)
State:
6.7% (339,405)
Number of households with income $60k - 75k:
Danville:
8.0% (961)
State:
9.2% (465,709)
Number of households with income $75k - 100k:
Danville:
10.4% (1,248)
Illinois:
12.9% (651,353)
Number of households with income $100k - 125k:
Danville:
6.4% (762)
State:
10.3% (522,359)
Number of households with income $125k - 150k:
Danville:
4.2% (501)
Illinois:
7.3% (367,136)
Number of households with income $150k - 200k:
Danville:
3.5% (415)
State:
9.0% (455,249)
Number of households with income > $200k:
Danville:
2.3% (280)
State:
11.6% (586,947)
Aggregate household income in Danville in 2022: $702,310,596
Median family income in Danville in 2022:
Danville:
$54,129
State:
$96,948
Number of families with income < $10k:
Danville:
8.7% (493)
State:
3.4% (105,875)
Number of families with income $10k - 20k:
Danville:
5.4% (304)
State:
3.3% (105,017)
Number of families with income $20k - 30k:
Danville:
7.5% (427)
State:
4.7% (146,403)
Number of families with income $30k - 40k:
Danville:
11.8% (670)
Illinois:
5.3% (167,069)
Number of families with income $40k - 50k:
Danville:
12.3% (698)
State:
5.8% (181,164)
Number of families with income $50k - 60k:
Danville:
7.7% (440)
State:
6.1% (191,561)
Number of families with income $60k - 75k:
Danville:
10.6% (601)
State:
9.0% (282,985)
Number of families with income $75k - 100k:
Danville:
13.8% (785)
State:
13.8% (432,725)
Number of families with income $100k - 125k:
Danville:
8.2% (468)
Illinois:
11.9% (373,296)
Number of families with income $125k - 150k:
Danville:
4.7% (267)
State:
8.9% (279,791)
Number of families with income $150k - 200k:
Danville:
4.7% (269)
State:
11.9% (372,004)
Number of families with income > $200k:
Danville:
4.5% (257)
Illinois:
15.9% (500,033)
Median non-family income in Danville in 2022:
Danville:
$34,411
State:
$46,533
Change in median non-family income between 2000 and 2022:
Danville, Illinois:
+90.7%
Illinois:
+64.0%
Median per capita income in Danville in 2022:
Danville:
$25,913
State:
$43,317
Change in median per capita income between 2000 and 2022:
Danville, Illinois:
+57.3%
State:
+87.5%
Income statistics for White residents
Median household income in Danville, IL in 2022:
Danville:
$50,380
Illinois:
$83,346
Change in median household income between 2000 and 2022:
Danville, Illinois:
+52.3%
Illinois:
+67.5%
Number of households with income < $10k:
Danville:
6.4% (499)
State:
4.5% (149,895)
Number of households with income $10k - 20k:
Danville:
11.0% (860)
State:
5.5% (184,529)
Number of households with income $20k - 30k:
Danville:
9.4% (734)
Illinois:
6.1% (205,767)
Number of households with income $30k - 40k:
Danville:
11.8% (924)
Illinois:
6.7% (225,572)
Number of households with income $40k - 50k:
Danville:
10.6% (832)
State:
6.5% (216,965)
Number of households with income $50k - 60k:
Danville:
8.1% (636)
State:
6.6% (222,841)
Number of households with income $60k - 75k:
Danville:
10.2% (801)
State:
9.3% (312,758)
Number of households with income $75k - 100k:
Danville:
11.5% (897)
Illinois:
12.9% (433,180)
Number of households with income $100k - 125k:
Danville:
7.3% (570)
State:
10.7% (360,753)
Number of households with income $125k - 150k:
Danville:
5.7% (447)
State:
7.9% (266,532)
Number of households with income $150k - 200k:
Danville:
4.5% (351)
Illinois:
10.0% (337,357)
Number of households with income > $200k:
Danville:
3.6% (280)
State:
13.3% (446,069)
Aggregate household income in Danville in 2022: $537,382,410
Median family income in Danville in 2022:
Danville:
$67,399
State:
$107,938
Number of families with income < $10k:
Danville:
5.2% (196)
State:
2.2% (45,983)
Number of families with income $10k - 20k:
Danville:
3.8% (141)
State:
2.5% (50,574)
Number of families with income $20k - 30k:
Danville:
4.6% (171)
Illinois:
3.5% (70,927)
Number of families with income $30k - 40k:
Danville:
13.1% (490)
Illinois:
4.4% (90,563)
Number of families with income $40k - 50k:
Danville:
8.9% (333)
State:
5.0% (102,597)
Number of families with income $50k - 60k:
Danville:
8.3% (312)
State:
5.8% (119,129)
Number of families with income $60k - 75k:
Danville:
13.6% (511)
State:
8.8% (179,665)
Number of families with income $75k - 100k:
Danville:
14.7% (550)
State:
13.5% (276,887)
Number of families with income $100k - 125k:
Danville:
9.2% (343)
Illinois:
12.5% (256,099)
Number of families with income $125k - 150k:
Danville:
5.9% (221)
Illinois:
9.8% (199,855)
Number of families with income $150k - 200k:
Danville:
6.0% (224)
State:
13.4% (274,569)
Number of families with income > $200k:
Danville:
6.7% (252)
Illinois:
18.6% (381,354)
Median non-family income in Danville in 2022:
Danville:
$40,205
State:
$50,934
Change in median non-family income between 2000 and 2022:
Danville, Illinois:
+107.0%
Illinois:
+70.7%
Median per capita income in Danville in 2022:
Danville:
$33,084
Illinois:
$50,738
Change in median per capita income between 2000 and 2022:
Danville, Illinois:
+75.9%
State:
+95.5%
Income statistics for Black or African American residents
Median household income in Danville, IL in 2022:
Danville:
$30,308
Illinois:
$45,019
Change in median household income between 2000 and 2022:
Danville, Illinois:
+59.4%
Illinois:
+42.0%
Number of households with income < $10k:
Danville:
23.0% (730)
Illinois:
13.3% (92,224)
Number of households with income $10k - 20k:
Danville:
15.3% (485)
Illinois:
13.5% (93,732)
Number of households with income $20k - 30k:
Danville:
11.1% (351)
Illinois:
9.9% (68,453)
Number of households with income $30k - 40k:
Danville:
12.1% (385)
Illinois:
8.5% (59,072)
Number of households with income $40k - 50k:
Danville:
13.6% (431)
State:
7.9% (55,033)
Number of households with income $50k - 60k:
Danville:
6.1% (193)
State:
7.2% (49,556)
Number of households with income $60k - 75k:
Danville:
3.6% (115)
State:
7.8% (53,726)
Number of households with income $75k - 100k:
Danville:
6.7% (213)
State:
11.6% (80,439)
Number of households with income $100k - 125k:
Danville:
4.7% (150)
State:
7.5% (52,244)
Number of households with income $125k - 150k:
Danville:
1.3% (41)
State:
3.9% (27,058)
Number of households with income $150k - 200k:
Danville:
2.4% (76)
State:
4.6% (32,057)
Number of households with income > $200k:
Danville:
0.0% (0)
Illinois:
4.1% (28,731)
Aggregate household income in Danville in 2022: $120,526,062
Median family income in Danville in 2022:
Danville:
$39,829
State:
$60,661
Number of families with income < $10k:
Danville:
21.4% (363)
State:
9.5% (35,136)
Number of families with income $10k - 20k:
Danville:
9.9% (168)
State:
7.9% (29,324)
Number of families with income $20k - 30k:
Danville:
11.7% (199)
State:
8.8% (32,666)
Number of families with income $30k - 40k:
Danville:
8.6% (145)
State:
7.8% (28,775)
Number of families with income $40k - 50k:
Danville:
14.7% (249)
State:
8.5% (31,429)
Number of families with income $50k - 60k:
Danville:
6.2% (106)
State:
7.1% (26,341)
Number of families with income $60k - 75k:
Danville:
3.5% (59)
State:
8.3% (30,626)
Number of families with income $75k - 100k:
Danville:
10.2% (173)
Illinois:
14.0% (51,750)
Number of families with income $100k - 125k:
Danville:
6.9% (117)
State:
9.3% (34,471)
Number of families with income $125k - 150k:
Danville:
3.0% (51)
State:
5.7% (21,103)
Number of families with income $150k - 200k:
Danville:
3.8% (65)
Illinois:
6.8% (25,177)
Median non-family income in Danville in 2022:
Danville:
$30,132
State:
$29,966
Change in median non-family income between 2000 and 2022:
Danville, Illinois:
+143.9%
Illinois:
+44.4%
Median per capita income in Danville in 2022:
Danville:
$15,529
State:
$28,045
Change in median per capita income between 2000 and 2022:
Danville, Illinois:
+59.9%
Illinois:
+90.2%
Income statistics for Asian residents
Median household income in Danville, IL in 2022:
Danville:
$52,460
State:
$104,287
Change in median household income between 2000 and 2022:: -59.4%
Danville, Illinois:
-59.4%
State:
+81.9%
Number of households with income < $10k:
Danville:
21.5% (32)
State:
5.3% (14,653)
Number of households with income $10k - 20k:
Danville:
5.4% (8)
Illinois:
4.5% (12,283)
Number of households with income $20k - 30k:
Danville:
5.4% (8)
State:
4.8% (13,135)
Number of households with income $30k - 40k:
Danville:
3.4% (5)
State:
5.0% (13,655)
Number of households with income $40k - 50k:
Danville:
5.4% (8)
State:
4.5% (12,357)
Number of households with income $50k - 60k:
Danville:
19.5% (29)
Illinois:
4.9% (13,568)
Number of households with income $60k - 75k:
Danville:
2.0% (3)
State:
7.1% (19,606)
Number of households with income $75k - 100k:
Danville:
0.0% (0)
State:
12.1% (33,349)
Number of households with income $100k - 125k:
Danville:
28.9% (43)
State:
9.7% (26,669)
Number of households with income $125k - 150k:
Danville:
0.0% (0)
Illinois:
7.3% (20,172)
Number of households with income $150k - 200k:
Danville:
4.7% (7)
State:
11.5% (31,711)
Number of households with income > $200k:
Danville:
4.0% (6)
State:
23.1% (63,411)
Aggregate household income in Danville in 2022: $11,065,628
Median family income in Danville in 2022:
Danville:
$104,919
State:
$124,630
Number of families with income $20k - 30k:
Danville:
10.0% (9)
Illinois:
4.4% (8,618)
Number of families with income $30k - 40k:
Danville:
5.8% (5)
State:
4.4% (8,628)
Number of families with income $50k - 60k:
Danville:
19.4% (18)
State:
4.1% (7,974)
Number of families with income $60k - 75k:
Danville:
4.1% (4)
State:
7.0% (13,773)
Number of families with income $75k - 100k:
Danville:
8.9% (8)
State:
12.3% (24,156)
Number of families with income $100k - 125k:
Danville:
45.6% (42)
Illinois:
9.6% (18,808)
Number of families with income > $200k:
Danville:
6.2% (6)
Illinois:
28.0% (54,999)
Median non-family income in Danville in 2022:
Danville:
$2,499
Illinois:
$57,292
Change in median non-family income between 2000 and 2022:: -93.6%
Danville, Illinois:
-93.6%
State:
+78.3%
Median per capita income in Danville in 2022:
Danville:
$47,530
Illinois:
$52,977
Change in median per capita income between 2000 and 2022:
Danville, Illinois:
+13.4%
State:
+119.5%
Income statistics for Hispanic or Latino residents
Median household income in Danville, IL in 2022:
Danville:
$25,201
Illinois:
$72,139
Change in median household income between 2000 and 2022:: -23.6%
Danville, Illinois:
-23.6%
Illinois:
+75.7%
Number of households with income < $10k:
Danville:
10.6% (59)
Illinois:
4.9% (33,145)
Number of households with income $10k - 20k:
Danville:
7.0% (39)
State:
5.4% (36,345)
Number of households with income $20k - 30k:
Danville:
22.3% (124)
Illinois:
7.5% (50,677)
Number of households with income $30k - 40k:
Danville:
18.4% (102)
State:
7.7% (52,008)
Number of households with income $40k - 50k:
Danville:
3.4% (19)
Illinois:
8.1% (54,702)
Number of households with income $50k - 60k:
Danville:
6.8% (38)
State:
7.5% (51,062)
Number of households with income $60k - 75k:
Danville:
1.6% (9)
Illinois:
11.3% (76,576)
Number of households with income $75k - 100k:
Danville:
19.3% (107)
Illinois:
15.5% (105,152)
Number of households with income $100k - 125k:
Danville:
10.5% (58)
State:
11.5% (77,760)
Number of households with income $125k - 150k:
Danville:
0.0% (0)
Illinois:
7.3% (49,310)
Number of households with income $150k - 200k:
Danville:
0.0% (0)
State:
7.6% (51,233)
Number of households with income > $200k:
Danville:
0.0% (0)
State:
5.9% (40,028)
Aggregate household income in Danville in 2022: $19,783,745
Median family income in Danville in 2022:
Danville:
$36,686
Illinois:
$76,467
Number of families with income < $10k:
Danville:
10.4% (40)
State:
3.8% (19,330)
Number of families with income $10k - 20k:
Danville:
3.5% (14)
State:
3.8% (19,314)
Number of families with income $20k - 30k:
Danville:
24.8% (97)
State:
6.8% (34,467)
Number of families with income $30k - 40k:
Danville:
17.8% (69)
Illinois:
7.5% (37,976)
Number of families with income $40k - 50k:
Danville:
8.8% (34)
State:
7.7% (38,858)
Number of families with income $50k - 60k:
Danville:
9.4% (37)
Illinois:
7.6% (38,606)
Number of families with income $60k - 75k:
Danville:
2.3% (9)
State:
11.5% (58,164)
Number of families with income $75k - 100k:
Danville:
21.5% (84)
State:
16.0% (81,055)
Number of families with income $100k - 125k:
Danville:
1.4% (6)
Illinois:
12.1% (61,491)
Median non-family income in Danville in 2022:
Danville:
$25,630
State:
$45,965
Change in median non-family income between 2000 and 2022:: -38.3%
Danville, Illinois:
-38.3%
State:
+75.9%
Median per capita income in Danville in 2022:
Danville:
$11,097
Illinois:
$26,551
Change in median per capita income between 2000 and 2022:
Danville, Illinois:
+40.2%
State:
+111.0%
Income statistics for Multirace residents
Median household income in Danville, IL in 2022:
Danville:
$27,010
Illinois:
$71,185
Change in median household income between 2000 and 2022:
Danville, Illinois:
+0.5%
State:
+81.4%
Number of households with income < $10k:
Danville:
9.6% (59)
State:
5.3% (21,595)
Number of households with income $10k - 20k:
Danville:
17.2% (105)
Illinois:
6.5% (26,720)
Number of households with income $20k - 30k:
Danville:
15.5% (95)
Illinois:
8.0% (32,573)
Number of households with income $30k - 40k:
Danville:
33.0% (202)
State:
8.4% (34,383)
Number of households with income $40k - 50k:
Danville:
0.0% (0)
Illinois:
7.4% (30,234)
Number of households with income $50k - 60k:
Danville:
4.2% (26)
State:
6.9% (28,432)
Number of households with income $60k - 75k:
Danville:
2.6% (16)
State:
10.2% (41,780)
Number of households with income $75k - 100k:
Danville:
14.2% (87)
State:
13.0% (53,426)
Number of households with income $100k - 125k:
Danville:
2.3% (14)
Illinois:
10.5% (43,126)
Number of households with income $125k - 150k:
Danville:
1.3% (8)
State:
7.6% (31,153)
Number of households with income $150k - 200k:
Danville:
0.0% (0)
State:
7.6% (30,946)
Number of households with income > $200k:
Danville:
0.0% (0)
State:
8.6% (35,208)
Aggregate household income in Danville in 2022: $15,671,131
Median family income in Danville in 2022:
Danville:
$35,038
Illinois:
$84,400
Number of families with income < $10k:
Danville:
18.0% (62)
State:
3.9% (10,812)
Number of families with income $10k - 20k:
Danville:
2.6% (9)
State:
4.2% (11,692)
Number of families with income $20k - 30k:
Danville:
17.4% (60)
Illinois:
6.3% (17,559)
Number of families with income $30k - 40k:
Danville:
39.7% (137)
State:
7.5% (20,780)
Number of families with income $50k - 60k:
Danville:
2.4% (8)
State:
6.9% (19,177)
Number of families with income $60k - 75k:
Danville:
2.6% (9)
State:
9.3% (25,936)
Number of families with income $75k - 100k:
Danville:
15.0% (52)
State:
13.6% (37,857)
Number of families with income $125k - 150k:
Danville:
2.3% (8)
State:
9.0% (25,085)
Median non-family income in Danville in 2022:
Danville:
$25,053
State:
$43,615
Change in median non-family income between 2000 and 2022:
Danville, Illinois:
+72.4%
State:
+77.3%
Median per capita income in Danville in 2022:
Danville:
$5,902
State:
$29,285
Change in median per capita income between 2000 and 2022:: -20.7%
Danville, Illinois:
-20.7%
Illinois:
+112.9%
Income statistics for other residents
Median household income in Danville, IL in 2022:
Danville:
$61,954
State:
$71,711
Number of households with income < $10k:
Danville:
0.0% (0)
State:
5.7% (16,383)
Number of households with income $10k - 20k:
Danville:
3.8% (6)
Illinois:
4.8% (13,886)
Number of households with income $20k - 30k:
Danville:
0.0% (0)
State:
7.0% (20,054)
Number of households with income $30k - 40k:
Danville:
6.3% (10)
State:
7.0% (20,038)
Number of households with income $40k - 50k:
Danville:
13.3% (21)
State:
8.3% (23,759)
Number of households with income $50k - 60k:
Danville:
26.6% (42)
State:
7.8% (22,410)
Number of households with income $60k - 75k:
Danville:
0.0% (0)
State:
12.0% (34,448)
Number of households with income $75k - 100k:
Danville:
26.6% (42)
State:
16.2% (46,508)
Number of households with income $100k - 125k:
Danville:
23.4% (37)
Illinois:
12.5% (35,952)
Number of households with income $125k - 150k:
Danville:
0.0% (0)
Illinois:
6.9% (19,732)
Number of households with income $150k - 200k:
Danville:
0.0% (0)
State:
7.5% (21,422)
Number of households with income > $200k:
Danville:
0.0% (0)
State:
4.3% (12,194)
Aggregate household income in Danville in 2022: $11,197,968
Median family income in Danville in 2022:
Danville:
$60,026
Illinois:
$74,069
Number of families with income $10k - 20k:
Danville:
4.5% (6)
Illinois:
3.3% (7,467)
Number of families with income $40k - 50k:
Danville:
30.6% (42)
State:
8.1% (18,155)
Number of families with income $50k - 60k:
Danville:
28.2% (38)
State:
7.4% (16,614)
Number of families with income $75k - 100k:
Danville:
32.0% (44)
State:
17.2% (38,560)
Number of families with income $100k - 125k:
Danville:
4.8% (6)
State:
12.3% (27,638)
Median per capita income in Danville in 2022:
Danville:
$16,013
State:
$25,392
Change in median per capita income between 2000 and 2022:
Danville, Illinois:
+67.7%
State:
+117.4%
Discuss Danville, Illinois (IL) on our hugely popular Illinois forum.