The median household income in Chillum, MD in 2022 was $71,821, which was 32.3% less than the median annual income of $94,991 across the entire state of Maryland. Compared to the median income of $41,307 in 2000 this represents an increase of 42.5%. The per capita income in 2022 was $29,275, which means an increase of 38.8% compared to 2000 when it was $17,915.
Whole page based on the data from 2000 / 2022 when the population of Chillum, Maryland was 34,252 / 35,525
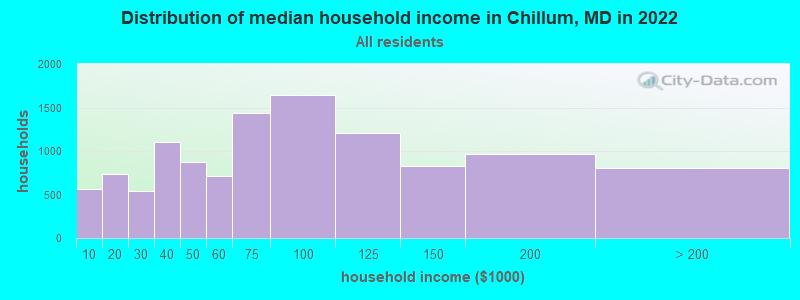
Income statistics for all residents
Median household income in Chillum, MD in 2022:
Chillum:
$71,822
State:
$94,991
Change in median household income between 2000 and 2022:
Chillum, Maryland:
+73.9%
State:
+79.7%
Number of households with income < $10k:
Chillum:
5.0% (568)
State:
4.8% (114,450)
Number of households with income $10k - 20k:
Chillum:
6.4% (735)
State:
5.0% (117,883)
Number of households with income $20k - 30k:
Chillum:
4.8% (543)
State:
5.2% (123,350)
Number of households with income $30k - 40k:
Chillum:
9.7% (1,101)
State:
5.6% (134,104)
Number of households with income $40k - 50k:
Chillum:
7.6% (872)
State:
5.6% (132,932)
Number of households with income $50k - 60k:
Chillum:
6.3% (718)
State:
5.6% (132,707)
Number of households with income $60k - 75k:
Chillum:
12.6% (1,435)
Maryland:
7.9% (188,335)
Number of households with income $75k - 100k:
Chillum:
14.4% (1,642)
State:
12.5% (297,873)
Number of households with income $100k - 125k:
Chillum:
10.5% (1,203)
State:
10.5% (250,497)
Number of households with income $125k - 150k:
Chillum:
7.2% (823)
State:
8.1% (193,208)
Number of households with income $150k - 200k:
Chillum:
8.4% (962)
Maryland:
11.6% (274,905)
Number of households with income > $200k:
Chillum:
7.0% (804)
State:
17.5% (415,740)
Aggregate household income in Chillum in 2022: $1,001,752,392
Median family income in Chillum in 2022:
Chillum:
$73,648
State:
$117,294
Number of families with income < $10k:
Chillum:
5.1% (408)
State:
2.7% (41,433)
Number of families with income $10k - 20k:
Chillum:
4.0% (322)
Maryland:
2.6% (40,126)
Number of families with income $20k - 30k:
Chillum:
2.8% (225)
State:
3.4% (52,891)
Number of families with income $30k - 40k:
Chillum:
9.2% (731)
Maryland:
4.5% (70,252)
Number of families with income $40k - 50k:
Chillum:
7.8% (625)
State:
4.8% (74,112)
Number of families with income $50k - 60k:
Chillum:
9.2% (735)
State:
5.0% (77,590)
Number of families with income $60k - 75k:
Chillum:
13.2% (1,051)
State:
7.1% (109,924)
Number of families with income $75k - 100k:
Chillum:
12.3% (977)
State:
12.0% (185,255)
Number of families with income $100k - 125k:
Chillum:
11.3% (898)
Maryland:
11.2% (173,203)
Number of families with income $125k - 150k:
Chillum:
7.6% (608)
State:
9.3% (143,453)
Number of families with income $150k - 200k:
Chillum:
9.9% (790)
State:
14.2% (218,861)
Number of families with income > $200k:
Chillum:
7.6% (604)
Maryland:
23.2% (359,182)
Median non-family income in Chillum in 2022:
Chillum:
$46,683
State:
$57,179
Change in median non-family income between 2000 and 2022:
Chillum, Maryland:
+60.3%
State:
+75.1%
Median per capita income in Chillum in 2022:
Chillum:
$29,276
State:
$49,236
Change in median per capita income between 2000 and 2022:
Chillum, Maryland:
+63.4%
State:
+92.2%
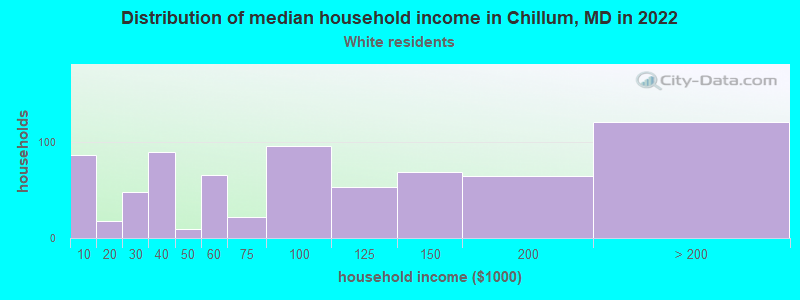
Income statistics for White residents
Median household income in Chillum, MD in 2022:
Chillum:
$87,285
State:
$107,160
Change in median household income between 2000 and 2022:
Chillum, Maryland:
+117.2%
State:
+85.3%
Number of households with income < $10k:
Chillum:
11.7% (87)
Maryland:
3.7% (47,387)
Number of households with income $10k - 20k:
Chillum:
2.4% (18)
State:
4.1% (52,102)
Number of households with income $20k - 30k:
Chillum:
6.5% (48)
State:
4.6% (58,758)
Number of households with income $30k - 40k:
Chillum:
12.1% (90)
State:
4.7% (59,745)
Number of households with income $40k - 50k:
Chillum:
1.2% (9)
State:
5.0% (62,576)
Number of households with income $50k - 60k:
Chillum:
8.9% (66)
State:
5.1% (64,484)
Number of households with income $60k - 75k:
Chillum:
3.0% (22)
State:
7.7% (97,019)
Number of households with income $75k - 100k:
Chillum:
12.9% (96)
State:
11.8% (149,205)
Number of households with income $100k - 125k:
Chillum:
7.1% (53)
State:
10.6% (134,231)
Number of households with income $125k - 150k:
Chillum:
9.3% (69)
State:
8.8% (111,081)
Number of households with income $150k - 200k:
Chillum:
8.7% (65)
State:
12.9% (162,966)
Number of households with income > $200k:
Chillum:
16.3% (121)
State:
20.9% (264,377)
Aggregate household income in Chillum in 2022: $78,801,926
Median family income in Chillum in 2022:
Chillum:
$105,018
State:
$134,708
Number of families with income $10k - 20k:
Chillum:
5.5% (21)
Maryland:
2.0% (16,048)
Number of families with income $30k - 40k:
Chillum:
3.4% (13)
Maryland:
3.3% (26,886)
Number of families with income $50k - 60k:
Chillum:
25.0% (95)
State:
4.1% (33,120)
Number of families with income $60k - 75k:
Chillum:
4.1% (15)
Maryland:
6.6% (53,501)
Number of families with income $75k - 100k:
Chillum:
9.2% (35)
State:
11.3% (91,779)
Number of families with income $100k - 125k:
Chillum:
2.2% (8)
Maryland:
11.3% (91,483)
Number of families with income $125k - 150k:
Chillum:
4.5% (17)
State:
9.9% (80,832)
Number of families with income $150k - 200k:
Chillum:
19.7% (75)
State:
16.0% (130,295)
Number of families with income > $200k:
Chillum:
26.5% (101)
State:
28.1% (228,324)
Median non-family income in Chillum in 2022:
Chillum:
$36,285
State:
$61,991
Change in median non-family income between 2000 and 2022:
Chillum, Maryland:
+19.6%
State:
+76.8%
Median per capita income in Chillum in 2022:
Chillum:
$38,100
State:
$59,750
Change in median per capita income between 2000 and 2022:
Chillum, Maryland:
+74.1%
State:
+104.5%
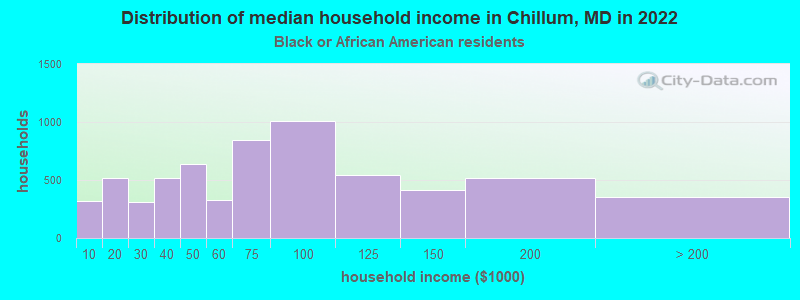
Income statistics for Black or African American residents
Median household income in Chillum, MD in 2022:
Chillum:
$70,878
Maryland:
$77,368
Change in median household income between 2000 and 2022:
Chillum, Maryland:
+71.2%
State:
+85.7%
Number of households with income < $10k:
Chillum:
5.1% (323)
State:
7.0% (50,093)
Number of households with income $10k - 20k:
Chillum:
8.2% (520)
State:
7.2% (51,849)
Number of households with income $20k - 30k:
Chillum:
4.9% (311)
State:
5.8% (41,510)
Number of households with income $30k - 40k:
Chillum:
8.2% (518)
State:
6.9% (49,466)
Number of households with income $40k - 50k:
Chillum:
10.1% (637)
State:
6.6% (47,557)
Number of households with income $50k - 60k:
Chillum:
5.2% (331)
Maryland:
6.2% (44,818)
Number of households with income $60k - 75k:
Chillum:
13.4% (845)
Maryland:
8.6% (61,728)
Number of households with income $75k - 100k:
Chillum:
15.9% (1,008)
State:
13.2% (95,107)
Number of households with income $100k - 125k:
Chillum:
8.6% (547)
State:
10.2% (73,579)
Number of households with income $125k - 150k:
Chillum:
6.6% (416)
State:
7.2% (51,970)
Number of households with income $150k - 200k:
Chillum:
8.2% (519)
State:
9.4% (67,623)
Number of households with income > $200k:
Chillum:
5.5% (350)
State:
11.7% (83,862)
Aggregate household income in Chillum in 2022: $546,239,363
Median family income in Chillum in 2022:
Chillum:
$76,081
Maryland:
$96,241
Number of families with income < $10k:
Chillum:
5.4% (205)
State:
4.5% (19,574)
Number of families with income $10k - 20k:
Chillum:
3.1% (116)
State:
3.8% (16,604)
Number of families with income $20k - 30k:
Chillum:
1.2% (45)
State:
4.3% (18,629)
Number of families with income $30k - 40k:
Chillum:
7.6% (290)
State:
6.1% (26,770)
Number of families with income $40k - 50k:
Chillum:
9.1% (345)
State:
6.2% (27,138)
Number of families with income $50k - 60k:
Chillum:
5.0% (191)
Maryland:
5.9% (25,636)
Number of families with income $60k - 75k:
Chillum:
18.1% (686)
Maryland:
8.0% (35,163)
Number of families with income $75k - 100k:
Chillum:
14.3% (542)
Maryland:
12.8% (55,976)
Number of families with income $100k - 125k:
Chillum:
9.0% (343)
Maryland:
11.4% (49,778)
Number of families with income $125k - 150k:
Chillum:
8.7% (330)
State:
8.8% (38,547)
Number of families with income $150k - 200k:
Chillum:
10.2% (387)
Maryland:
11.8% (51,381)
Number of families with income > $200k:
Chillum:
8.3% (317)
State:
16.5% (71,997)
Median non-family income in Chillum in 2022:
Chillum:
$48,441
Maryland:
$49,944
Change in median non-family income between 2000 and 2022:
Chillum, Maryland:
+62.9%
State:
+71.8%
Median per capita income in Chillum in 2022:
Chillum:
$37,237
State:
$40,756
Change in median per capita income between 2000 and 2022:
Chillum, Maryland:
+96.7%
Maryland:
+113.5%
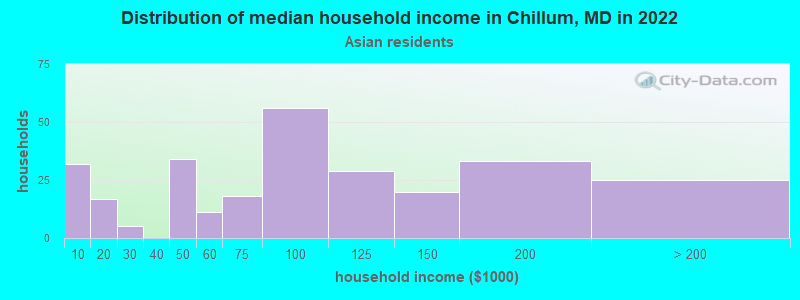
Income statistics for Asian residents
Median household income in Chillum, MD in 2022:
Chillum:
$85,409
State:
$117,771
Change in median household income between 2000 and 2022:
Chillum, Maryland:
+84.1%
State:
+97.6%
Number of households with income < $10k:
Chillum:
11.4% (32)
State:
4.6% (6,395)
Number of households with income $10k - 20k:
Chillum:
6.1% (17)
Maryland:
3.6% (4,994)
Number of households with income $20k - 30k:
Chillum:
1.8% (5)
State:
4.6% (6,399)
Number of households with income $30k - 40k:
Chillum:
0.0% (0)
Maryland:
3.4% (4,682)
Number of households with income $40k - 50k:
Chillum:
12.1% (34)
Maryland:
4.6% (6,382)
Number of households with income $50k - 60k:
Chillum:
3.9% (11)
Maryland:
4.6% (6,402)
Number of households with income $60k - 75k:
Chillum:
6.4% (18)
State:
5.4% (7,426)
Number of households with income $75k - 100k:
Chillum:
20.0% (56)
Maryland:
11.1% (15,313)
Number of households with income $100k - 125k:
Chillum:
10.4% (29)
Maryland:
10.6% (14,640)
Number of households with income $125k - 150k:
Chillum:
7.1% (20)
State:
8.3% (11,465)
Number of households with income $150k - 200k:
Chillum:
11.8% (33)
Maryland:
13.4% (18,490)
Number of households with income > $200k:
Chillum:
8.9% (25)
State:
25.6% (35,377)
Aggregate household income in Chillum in 2022: $25,167,109
Median family income in Chillum in 2022:
Chillum:
$85,183
State:
$137,857
Number of families with income $10k - 20k:
Chillum:
13.2% (20)
State:
2.4% (2,535)
Number of families with income $20k - 30k:
Chillum:
3.6% (5)
State:
3.3% (3,499)
Number of families with income $40k - 50k:
Chillum:
3.9% (6)
Maryland:
4.1% (4,351)
Number of families with income $50k - 60k:
Chillum:
8.5% (13)
Maryland:
4.4% (4,709)
Number of families with income $60k - 75k:
Chillum:
3.8% (6)
State:
4.5% (4,749)
Number of families with income $75k - 100k:
Chillum:
25.8% (40)
State:
10.9% (11,658)
Number of families with income $100k - 125k:
Chillum:
13.9% (21)
Maryland:
10.6% (11,243)
Number of families with income $150k - 200k:
Chillum:
22.2% (34)
Maryland:
15.2% (16,182)
Number of families with income > $200k:
Chillum:
5.2% (8)
State:
30.3% (32,297)
Median per capita income in Chillum in 2022:
Chillum:
$34,078
State:
$53,546
Change in median per capita income between 2000 and 2022:
Chillum, Maryland:
+68.7%
State:
+122.9%
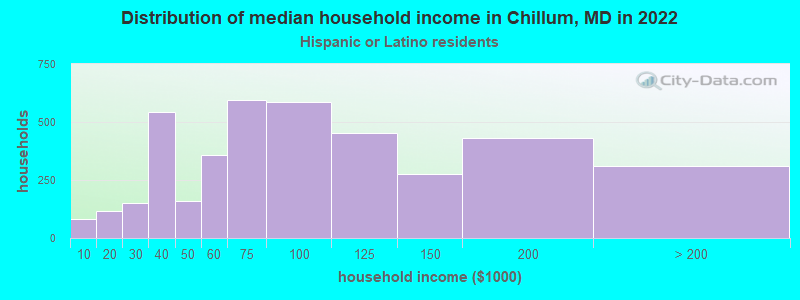
Income statistics for Hispanic or Latino residents
Median household income in Chillum, MD in 2022:
Chillum:
$78,488
State:
$82,138
Change in median household income between 2000 and 2022:
Chillum, Maryland:
+92.9%
Maryland:
+70.2%
Number of households with income < $10k:
Chillum:
2.0% (82)
State:
3.7% (6,871)
Number of households with income $10k - 20k:
Chillum:
2.8% (115)
State:
2.9% (5,465)
Number of households with income $20k - 30k:
Chillum:
3.7% (149)
Maryland:
5.9% (11,012)
Number of households with income $30k - 40k:
Chillum:
13.4% (545)
State:
7.9% (14,668)
Number of households with income $40k - 50k:
Chillum:
3.9% (158)
State:
7.6% (14,074)
Number of households with income $50k - 60k:
Chillum:
8.8% (359)
Maryland:
7.6% (14,166)
Number of households with income $60k - 75k:
Chillum:
14.7% (596)
State:
9.9% (18,486)
Number of households with income $75k - 100k:
Chillum:
14.5% (588)
State:
16.1% (30,032)
Number of households with income $100k - 125k:
Chillum:
11.1% (453)
State:
9.4% (17,432)
Number of households with income $125k - 150k:
Chillum:
6.8% (275)
State:
7.5% (13,963)
Number of households with income $150k - 200k:
Chillum:
10.7% (433)
State:
10.1% (18,750)
Number of households with income > $200k:
Chillum:
7.7% (312)
Maryland:
11.4% (21,133)
Aggregate household income in Chillum in 2022: $377,100,073
Median family income in Chillum in 2022:
Chillum:
$62,262
State:
$80,127
Number of families with income < $10k:
Chillum:
2.9% (109)
State:
3.1% (4,499)
Number of families with income $10k - 20k:
Chillum:
2.5% (93)
State:
2.2% (3,250)
Number of families with income $20k - 30k:
Chillum:
6.5% (245)
State:
6.8% (10,000)
Number of families with income $30k - 40k:
Chillum:
12.6% (476)
Maryland:
7.6% (11,123)
Number of families with income $40k - 50k:
Chillum:
7.4% (278)
State:
8.1% (11,900)
Number of families with income $50k - 60k:
Chillum:
17.8% (671)
State:
8.5% (12,561)
Number of families with income $60k - 75k:
Chillum:
9.1% (344)
Maryland:
10.2% (15,051)
Number of families with income $75k - 100k:
Chillum:
10.1% (379)
State:
14.6% (21,440)
Number of families with income $100k - 125k:
Chillum:
10.7% (405)
Maryland:
9.6% (14,146)
Number of families with income $125k - 150k:
Chillum:
4.9% (184)
State:
6.9% (10,202)
Number of families with income $150k - 200k:
Chillum:
10.4% (392)
State:
10.7% (15,752)
Number of families with income > $200k:
Chillum:
5.2% (198)
Maryland:
11.6% (17,028)
Median non-family income in Chillum in 2022:
Chillum:
$61,764
Maryland:
$55,347
Median per capita income in Chillum in 2022:
Chillum:
$21,238
State:
$29,024
Change in median per capita income between 2000 and 2022:
Chillum, Maryland:
+86.7%
State:
+79.2%
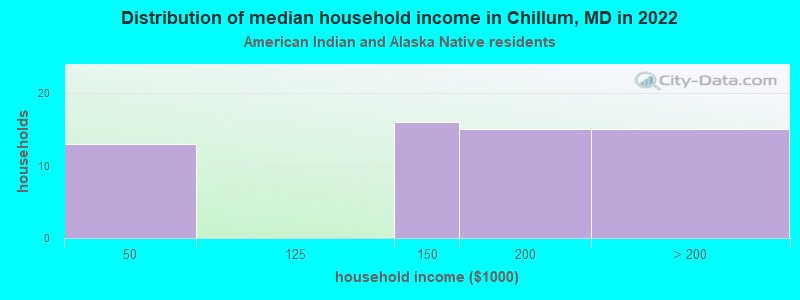
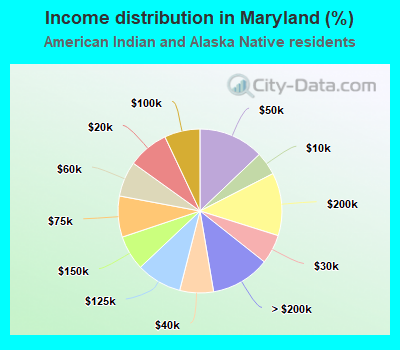
Income statistics for American Indian and Alaska Native residents
Median household income in Chillum, MD in 2022:
Chillum:
$199,528
State:
$71,440
Number of households with income < $10k:
Chillum:
0.0% (0)
Maryland:
4.6% (360)
Number of households with income $10k - 20k:
Chillum:
0.0% (0)
State:
8.1% (632)
Number of households with income $20k - 30k:
Chillum:
0.0% (0)
State:
5.8% (454)
Number of households with income $30k - 40k:
Chillum:
0.0% (0)
State:
6.7% (522)
Number of households with income $40k - 50k:
Chillum:
22.0% (13)
Maryland:
12.9% (1,010)
Number of households with income $50k - 60k:
Chillum:
0.0% (0)
State:
7.0% (546)
Number of households with income $60k - 75k:
Chillum:
0.0% (0)
State:
8.1% (635)
Number of households with income $75k - 100k:
Chillum:
0.0% (0)
Maryland:
7.0% (551)
Number of households with income $100k - 125k:
Chillum:
0.0% (0)
State:
9.0% (702)
Number of households with income $125k - 150k:
Chillum:
27.1% (16)
State:
6.9% (541)
Number of households with income $150k - 200k:
Chillum:
25.4% (15)
State:
12.4% (972)
Number of households with income > $200k:
Chillum:
25.4% (15)
State:
11.7% (916)
Aggregate household income in Chillum in 2022: $10,229,685
Median family income in Chillum in 2022:
Chillum:
$214,957
Maryland:
$83,298
Number of families with income $150k - 200k:
Chillum:
51.1% (15)
State:
15.4% (861)
Number of families with income > $200k:
Chillum:
48.9% (14)
Maryland:
12.2% (684)
Median per capita income in Chillum in 2022:
Chillum:
$50,014
State:
$35,089
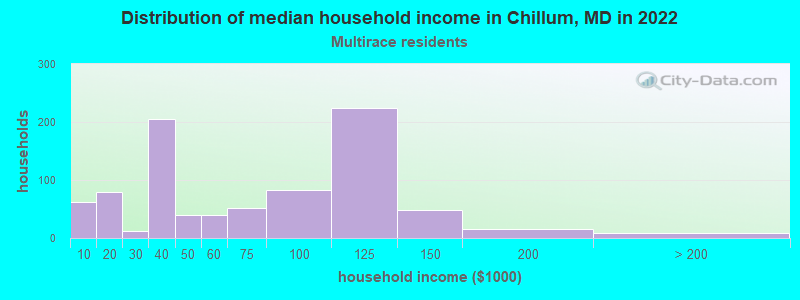
Income statistics for Multirace residents
Median household income in Chillum, MD in 2022:
Chillum:
$55,064
State:
$99,027
Change in median household income between 2000 and 2022:
Chillum, Maryland:
+84.5%
Maryland:
+111.4%
Number of households with income < $10k:
Chillum:
7.1% (62)
State:
4.8% (6,469)
Number of households with income $10k - 20k:
Chillum:
9.2% (80)
Maryland:
3.3% (4,464)
Number of households with income $20k - 30k:
Chillum:
1.4% (12)
State:
5.8% (7,826)
Number of households with income $30k - 40k:
Chillum:
23.6% (205)
Maryland:
8.1% (11,077)
Number of households with income $40k - 50k:
Chillum:
4.5% (39)
State:
4.3% (5,895)
Number of households with income $50k - 60k:
Chillum:
4.5% (39)
Maryland:
3.9% (5,346)
Number of households with income $60k - 75k:
Chillum:
6.0% (52)
State:
6.7% (9,159)
Number of households with income $75k - 100k:
Chillum:
9.6% (83)
State:
13.6% (18,420)
Number of households with income $100k - 125k:
Chillum:
25.8% (224)
State:
12.9% (17,488)
Number of households with income $125k - 150k:
Chillum:
5.6% (49)
State:
8.1% (11,039)
Number of households with income $150k - 200k:
Chillum:
1.7% (15)
Maryland:
11.5% (15,675)
Number of households with income > $200k:
Chillum:
1.0% (9)
State:
17.0% (23,059)
Aggregate household income in Chillum in 2022: $51,114,225
Median family income in Chillum in 2022:
Chillum:
$65,393
Maryland:
$110,784
Number of families with income < $10k:
Chillum:
12.8% (94)
State:
3.1% (2,937)
Number of families with income $10k - 20k:
Chillum:
5.2% (38)
Maryland:
2.2% (2,090)
Number of families with income $20k - 30k:
Chillum:
0.4% (3)
State:
4.2% (4,034)
Number of families with income $30k - 40k:
Chillum:
18.4% (135)
State:
7.8% (7,382)
Number of families with income $40k - 50k:
Chillum:
6.9% (51)
State:
3.6% (3,426)
Number of families with income $50k - 60k:
Chillum:
3.6% (26)
State:
4.2% (3,995)
Number of families with income $60k - 75k:
Chillum:
4.7% (34)
State:
6.5% (6,128)
Number of families with income $75k - 100k:
Chillum:
0.4% (3)
State:
11.7% (11,110)
Number of families with income $100k - 125k:
Chillum:
35.5% (261)
State:
13.2% (12,548)
Number of families with income $125k - 150k:
Chillum:
8.2% (60)
Maryland:
9.0% (8,509)
Number of families with income $150k - 200k:
Chillum:
2.5% (18)
State:
13.6% (12,921)
Number of families with income > $200k:
Chillum:
1.5% (11)
State:
20.9% (19,875)
Median non-family income in Chillum in 2022:
Chillum:
$11,243
State:
$60,702
Change in median non-family income between 2000 and 2022:: -47.5%
Chillum, Maryland:
-47.5%
State:
+98.2%
Median per capita income in Chillum in 2022:
Chillum:
$21,274
State:
$35,630
Change in median per capita income between 2000 and 2022:
Chillum, Maryland:
+48.1%
Maryland:
+125.1%
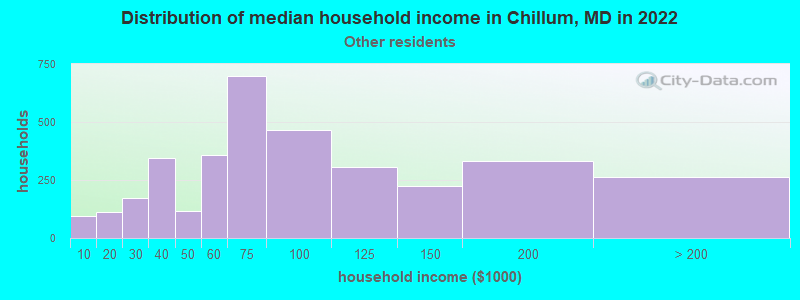
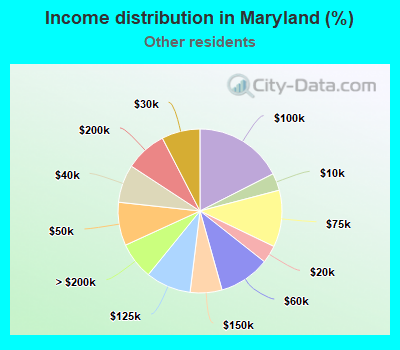
Income statistics for other residents
Median household income in Chillum, MD in 2022:
Chillum:
$76,368
State:
$72,980
Number of households with income < $10k:
Chillum:
2.7% (93)
State:
3.4% (3,746)
Number of households with income $10k - 20k:
Chillum:
3.2% (111)
State:
3.5% (3,842)
Number of households with income $20k - 30k:
Chillum:
4.9% (171)
Maryland:
7.6% (8,343)
Number of households with income $30k - 40k:
Chillum:
9.8% (343)
Maryland:
7.5% (8,251)
Number of households with income $40k - 50k:
Chillum:
3.4% (118)
State:
8.6% (9,414)
Number of households with income $50k - 60k:
Chillum:
10.3% (359)
State:
10.0% (11,048)
Number of households with income $60k - 75k:
Chillum:
20.0% (699)
Maryland:
11.2% (12,339)
Number of households with income $75k - 100k:
Chillum:
13.3% (465)
Maryland:
17.5% (19,277)
Number of households with income $100k - 125k:
Chillum:
8.8% (308)
Maryland:
8.9% (9,813)
Number of households with income $125k - 150k:
Chillum:
6.5% (226)
State:
6.3% (6,907)
Number of households with income $150k - 200k:
Chillum:
9.5% (333)
Maryland:
8.2% (9,023)
Number of households with income > $200k:
Chillum:
7.5% (262)
State:
7.3% (8,036)
Aggregate household income in Chillum in 2022: $318,853,811
Median family income in Chillum in 2022:
Chillum:
$63,593
State:
$69,179
Number of families with income < $10k:
Chillum:
1.9% (64)
State:
3.0% (2,713)
Number of families with income $10k - 20k:
Chillum:
2.0% (67)
State:
2.8% (2,505)
Number of families with income $20k - 30k:
Chillum:
8.2% (269)
Maryland:
9.4% (8,390)
Number of families with income $30k - 40k:
Chillum:
10.0% (329)
State:
7.3% (6,474)
Number of families with income $40k - 50k:
Chillum:
7.7% (253)
State:
10.0% (8,917)
Number of families with income $50k - 60k:
Chillum:
19.5% (638)
Maryland:
11.3% (10,043)
Number of families with income $60k - 75k:
Chillum:
11.5% (376)
State:
11.0% (9,850)
Number of families with income $75k - 100k:
Chillum:
12.6% (413)
Maryland:
15.9% (14,199)
Number of families with income $100k - 125k:
Chillum:
8.2% (269)
State:
8.6% (7,698)
Number of families with income $125k - 150k:
Chillum:
4.8% (157)
Maryland:
6.0% (5,327)
Number of families with income $150k - 200k:
Chillum:
8.7% (286)
Maryland:
7.9% (7,065)
Number of families with income > $200k:
Chillum:
4.9% (160)
State:
6.7% (6,005)
Median non-family income in Chillum in 2022:
Chillum:
$63,019
Maryland:
$52,100
Change in median non-family income between 2000 and 2022:
Chillum, Maryland:
+123.4%
State:
+64.2%
Median per capita income in Chillum in 2022:
Chillum:
$20,938
State:
$24,415
Change in median per capita income between 2000 and 2022:
Chillum, Maryland:
+95.0%
State:
+73.6%
Discuss Chillum, Maryland (MD) on our hugely popular Maryland forum.