The median household income in Chillicothe, IL in 2022 was $60,926, which was 25.9% less than the median annual income of $76,708 across the entire state of Illinois. Compared to the median income of $40,697 in 2000 this represents an increase of 33.2%. The per capita income in 2022 was $35,752, which means an increase of 38.1% compared to 2000 when it was $22,118.
Whole page based on the data from 2000 / 2022 when the population of Chillicothe, Illinois was 5,996 / 6,035
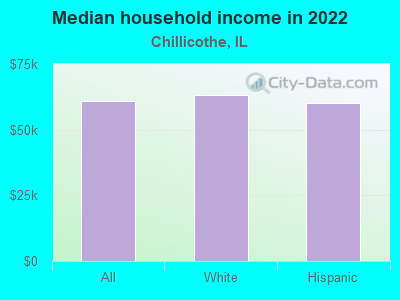
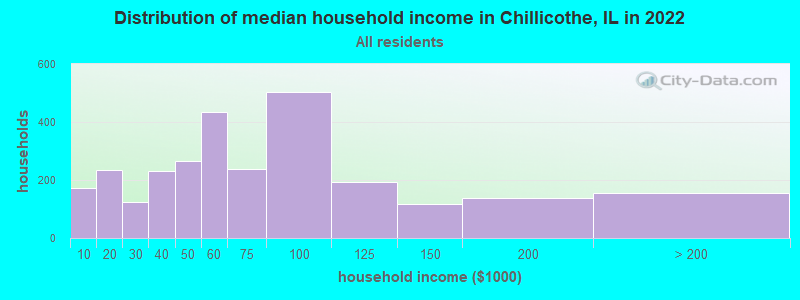
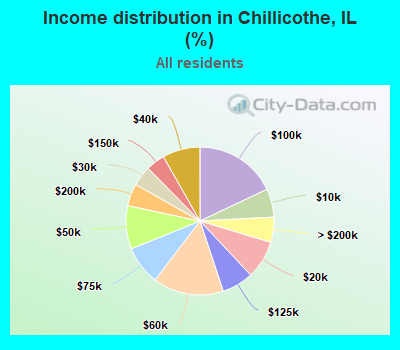
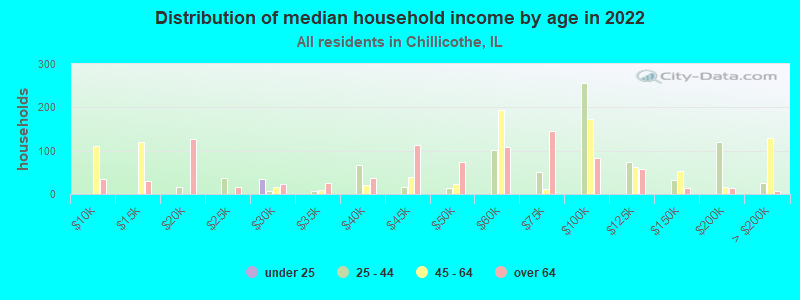
Income statistics for all residents
Median household income in Chillicothe, IL in 2022:
Chillicothe:
$60,926
State:
$76,708
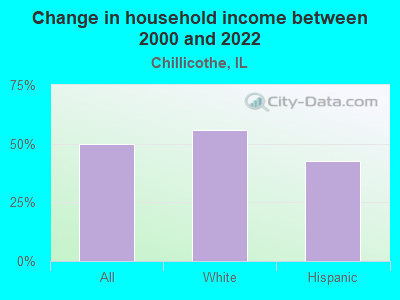
Change in median household income between 2000 and 2022:
Chillicothe, Illinois:
+49.7%
Illinois:
+64.6%
Number of households with income < $10k:
Chillicothe:
6.2% (174)
State:
5.9% (296,090)
Number of households with income $10k - 20k:
Chillicothe:
8.3% (234)
State:
6.6% (333,259)
Number of households with income $20k - 30k:
Chillicothe:
4.4% (124)
Illinois:
6.8% (342,921)
Number of households with income $30k - 40k:
Chillicothe:
8.2% (231)
Illinois:
7.0% (355,254)
Number of households with income $40k - 50k:
Chillicothe:
9.5% (266)
State:
6.7% (340,678)
Number of households with income $50k - 60k:
Chillicothe:
15.5% (434)
State:
6.7% (339,405)
Number of households with income $60k - 75k:
Chillicothe:
8.5% (239)
State:
9.2% (465,709)
Number of households with income $75k - 100k:
Chillicothe:
18.0% (505)
Illinois:
12.9% (651,353)
Number of households with income $100k - 125k:
Chillicothe:
6.9% (194)
State:
10.3% (522,359)
Number of households with income $125k - 150k:
Chillicothe:
4.1% (116)
State:
7.3% (367,136)
Number of households with income $150k - 200k:
Chillicothe:
4.9% (137)
State:
9.0% (455,249)
Number of households with income > $200k:
Chillicothe:
5.5% (155)
Illinois:
11.6% (586,947)
Aggregate household income in Chillicothe in 2022: $218,426,809
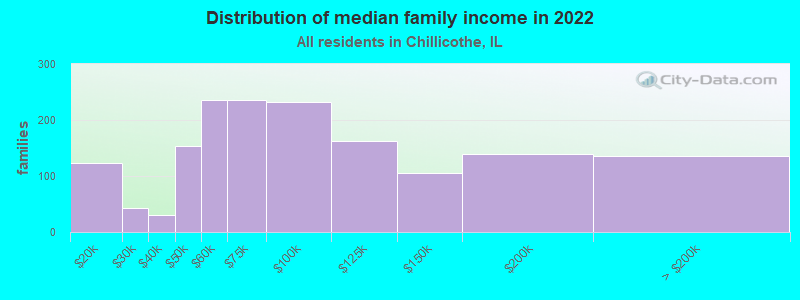
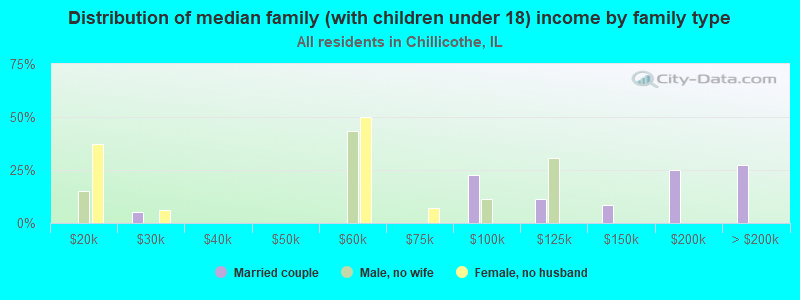
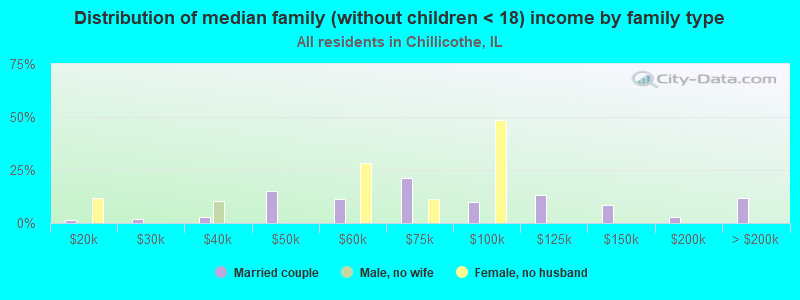
Median family income in Chillicothe in 2022:
Chillicothe:
$74,921
State:
$96,948
Number of families with income $10k - 20k:
Chillicothe:
7.7% (123)
State:
3.3% (105,017)
Number of families with income $20k - 30k:
Chillicothe:
2.7% (42)
Illinois:
4.7% (146,403)
Number of families with income $30k - 40k:
Chillicothe:
1.9% (30)
State:
5.3% (167,069)
Number of families with income $40k - 50k:
Chillicothe:
9.7% (154)
State:
5.8% (181,164)
Number of families with income $50k - 60k:
Chillicothe:
14.8% (236)
State:
6.1% (191,561)
Number of families with income $60k - 75k:
Chillicothe:
14.8% (235)
State:
9.0% (282,985)
Number of families with income $75k - 100k:
Chillicothe:
14.6% (232)
Illinois:
13.8% (432,725)
Number of families with income $100k - 125k:
Chillicothe:
10.1% (162)
State:
11.9% (373,296)
Number of families with income $125k - 150k:
Chillicothe:
6.6% (105)
Illinois:
8.9% (279,791)
Number of families with income $150k - 200k:
Chillicothe:
8.8% (140)
State:
11.9% (372,004)
Number of families with income > $200k:
Chillicothe:
8.5% (135)
State:
15.9% (500,033)
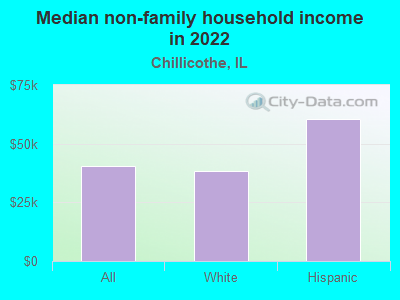
Median non-family income in Chillicothe in 2022:
Chillicothe:
$40,576
State:
$46,533
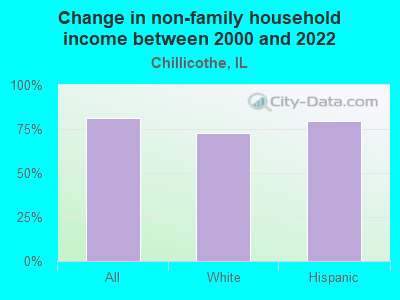
Change in median non-family income between 2000 and 2022:
Chillicothe, Illinois:
+81.3%
State:
+64.0%
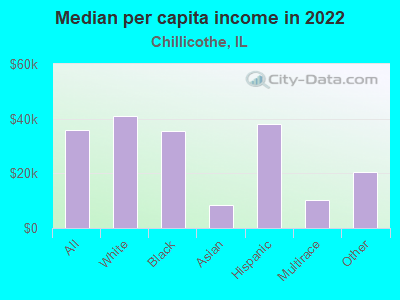
Median per capita income in Chillicothe in 2022:
Chillicothe:
$35,752
State:
$43,317
Change in median per capita income between 2000 and 2022:
Chillicothe, Illinois:
+61.6%
State:
+87.5%
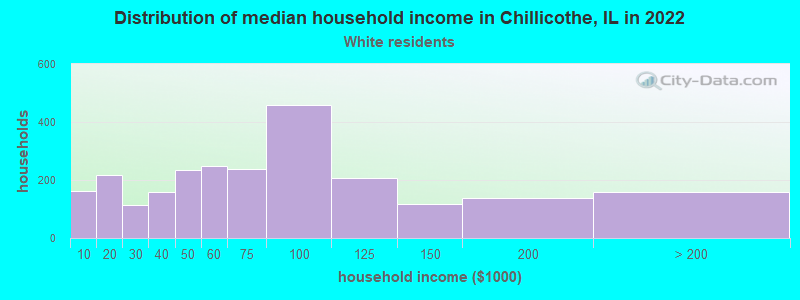
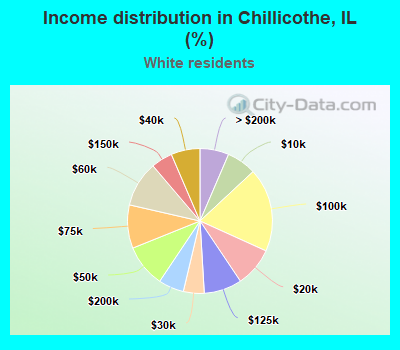
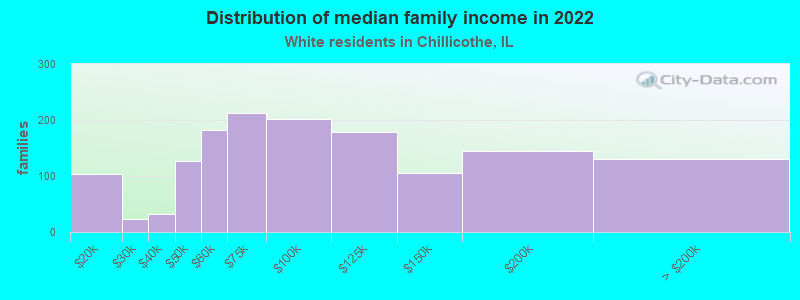
Income statistics for White residents
Median household income in Chillicothe, IL in 2022:
Chillicothe:
$63,263
Illinois:
$83,346
Change in median household income between 2000 and 2022:
Chillicothe, Illinois:
+55.9%
State:
+67.5%
Number of households with income < $10k:
Chillicothe:
6.6% (162)
Illinois:
4.5% (149,895)
Number of households with income $10k - 20k:
Chillicothe:
8.8% (216)
State:
5.5% (184,529)
Number of households with income $20k - 30k:
Chillicothe:
4.7% (114)
Illinois:
6.1% (205,767)
Number of households with income $30k - 40k:
Chillicothe:
6.5% (158)
State:
6.7% (225,572)
Number of households with income $40k - 50k:
Chillicothe:
9.5% (233)
State:
6.5% (216,965)
Number of households with income $50k - 60k:
Chillicothe:
10.2% (249)
State:
6.6% (222,841)
Number of households with income $60k - 75k:
Chillicothe:
9.7% (237)
State:
9.3% (312,758)
Number of households with income $75k - 100k:
Chillicothe:
18.7% (458)
State:
12.9% (433,180)
Number of households with income $100k - 125k:
Chillicothe:
8.5% (207)
State:
10.7% (360,753)
Number of households with income $125k - 150k:
Chillicothe:
4.8% (117)
State:
7.9% (266,532)
Number of households with income $150k - 200k:
Chillicothe:
5.7% (139)
Illinois:
10.0% (337,357)
Number of households with income > $200k:
Chillicothe:
6.5% (158)
State:
13.3% (446,069)
Aggregate household income in Chillicothe in 2022: $209,451,780
Median family income in Chillicothe in 2022:
Chillicothe:
$78,934
State:
$107,938
Number of families with income $10k - 20k:
Chillicothe:
7.2% (103)
State:
2.5% (50,574)
Number of families with income $20k - 30k:
Chillicothe:
1.6% (23)
State:
3.5% (70,927)
Number of families with income $30k - 40k:
Chillicothe:
2.2% (32)
State:
4.4% (90,563)
Number of families with income $40k - 50k:
Chillicothe:
8.8% (126)
Illinois:
5.0% (102,597)
Number of families with income $50k - 60k:
Chillicothe:
12.7% (182)
State:
5.8% (119,129)
Number of families with income $60k - 75k:
Chillicothe:
14.7% (212)
State:
8.8% (179,665)
Number of families with income $75k - 100k:
Chillicothe:
14.0% (201)
State:
13.5% (276,887)
Number of families with income $100k - 125k:
Chillicothe:
12.4% (178)
Illinois:
12.5% (256,099)
Number of families with income $125k - 150k:
Chillicothe:
7.3% (105)
Illinois:
9.8% (199,855)
Number of families with income $150k - 200k:
Chillicothe:
10.1% (145)
State:
13.4% (274,569)
Number of families with income > $200k:
Chillicothe:
9.0% (130)
State:
18.6% (381,354)
Median non-family income in Chillicothe in 2022:
Chillicothe:
$38,374
Illinois:
$50,934
Change in median non-family income between 2000 and 2022:
Chillicothe, Illinois:
+72.7%
Illinois:
+70.7%
Median per capita income in Chillicothe in 2022:
Chillicothe:
$41,123
Illinois:
$50,738
Change in median per capita income between 2000 and 2022:
Chillicothe, Illinois:
+85.9%
State:
+95.5%
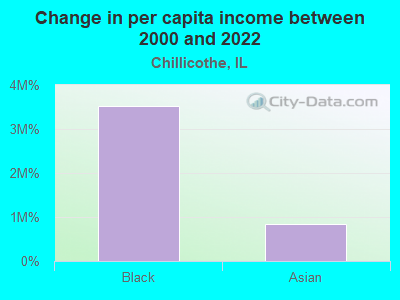
Income statistics for Black or African American residents
Median per capita income in Chillicothe in 2022:
Chillicothe:
$35,341
Illinois:
$28,045
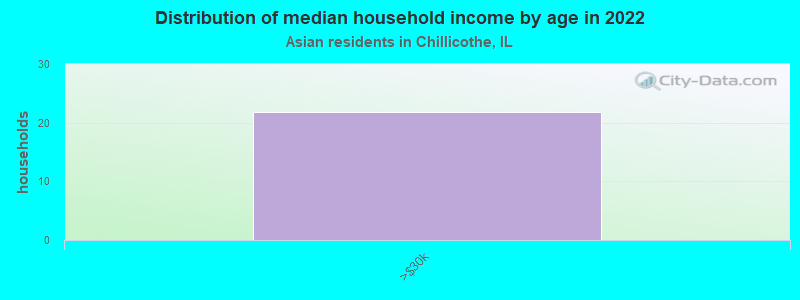
Income statistics for Asian residents
Number of households with income < $10k:
Chillicothe:
0.0% (0)
State:
5.3% (14,653)
Number of households with income $10k - 20k:
Chillicothe:
0.0% (0)
State:
4.5% (12,283)
Number of households with income $20k - 30k:
Chillicothe:
100.0% (20)
State:
4.8% (13,135)
Number of households with income $30k - 40k:
Chillicothe:
0.0% (0)
State:
5.0% (13,655)
Number of households with income $40k - 50k:
Chillicothe:
0.0% (0)
Illinois:
4.5% (12,357)
Number of households with income $50k - 60k:
Chillicothe:
0.0% (0)
State:
4.9% (13,568)
Number of households with income $60k - 75k:
Chillicothe:
0.0% (0)
State:
7.1% (19,606)
Number of households with income $75k - 100k:
Chillicothe:
0.0% (0)
Illinois:
12.1% (33,349)
Number of households with income $100k - 125k:
Chillicothe:
0.0% (0)
State:
9.7% (26,669)
Number of households with income $125k - 150k:
Chillicothe:
0.0% (0)
Illinois:
7.3% (20,172)
Number of households with income $150k - 200k:
Chillicothe:
0.0% (0)
State:
11.5% (31,711)
Number of households with income > $200k:
Chillicothe:
0.0% (0)
Illinois:
23.1% (63,411)
Median per capita income in Chillicothe in 2022:
Chillicothe:
$8,383
Illinois:
$52,977
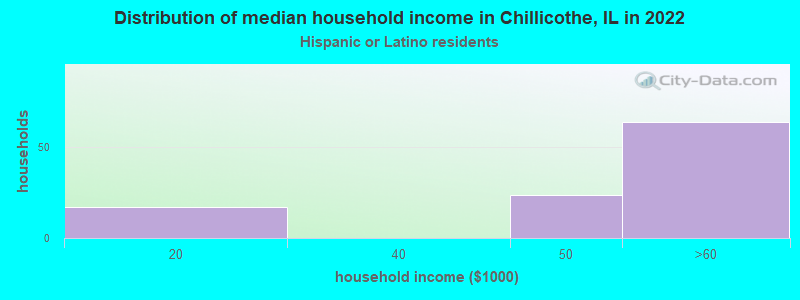
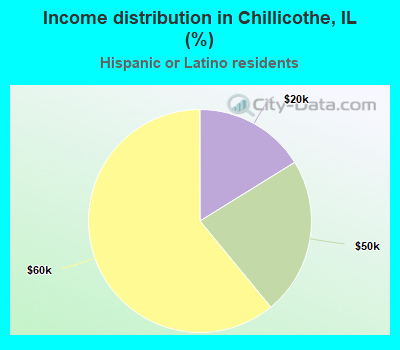
Income statistics for Hispanic or Latino residents
Median household income in Chillicothe, IL in 2022:
Chillicothe:
$60,133
State:
$72,139
Change in median household income between 2000 and 2022:
Chillicothe, Illinois:
+42.5%
Illinois:
+75.7%
Number of households with income < $10k:
Chillicothe:
0.0% (0)
State:
4.9% (33,145)
Number of households with income $10k - 20k:
Chillicothe:
16.2% (17)
State:
5.4% (36,345)
Number of households with income $20k - 30k:
Chillicothe:
0.0% (0)
State:
7.5% (50,677)
Number of households with income $30k - 40k:
Chillicothe:
0.0% (0)
Illinois:
7.7% (52,008)
Number of households with income $40k - 50k:
Chillicothe:
22.9% (24)
State:
8.1% (54,702)
Number of households with income $50k - 60k:
Chillicothe:
61.0% (64)
State:
7.5% (51,062)
Number of households with income $60k - 75k:
Chillicothe:
0.0% (0)
Illinois:
11.3% (76,576)
Number of households with income $75k - 100k:
Chillicothe:
0.0% (0)
State:
15.5% (105,152)
Number of households with income $100k - 125k:
Chillicothe:
0.0% (0)
Illinois:
11.5% (77,760)
Number of households with income $125k - 150k:
Chillicothe:
0.0% (0)
State:
7.3% (49,310)
Number of households with income $150k - 200k:
Chillicothe:
0.0% (0)
State:
7.6% (51,233)
Number of households with income > $200k:
Chillicothe:
0.0% (0)
State:
5.9% (40,028)
Aggregate household income in Chillicothe in 2022: $5,809,594
Median non-family income in Chillicothe in 2022:
Chillicothe:
$60,679
State:
$45,965
Change in median non-family income between 2000 and 2022:
Chillicothe, Illinois:
+79.8%
State:
+75.9%
Median per capita income in Chillicothe in 2022:
Chillicothe:
$37,977
Illinois:
$26,551
Change in median per capita income between 2000 and 2022:
Chillicothe, Illinois:
+143.2%
Illinois:
+111.0%
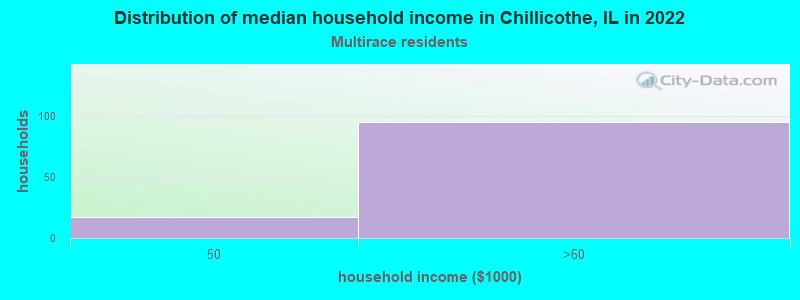
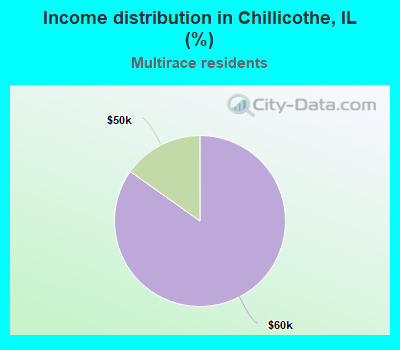
Income statistics for Multirace residents
Number of households with income < $10k:
Chillicothe:
0.0% (0)
State:
5.3% (21,595)
Number of households with income $10k - 20k:
Chillicothe:
0.0% (0)
Illinois:
6.5% (26,720)
Number of households with income $20k - 30k:
Chillicothe:
0.0% (0)
Illinois:
8.0% (32,573)
Number of households with income $30k - 40k:
Chillicothe:
0.0% (0)
State:
8.4% (34,383)
Number of households with income $40k - 50k:
Chillicothe:
15.2% (17)
State:
7.4% (30,234)
Number of households with income $50k - 60k:
Chillicothe:
84.8% (95)
State:
6.9% (28,432)
Number of households with income $60k - 75k:
Chillicothe:
0.0% (0)
State:
10.2% (41,780)
Number of households with income $75k - 100k:
Chillicothe:
0.0% (0)
Illinois:
13.0% (53,426)
Number of households with income $100k - 125k:
Chillicothe:
0.0% (0)
Illinois:
10.5% (43,126)
Number of households with income $125k - 150k:
Chillicothe:
0.0% (0)
State:
7.6% (31,153)
Number of households with income $150k - 200k:
Chillicothe:
0.0% (0)
State:
7.6% (30,946)
Number of households with income > $200k:
Chillicothe:
0.0% (0)
Illinois:
8.6% (35,208)
Aggregate household income in Chillicothe in 2022: $9,849,453
Median per capita income in Chillicothe in 2022:
Chillicothe:
$10,245
Illinois:
$29,285
Change in median per capita income between 2000 and 2022:: -46.9%
Chillicothe, Illinois:
-46.9%
State:
+112.9%
Income statistics for other residents
Number of households with income < $10k:
Chillicothe:
0.0% (0)
State:
5.7% (16,383)
Number of households with income $10k - 20k:
Chillicothe:
100.0% (21)
State:
4.8% (13,886)
Number of households with income $20k - 30k:
Chillicothe:
0.0% (0)
Illinois:
7.0% (20,054)
Number of households with income $30k - 40k:
Chillicothe:
0.0% (0)
State:
7.0% (20,038)
Number of households with income $40k - 50k:
Chillicothe:
0.0% (0)
State:
8.3% (23,759)
Number of households with income $50k - 60k:
Chillicothe:
0.0% (0)
State:
7.8% (22,410)
Number of households with income $60k - 75k:
Chillicothe:
0.0% (0)
Illinois:
12.0% (34,448)
Number of households with income $75k - 100k:
Chillicothe:
0.0% (0)
Illinois:
16.2% (46,508)
Number of households with income $100k - 125k:
Chillicothe:
0.0% (0)
State:
12.5% (35,952)
Number of households with income $125k - 150k:
Chillicothe:
0.0% (0)
Illinois:
6.9% (19,732)
Number of households with income $150k - 200k:
Chillicothe:
0.0% (0)
State:
7.5% (21,422)
Number of households with income > $200k:
Chillicothe:
0.0% (0)
Illinois:
4.3% (12,194)
Aggregate household income in Chillicothe in 2022: $2,599,354
Median per capita income in Chillicothe in 2022:
Chillicothe:
$20,441
State:
$25,392
Change in median per capita income between 2000 and 2022:: -24.9%
Chillicothe, Illinois:
-24.9%
State:
+117.4%
Discuss Chillicothe, Illinois (IL) on our hugely popular Illinois forum.