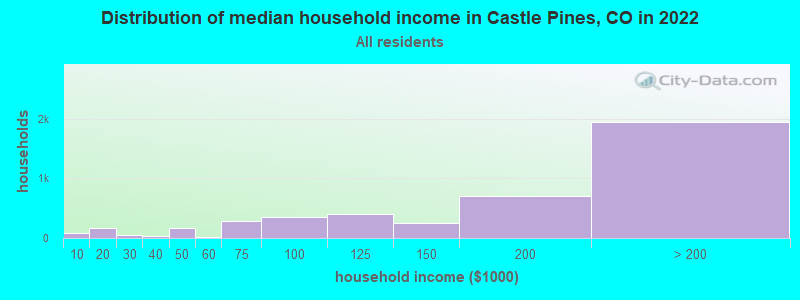
The median household income in Castle Pines, CO in 2022 was $190,632, which was 53.2% greater than the median annual income of $89,302 across the entire state of Colorado. Compared to the median income of $138,035 in 2000 this represents an increase of 27.6%. The per capita income in 2022 was $80,037, which means an increase of 12.0% compared to 2000 when it was $70,456.
Whole page based on the data from 2000 / 2022 when the population of Castle Pines, Colorado was 5,958 / 12,328
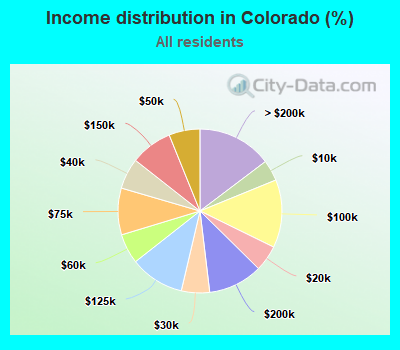
Income statistics for all residents
Median household income in Castle Pines, CO in 2022:
Castle Pines:
$190,632
State:
$89,302
Change in median household income between 2000 and 2022:
Castle Pines, Colorado:
+38.1%
Colorado:
+89.2%
Number of households with income < $10k:
Castle Pines:
1.8% (82)
State:
4.1% (98,418)
Number of households with income $10k - 20k:
Castle Pines:
3.9% (176)
State:
5.1% (122,364)
Number of households with income $20k - 30k:
Castle Pines:
1.1% (50)
State:
5.6% (132,834)
Number of households with income $30k - 40k:
Castle Pines:
0.8% (34)
State:
6.1% (144,999)
Number of households with income $40k - 50k:
Castle Pines:
3.8% (170)
Colorado:
6.1% (145,852)
Number of households with income $50k - 60k:
Castle Pines:
0.5% (23)
Colorado:
5.9% (140,683)
Number of households with income $60k - 75k:
Castle Pines:
6.2% (279)
State:
9.2% (219,992)
Number of households with income $75k - 100k:
Castle Pines:
8.0% (359)
Colorado:
13.4% (319,980)
Number of households with income $100k - 125k:
Castle Pines:
8.9% (399)
Colorado:
10.7% (255,638)
Number of households with income $125k - 150k:
Castle Pines:
5.5% (245)
Colorado:
8.3% (197,264)
Number of households with income $150k - 200k:
Castle Pines:
15.9% (709)
State:
10.7% (255,855)
Number of households with income > $200k:
Castle Pines:
43.5% (1,947)
Colorado:
14.7% (350,705)
Aggregate household income in Castle Pines in 2022: $974,489,889
Median family income in Castle Pines in 2022:
Castle Pines:
$191,402
State:
$109,592
Number of families with income < $10k:
Castle Pines:
2.1% (77)
Colorado:
2.3% (33,392)
Number of families with income $10k - 20k:
Castle Pines:
2.9% (108)
State:
2.4% (35,605)
Number of families with income $20k - 30k:
Castle Pines:
0.5% (19)
State:
3.6% (53,136)
Number of families with income $30k - 40k:
Castle Pines:
0.5% (19)
Colorado:
4.5% (66,614)
Number of families with income $40k - 50k:
Castle Pines:
2.0% (74)
State:
4.8% (69,768)
Number of families with income $50k - 60k:
Castle Pines:
0.6% (24)
State:
5.0% (72,561)
Number of families with income $60k - 75k:
Castle Pines:
4.5% (166)
State:
8.6% (126,177)
Number of families with income $75k - 100k:
Castle Pines:
6.3% (234)
State:
13.6% (199,298)
Number of families with income $100k - 125k:
Castle Pines:
10.1% (374)
State:
12.2% (178,336)
Number of families with income $125k - 150k:
Castle Pines:
6.1% (226)
Colorado:
9.8% (142,860)
Number of families with income $150k - 200k:
Castle Pines:
18.1% (673)
State:
13.6% (198,844)
Number of families with income > $200k:
Castle Pines:
46.4% (1,727)
State:
19.6% (287,591)
Median non-family income in Castle Pines in 2022:
Castle Pines:
$91,000
State:
$57,553
Change in median non-family income between 2000 and 2022:: -7.5%
Castle Pines, Colorado:
-7.5%
State:
+87.3%
Median per capita income in Castle Pines in 2022:
Castle Pines:
$80,038
State:
$49,071
Change in median per capita income between 2000 and 2022:
Castle Pines, Colorado:
+13.6%
State:
+104.0%
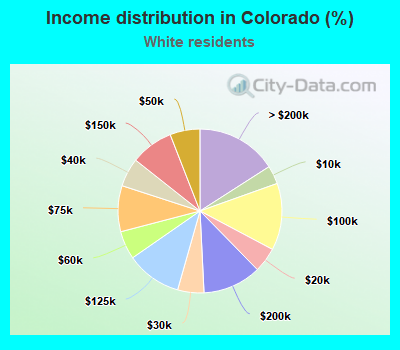
Income statistics for White residents
Median household income in Castle Pines, CO in 2022:
Castle Pines:
$189,522
State:
$93,728
Change in median household income between 2000 and 2022:
Castle Pines, Colorado:
+36.3%
Colorado:
+89.9%
Number of households with income < $10k:
Castle Pines:
2.3% (87)
State:
3.6% (65,804)
Number of households with income $10k - 20k:
Castle Pines:
1.1% (43)
State:
4.9% (89,486)
Number of households with income $20k - 30k:
Castle Pines:
1.2% (46)
State:
5.2% (94,191)
Number of households with income $30k - 40k:
Castle Pines:
1.0% (37)
State:
5.7% (102,893)
Number of households with income $40k - 50k:
Castle Pines:
4.3% (165)
Colorado:
5.9% (107,296)
Number of households with income $50k - 60k:
Castle Pines:
0.6% (22)
State:
5.6% (101,466)
Number of households with income $60k - 75k:
Castle Pines:
7.0% (269)
Colorado:
9.1% (164,790)
Number of households with income $75k - 100k:
Castle Pines:
8.6% (329)
State:
13.2% (240,038)
Number of households with income $100k - 125k:
Castle Pines:
8.7% (332)
Colorado:
10.9% (198,757)
Number of households with income $125k - 150k:
Castle Pines:
4.7% (180)
State:
8.4% (153,274)
Number of households with income $150k - 200k:
Castle Pines:
15.6% (596)
State:
11.5% (209,587)
Number of households with income > $200k:
Castle Pines:
45.0% (1,726)
State:
15.9% (289,583)
Aggregate household income in Castle Pines in 2022: $861,377,129
Median family income in Castle Pines in 2022:
Castle Pines:
$200,048
Colorado:
$118,609
Number of families with income < $10k:
Castle Pines:
2.4% (75)
State:
1.8% (19,398)
Number of families with income $20k - 30k:
Castle Pines:
0.6% (20)
State:
3.0% (32,904)
Number of families with income $30k - 40k:
Castle Pines:
0.6% (19)
Colorado:
3.9% (43,092)
Number of families with income $40k - 50k:
Castle Pines:
2.1% (67)
State:
4.4% (47,667)
Number of families with income $50k - 60k:
Castle Pines:
0.6% (18)
Colorado:
4.3% (47,498)
Number of families with income $60k - 75k:
Castle Pines:
4.8% (150)
State:
7.9% (85,731)
Number of families with income $75k - 100k:
Castle Pines:
6.4% (200)
State:
13.1% (143,181)
Number of families with income $100k - 125k:
Castle Pines:
9.5% (300)
State:
12.4% (135,853)
Number of families with income $125k - 150k:
Castle Pines:
5.0% (158)
State:
10.2% (110,909)
Number of families with income $150k - 200k:
Castle Pines:
18.7% (587)
State:
15.0% (163,392)
Number of families with income > $200k:
Castle Pines:
49.2% (1,543)
State:
22.0% (239,847)
Median non-family income in Castle Pines in 2022:
Castle Pines:
$86,516
Colorado:
$60,225
Change in median non-family income between 2000 and 2022:: -12.1%
Castle Pines, Colorado:
-12.1%
Colorado:
+92.3%
Median per capita income in Castle Pines in 2022:
Castle Pines:
$89,386
Colorado:
$55,103
Change in median per capita income between 2000 and 2022:
Castle Pines, Colorado:
+25.3%
Colorado:
+112.2%
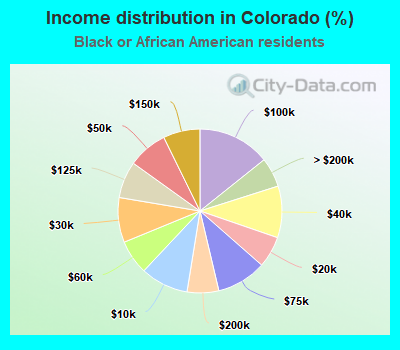
Income statistics for Black or African American residents
Number of households with income < $10k:
Castle Pines:
0.0% (0)
Colorado:
9.4% (8,425)
Number of households with income $10k - 20k:
Castle Pines:
50.9% (59)
State:
6.2% (5,512)
Number of households with income $20k - 30k:
Castle Pines:
0.0% (0)
State:
8.8% (7,891)
Number of households with income $30k - 40k:
Castle Pines:
0.0% (0)
Colorado:
10.2% (9,093)
Number of households with income $40k - 50k:
Castle Pines:
0.0% (0)
State:
7.8% (6,972)
Number of households with income $50k - 60k:
Castle Pines:
0.0% (0)
State:
6.8% (6,065)
Number of households with income $60k - 75k:
Castle Pines:
0.0% (0)
Colorado:
9.8% (8,769)
Number of households with income $75k - 100k:
Castle Pines:
0.0% (0)
State:
14.3% (12,733)
Number of households with income $100k - 125k:
Castle Pines:
0.0% (0)
Colorado:
7.3% (6,469)
Number of households with income $125k - 150k:
Castle Pines:
0.0% (0)
State:
7.3% (6,483)
Number of households with income $150k - 200k:
Castle Pines:
0.0% (0)
State:
6.2% (5,571)
Number of households with income > $200k:
Castle Pines:
49.1% (57)
State:
5.8% (5,184)
Aggregate household income in Castle Pines in 2022: $13,416,309
Median per capita income in Castle Pines in 2022:
Castle Pines:
$27,788
State:
$31,796
Change in median per capita income between 2000 and 2022:: -48.9%
Castle Pines, Colorado:
-48.9%
State:
+78.2%
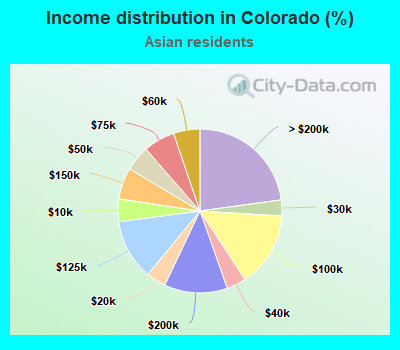
Income statistics for Asian residents
Median household income in Castle Pines, CO in 2022:
Castle Pines:
$161,146
Colorado:
$105,863
Change in median household income between 2000 and 2022:: -19.4%
Castle Pines, Colorado:
-19.4%
State:
+117.7%
Number of households with income < $10k:
Castle Pines:
0.0% (0)
State:
4.5% (2,969)
Number of households with income $10k - 20k:
Castle Pines:
6.2% (9)
Colorado:
3.9% (2,588)
Number of households with income $20k - 30k:
Castle Pines:
0.0% (0)
Colorado:
3.2% (2,095)
Number of households with income $30k - 40k:
Castle Pines:
0.0% (0)
State:
3.8% (2,550)
Number of households with income $40k - 50k:
Castle Pines:
0.0% (0)
State:
5.0% (3,296)
Number of households with income $50k - 60k:
Castle Pines:
0.0% (0)
State:
5.2% (3,455)
Number of households with income $60k - 75k:
Castle Pines:
0.0% (0)
State:
6.2% (4,123)
Number of households with income $75k - 100k:
Castle Pines:
0.0% (0)
State:
14.8% (9,789)
Number of households with income $100k - 125k:
Castle Pines:
18.8% (27)
State:
11.9% (7,917)
Number of households with income $125k - 150k:
Castle Pines:
29.2% (42)
Colorado:
6.2% (4,125)
Number of households with income $150k - 200k:
Castle Pines:
22.2% (32)
State:
12.5% (8,268)
Number of households with income > $200k:
Castle Pines:
23.6% (34)
State:
22.8% (15,156)
Aggregate household income in Castle Pines in 2022: $36,295,709
Median family income in Castle Pines in 2022:
Castle Pines:
$156,944
State:
$131,786
Number of families with income $100k - 125k:
Castle Pines:
19.3% (25)
State:
12.4% (5,364)
Number of families with income $125k - 150k:
Castle Pines:
30.0% (39)
State:
6.9% (2,983)
Number of families with income $150k - 200k:
Castle Pines:
23.3% (30)
Colorado:
14.0% (6,037)
Number of families with income > $200k:
Castle Pines:
27.4% (36)
State:
30.5% (13,159)
Median per capita income in Castle Pines in 2022:
Castle Pines:
$81,726
State:
$54,724
Change in median per capita income between 2000 and 2022:
Castle Pines, Colorado:
+7.7%
Colorado:
+161.1%
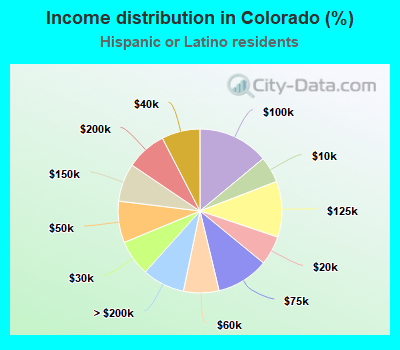
Income statistics for Hispanic or Latino residents
Median household income in Castle Pines, CO in 2022:
Castle Pines:
$132,884
State:
$72,989
Change in median household income between 2000 and 2022:
Castle Pines, Colorado:
+17.4%
State:
+110.1%
Number of households with income < $10k:
Castle Pines:
0.0% (0)
State:
5.2% (21,051)
Number of households with income $10k - 20k:
Castle Pines:
0.0% (0)
Colorado:
5.8% (23,416)
Number of households with income $20k - 30k:
Castle Pines:
0.0% (0)
State:
7.1% (28,877)
Number of households with income $30k - 40k:
Castle Pines:
0.0% (0)
Colorado:
7.6% (30,782)
Number of households with income $40k - 50k:
Castle Pines:
3.1% (6)
Colorado:
8.2% (33,247)
Number of households with income $50k - 60k:
Castle Pines:
0.0% (0)
State:
7.0% (28,435)
Number of households with income $60k - 75k:
Castle Pines:
16.0% (31)
Colorado:
10.3% (41,925)
Number of households with income $75k - 100k:
Castle Pines:
17.5% (34)
State:
14.0% (56,755)
Number of households with income $100k - 125k:
Castle Pines:
12.9% (25)
State:
11.0% (44,664)
Number of households with income $125k - 150k:
Castle Pines:
10.8% (21)
State:
7.5% (30,503)
Number of households with income $150k - 200k:
Castle Pines:
16.5% (32)
Colorado:
8.0% (32,311)
Number of households with income > $200k:
Castle Pines:
23.2% (45)
Colorado:
8.4% (34,000)
Aggregate household income in Castle Pines in 2022: $28,853,869
Median family income in Castle Pines in 2022:
Castle Pines:
$142,948
Colorado:
$80,638
Number of families with income $60k - 75k:
Castle Pines:
11.6% (22)
Colorado:
11.8% (33,620)
Number of families with income $75k - 100k:
Castle Pines:
21.9% (41)
State:
15.2% (43,334)
Number of families with income $100k - 125k:
Castle Pines:
13.2% (25)
State:
12.1% (34,536)
Number of families with income $125k - 150k:
Castle Pines:
11.6% (22)
State:
8.2% (23,333)
Number of families with income $150k - 200k:
Castle Pines:
12.8% (24)
State:
8.5% (24,345)
Number of families with income > $200k:
Castle Pines:
28.9% (54)
State:
9.3% (26,653)
Median per capita income in Castle Pines in 2022:
Castle Pines:
$32,834
State:
$29,910
Change in median per capita income between 2000 and 2022:
Castle Pines, Colorado:
+47.0%
State:
+129.4%
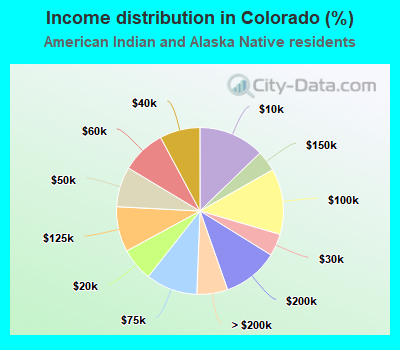
Income statistics for American Indian and Alaska Native residents
Number of households with income < $10k:
Castle Pines:
0.0% (0)
Colorado:
12.8% (3,323)
Number of households with income $10k - 20k:
Castle Pines:
0.0% (0)
Colorado:
6.4% (1,674)
Number of households with income $20k - 30k:
Castle Pines:
0.0% (0)
State:
4.3% (1,122)
Number of households with income $30k - 40k:
Castle Pines:
0.0% (0)
State:
7.8% (2,034)
Number of households with income $40k - 50k:
Castle Pines:
0.0% (0)
State:
7.8% (2,021)
Number of households with income $50k - 60k:
Castle Pines:
0.0% (0)
State:
8.6% (2,227)
Number of households with income $60k - 75k:
Castle Pines:
0.0% (0)
State:
10.0% (2,599)
Number of households with income $75k - 100k:
Castle Pines:
0.0% (0)
State:
12.7% (3,308)
Number of households with income $100k - 125k:
Castle Pines:
0.0% (0)
State:
8.8% (2,280)
Number of households with income $125k - 150k:
Castle Pines:
0.0% (0)
State:
4.0% (1,046)
Number of households with income $150k - 200k:
Castle Pines:
70.0% (14)
Colorado:
10.8% (2,805)
Number of households with income > $200k:
Castle Pines:
30.0% (6)
State:
6.0% (1,559)
Median per capita income in Castle Pines in 2022:
Castle Pines:
$73,017
State:
$28,603
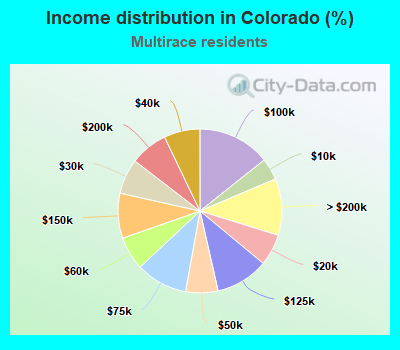
Income statistics for Multirace residents
Median household income in Castle Pines, CO in 2022:
Castle Pines:
$215,999
Colorado:
$79,392
Number of households with income < $10k:
Castle Pines:
0.0% (0)
State:
4.3% (11,635)
Number of households with income $10k - 20k:
Castle Pines:
0.0% (0)
Colorado:
6.3% (16,900)
Number of households with income $20k - 30k:
Castle Pines:
0.0% (0)
State:
6.9% (18,777)
Number of households with income $30k - 40k:
Castle Pines:
0.0% (0)
Colorado:
7.1% (19,229)
Number of households with income $40k - 50k:
Castle Pines:
0.0% (0)
Colorado:
6.4% (17,224)
Number of households with income $50k - 60k:
Castle Pines:
0.0% (0)
State:
6.6% (17,889)
Number of households with income $60k - 75k:
Castle Pines:
17.7% (44)
State:
10.2% (27,538)
Number of households with income $75k - 100k:
Castle Pines:
0.0% (0)
State:
14.3% (38,702)
Number of households with income $100k - 125k:
Castle Pines:
11.7% (29)
State:
10.4% (28,179)
Number of households with income $125k - 150k:
Castle Pines:
12.9% (32)
State:
8.9% (23,989)
Number of households with income $150k - 200k:
Castle Pines:
9.7% (24)
State:
7.4% (20,108)
Number of households with income > $200k:
Castle Pines:
48.0% (119)
Colorado:
11.2% (30,192)
Aggregate household income in Castle Pines in 2022: $42,183,490
Median family income in Castle Pines in 2022:
Castle Pines:
$177,621
Colorado:
$90,413
Number of families with income $60k - 75k:
Castle Pines:
17.5% (32)
Colorado:
11.1% (19,994)
Number of families with income $100k - 125k:
Castle Pines:
15.5% (28)
State:
11.7% (21,095)
Number of families with income $125k - 150k:
Castle Pines:
17.3% (32)
Colorado:
9.7% (17,506)
Number of families with income $150k - 200k:
Castle Pines:
13.0% (24)
State:
8.8% (15,827)
Number of families with income > $200k:
Castle Pines:
36.6% (67)
Colorado:
13.2% (23,768)
Median non-family income in Castle Pines in 2022:
Castle Pines:
$287,187
State:
$48,957
Median per capita income in Castle Pines in 2022:
Castle Pines:
$37,123
State:
$33,518
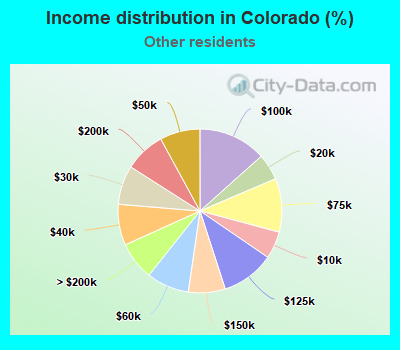
Income statistics for other residents
Median household income in Castle Pines, CO in 2022:
Castle Pines:
$115,293
State:
$69,579
Number of households with income < $10k:
Castle Pines:
0.0% (0)
Colorado:
5.4% (6,097)
Number of households with income $10k - 20k:
Castle Pines:
0.0% (0)
State:
5.2% (5,876)
Number of households with income $20k - 30k:
Castle Pines:
0.0% (0)
State:
7.7% (8,716)
Number of households with income $30k - 40k:
Castle Pines:
0.0% (0)
State:
8.1% (9,164)
Number of households with income $40k - 50k:
Castle Pines:
0.0% (0)
State:
7.9% (8,974)
Number of households with income $50k - 60k:
Castle Pines:
0.0% (0)
State:
8.4% (9,484)
Number of households with income $60k - 75k:
Castle Pines:
0.0% (0)
State:
10.6% (11,975)
Number of households with income $75k - 100k:
Castle Pines:
55.3% (47)
Colorado:
13.4% (15,160)
Number of households with income $100k - 125k:
Castle Pines:
27.1% (23)
State:
10.5% (11,839)
Number of households with income $125k - 150k:
Castle Pines:
0.0% (0)
State:
7.3% (8,255)
Number of households with income $150k - 200k:
Castle Pines:
0.0% (0)
Colorado:
8.0% (9,093)
Number of households with income > $200k:
Castle Pines:
17.6% (15)
Colorado:
7.5% (8,538)
Aggregate household income in Castle Pines in 2022: $9,320,299
Median family income in Castle Pines in 2022:
Castle Pines:
$62,467
Colorado:
$73,656
Number of families with income $75k - 100k:
Castle Pines:
53.6% (42)
Colorado:
13.7% (10,900)
Number of families with income $100k - 125k:
Castle Pines:
29.8% (23)
State:
11.5% (9,178)
Number of families with income > $200k:
Castle Pines:
16.6% (13)
State:
7.4% (5,919)
Median per capita income in Castle Pines in 2022:
Castle Pines:
$27,199
State:
$30,433
Discuss Castle Pines, Colorado (CO) on our hugely popular Colorado forum.