The median household income in Bell Gardens, CA in 2022 was $53,356, which was 71.6% less than the median annual income of $91,551 across the entire state of California. Compared to the median income of $30,597 in 2000 this represents an increase of 42.7%. The per capita income in 2022 was $17,740, which means an increase of 52.6% compared to 2000 when it was $8,415.
Whole page based on the data from 2000 / 2022 when the population of Bell Gardens, California was 44,054 / 38,411
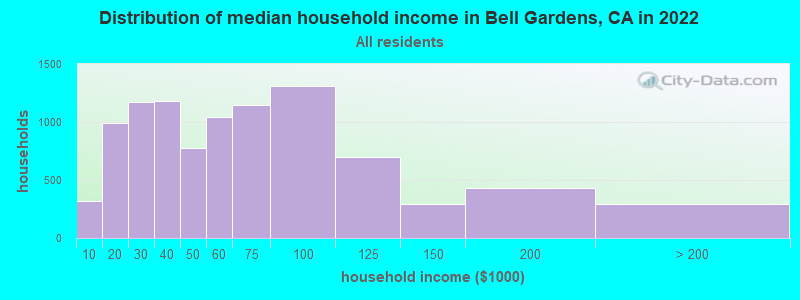
Income statistics for all residents
Median household income in Bell Gardens, CA in 2022:
Bell Gardens:
$53,356
California:
$91,551
Change in median household income between 2000 and 2022:
Bell Gardens, California:
+74.4%
State:
+92.8%
Number of households with income < $10k:
Bell Gardens:
3.3% (320)
State:
4.8% (654,370)
Number of households with income $10k - 20k:
Bell Gardens:
10.2% (988)
State:
5.8% (789,493)
Number of households with income $20k - 30k:
Bell Gardens:
12.1% (1,169)
California:
5.7% (778,318)
Number of households with income $30k - 40k:
Bell Gardens:
12.3% (1,185)
State:
5.8% (783,170)
Number of households with income $40k - 50k:
Bell Gardens:
8.1% (779)
State:
5.8% (781,352)
Number of households with income $50k - 60k:
Bell Gardens:
10.8% (1,043)
State:
5.6% (760,175)
Number of households with income $60k - 75k:
Bell Gardens:
11.9% (1,150)
State:
8.2% (1,104,699)
Number of households with income $75k - 100k:
Bell Gardens:
13.6% (1,313)
State:
12.0% (1,627,633)
Number of households with income $100k - 125k:
Bell Gardens:
7.2% (697)
State:
10.0% (1,358,619)
Number of households with income $125k - 150k:
Bell Gardens:
3.0% (294)
California:
7.6% (1,027,455)
Number of households with income $150k - 200k:
Bell Gardens:
4.5% (435)
State:
10.6% (1,439,811)
Number of households with income > $200k:
Bell Gardens:
3.0% (289)
State:
18.0% (2,445,491)
Aggregate household income in Bell Gardens in 2022: $638,428,278
Median family income in Bell Gardens in 2022:
Bell Gardens:
$51,768
California:
$104,823
Number of families with income < $10k:
Bell Gardens:
4.4% (359)
California:
3.1% (280,184)
Number of families with income $10k - 20k:
Bell Gardens:
9.7% (787)
California:
3.5% (322,064)
Number of families with income $20k - 30k:
Bell Gardens:
12.5% (1,017)
California:
4.7% (433,722)
Number of families with income $30k - 40k:
Bell Gardens:
12.9% (1,046)
State:
5.2% (478,213)
Number of families with income $40k - 50k:
Bell Gardens:
8.4% (687)
State:
5.6% (511,647)
Number of families with income $50k - 60k:
Bell Gardens:
11.5% (935)
State:
5.5% (498,926)
Number of families with income $60k - 75k:
Bell Gardens:
10.7% (872)
State:
8.0% (731,094)
Number of families with income $75k - 100k:
Bell Gardens:
12.5% (1,018)
State:
12.2% (1,115,621)
Number of families with income $100k - 125k:
Bell Gardens:
7.2% (588)
State:
10.5% (959,600)
Number of families with income $125k - 150k:
Bell Gardens:
3.7% (302)
State:
8.4% (768,725)
Number of families with income $150k - 200k:
Bell Gardens:
4.3% (348)
California:
11.9% (1,087,239)
Number of families with income > $200k:
Bell Gardens:
2.2% (182)
California:
21.5% (1,963,769)
Median non-family income in Bell Gardens in 2022:
Bell Gardens:
$28,598
State:
$59,348
Change in median non-family income between 2000 and 2022:
Bell Gardens, California:
+91.9%
State:
+85.3%
Median per capita income in Bell Gardens in 2022:
Bell Gardens:
$17,740
State:
$46,661
Change in median per capita income between 2000 and 2022:
Bell Gardens, California:
+110.8%
State:
+105.5%
Income statistics for White residents
Median household income in Bell Gardens, CA in 2022:
Bell Gardens:
$51,907
State:
$100,917
Change in median household income between 2000 and 2022:
Bell Gardens, California:
+71.5%
State:
+96.8%
Number of households with income < $10k:
Bell Gardens:
3.2% (100)
State:
4.4% (284,109)
Number of households with income $10k - 20k:
Bell Gardens:
11.1% (351)
California:
5.3% (340,330)
Number of households with income $20k - 30k:
Bell Gardens:
11.7% (369)
State:
5.3% (343,145)
Number of households with income $30k - 40k:
Bell Gardens:
13.8% (435)
California:
5.1% (330,146)
Number of households with income $40k - 50k:
Bell Gardens:
11.2% (354)
State:
5.2% (335,310)
Number of households with income $50k - 60k:
Bell Gardens:
10.1% (320)
California:
5.1% (326,299)
Number of households with income $60k - 75k:
Bell Gardens:
11.4% (361)
State:
7.6% (487,640)
Number of households with income $75k - 100k:
Bell Gardens:
9.0% (286)
State:
11.5% (736,578)
Number of households with income $100k - 125k:
Bell Gardens:
7.6% (239)
State:
10.1% (648,782)
Number of households with income $125k - 150k:
Bell Gardens:
3.2% (102)
State:
7.8% (499,671)
Number of households with income $150k - 200k:
Bell Gardens:
3.7% (118)
State:
11.4% (729,603)
Number of households with income > $200k:
Bell Gardens:
4.0% (127)
State:
21.2% (1,364,246)
Aggregate household income in Bell Gardens in 2022: $227,945,590
Median family income in Bell Gardens in 2022:
Bell Gardens:
$52,936
California:
$125,379
Number of families with income < $10k:
Bell Gardens:
4.3% (96)
State:
2.2% (87,079)
Number of families with income $10k - 20k:
Bell Gardens:
11.3% (252)
State:
2.5% (97,716)
Number of families with income $20k - 30k:
Bell Gardens:
12.9% (287)
State:
3.5% (137,295)
Number of families with income $30k - 40k:
Bell Gardens:
15.0% (334)
California:
3.9% (152,947)
Number of families with income $40k - 50k:
Bell Gardens:
8.0% (178)
State:
4.3% (169,197)
Number of families with income $50k - 60k:
Bell Gardens:
9.8% (219)
State:
4.5% (176,192)
Number of families with income $60k - 75k:
Bell Gardens:
11.1% (248)
State:
7.0% (274,752)
Number of families with income $75k - 100k:
Bell Gardens:
7.8% (174)
State:
11.3% (445,632)
Number of families with income $100k - 125k:
Bell Gardens:
8.3% (186)
State:
10.7% (423,630)
Number of families with income $125k - 150k:
Bell Gardens:
5.4% (120)
State:
9.1% (357,408)
Number of families with income $150k - 200k:
Bell Gardens:
3.9% (86)
California:
13.5% (532,693)
Number of families with income > $200k:
Bell Gardens:
2.2% (49)
California:
27.6% (1,086,948)
Median non-family income in Bell Gardens in 2022:
Bell Gardens:
$31,783
State:
$62,819
Change in median non-family income between 2000 and 2022:
Bell Gardens, California:
+113.4%
State:
+84.4%
Median per capita income in Bell Gardens in 2022:
Bell Gardens:
$19,777
State:
$61,706
Change in median per capita income between 2000 and 2022:
Bell Gardens, California:
+123.2%
State:
+122.7%
Income statistics for Black or African American residents
Number of households with income < $10k:
Bell Gardens:
14.4% (16)
State:
9.0% (73,219)
Number of households with income $10k - 20k:
Bell Gardens:
28.8% (32)
State:
10.6% (86,666)
Number of households with income $20k - 30k:
Bell Gardens:
12.6% (14)
State:
7.1% (57,719)
Number of households with income $30k - 40k:
Bell Gardens:
0.0% (0)
California:
7.2% (58,714)
Number of households with income $40k - 50k:
Bell Gardens:
0.0% (0)
State:
7.1% (58,075)
Number of households with income $50k - 60k:
Bell Gardens:
0.0% (0)
California:
6.8% (55,229)
Number of households with income $60k - 75k:
Bell Gardens:
0.0% (0)
State:
8.8% (71,895)
Number of households with income $75k - 100k:
Bell Gardens:
30.6% (34)
State:
11.9% (96,893)
Number of households with income $100k - 125k:
Bell Gardens:
13.5% (15)
State:
8.7% (70,729)
Number of households with income $125k - 150k:
Bell Gardens:
0.0% (0)
State:
6.3% (51,211)
Number of households with income $150k - 200k:
Bell Gardens:
0.0% (0)
California:
7.2% (58,687)
Number of households with income > $200k:
Bell Gardens:
0.0% (0)
State:
9.3% (75,487)
Aggregate household income in Bell Gardens in 2022: $5,923,201
Median per capita income in Bell Gardens in 2022:
Bell Gardens:
$16,601
State:
$36,708
Income statistics for Asian residents
Median household income in Bell Gardens, CA in 2022:
Bell Gardens:
$58,697
California:
$119,861
Change in median household income between 2000 and 2022:
Bell Gardens, California:
+65.3%
State:
+116.5%
Number of households with income < $10k:
Bell Gardens:
0.0% (0)
State:
5.1% (106,273)
Number of households with income $10k - 20k:
Bell Gardens:
0.0% (0)
State:
4.9% (101,815)
Number of households with income $20k - 30k:
Bell Gardens:
0.0% (0)
California:
4.6% (94,414)
Number of households with income $30k - 40k:
Bell Gardens:
22.9% (8)
State:
4.1% (84,491)
Number of households with income $40k - 50k:
Bell Gardens:
0.0% (0)
State:
4.0% (81,758)
Number of households with income $50k - 60k:
Bell Gardens:
31.4% (11)
State:
3.9% (80,971)
Number of households with income $60k - 75k:
Bell Gardens:
25.7% (9)
California:
6.0% (124,194)
Number of households with income $75k - 100k:
Bell Gardens:
0.0% (0)
State:
9.7% (200,337)
Number of households with income $100k - 125k:
Bell Gardens:
0.0% (0)
State:
9.4% (193,488)
Number of households with income $125k - 150k:
Bell Gardens:
0.0% (0)
State:
7.7% (158,253)
Number of households with income $150k - 200k:
Bell Gardens:
20.0% (7)
State:
12.2% (252,139)
Number of households with income > $200k:
Bell Gardens:
0.0% (0)
State:
28.4% (586,641)
Aggregate household income in Bell Gardens in 2022: $2,862,891
Median per capita income in Bell Gardens in 2022:
Bell Gardens:
$24,314
California:
$58,824
Income statistics for Hispanic or Latino residents
Median household income in Bell Gardens, CA in 2022:
Bell Gardens:
$54,357
California:
$75,698
Change in median household income between 2000 and 2022:
Bell Gardens, California:
+74.7%
California:
+107.2%
Number of households with income < $10k:
Bell Gardens:
3.1% (296)
State:
4.3% (183,294)
Number of households with income $10k - 20k:
Bell Gardens:
10.1% (945)
California:
6.0% (253,903)
Number of households with income $20k - 30k:
Bell Gardens:
11.9% (1,115)
State:
6.8% (286,386)
Number of households with income $30k - 40k:
Bell Gardens:
12.2% (1,149)
State:
7.4% (313,728)
Number of households with income $40k - 50k:
Bell Gardens:
8.1% (759)
California:
7.4% (313,199)
Number of households with income $50k - 60k:
Bell Gardens:
11.0% (1,037)
State:
7.2% (305,366)
Number of households with income $60k - 75k:
Bell Gardens:
12.0% (1,129)
California:
10.3% (434,937)
Number of households with income $75k - 100k:
Bell Gardens:
14.2% (1,333)
State:
14.4% (607,302)
Number of households with income $100k - 125k:
Bell Gardens:
7.1% (671)
State:
10.6% (447,424)
Number of households with income $125k - 150k:
Bell Gardens:
3.1% (293)
State:
7.5% (316,022)
Number of households with income $150k - 200k:
Bell Gardens:
4.6% (431)
State:
9.2% (386,269)
Number of households with income > $200k:
Bell Gardens:
2.6% (241)
State:
8.8% (372,651)
Aggregate household income in Bell Gardens in 2022: $608,787,732
Median family income in Bell Gardens in 2022:
Bell Gardens:
$52,421
State:
$77,589
Number of families with income < $10k:
Bell Gardens:
4.5% (366)
California:
3.9% (129,468)
Number of families with income $10k - 20k:
Bell Gardens:
9.1% (737)
State:
4.6% (151,997)
Number of families with income $20k - 30k:
Bell Gardens:
12.3% (989)
State:
6.6% (216,764)
Number of families with income $30k - 40k:
Bell Gardens:
12.8% (1,028)
State:
7.6% (249,849)
Number of families with income $40k - 50k:
Bell Gardens:
8.7% (699)
State:
7.7% (254,822)
Number of families with income $50k - 60k:
Bell Gardens:
11.6% (934)
State:
7.4% (244,815)
Number of families with income $60k - 75k:
Bell Gardens:
10.7% (865)
State:
10.5% (345,838)
Number of families with income $75k - 100k:
Bell Gardens:
12.5% (1,007)
California:
14.9% (491,589)
Number of families with income $100k - 125k:
Bell Gardens:
7.5% (608)
California:
10.7% (355,400)
Number of families with income $125k - 150k:
Bell Gardens:
3.7% (297)
State:
7.8% (259,317)
Number of families with income $150k - 200k:
Bell Gardens:
4.2% (342)
California:
9.3% (306,566)
Number of families with income > $200k:
Bell Gardens:
2.3% (184)
State:
9.1% (299,984)
Median non-family income in Bell Gardens in 2022:
Bell Gardens:
$28,790
State:
$49,746
Change in median non-family income between 2000 and 2022:
Bell Gardens, California:
+110.4%
State:
+100.7%
Median per capita income in Bell Gardens in 2022:
Bell Gardens:
$17,123
State:
$27,240
Change in median per capita income between 2000 and 2022:
Bell Gardens, California:
+112.5%
State:
+133.3%
Income statistics for American Indian and Alaska Native residents
Number of households with income < $10k:
Bell Gardens:
0.0% (0)
California:
5.4% (8,471)
Number of households with income $10k - 20k:
Bell Gardens:
0.0% (0)
State:
6.0% (9,381)
Number of households with income $20k - 30k:
Bell Gardens:
7.3% (13)
State:
5.5% (8,668)
Number of households with income $30k - 40k:
Bell Gardens:
45.8% (82)
State:
8.3% (13,030)
Number of households with income $40k - 50k:
Bell Gardens:
5.0% (9)
State:
6.9% (10,908)
Number of households with income $50k - 60k:
Bell Gardens:
0.0% (0)
State:
7.1% (11,198)
Number of households with income $60k - 75k:
Bell Gardens:
11.2% (20)
State:
9.6% (15,190)
Number of households with income $75k - 100k:
Bell Gardens:
24.0% (43)
State:
14.1% (22,274)
Number of households with income $100k - 125k:
Bell Gardens:
6.7% (12)
California:
11.2% (17,643)
Number of households with income $125k - 150k:
Bell Gardens:
0.0% (0)
State:
8.3% (13,117)
Number of households with income $150k - 200k:
Bell Gardens:
0.0% (0)
State:
8.8% (13,853)
Number of households with income > $200k:
Bell Gardens:
0.0% (0)
State:
8.8% (13,925)
Aggregate household income in Bell Gardens in 2022: $8,816,912
Median family income in Bell Gardens in 2022:
Bell Gardens:
$32,520
State:
$81,108
Number of families with income $20k - 30k:
Bell Gardens:
7.0% (10)
State:
4.3% (4,876)
Number of families with income $30k - 40k:
Bell Gardens:
52.7% (78)
State:
8.8% (9,994)
Number of families with income $40k - 50k:
Bell Gardens:
7.4% (11)
California:
7.8% (8,776)
Number of families with income $60k - 75k:
Bell Gardens:
11.8% (18)
State:
9.1% (10,247)
Number of families with income $75k - 100k:
Bell Gardens:
14.2% (21)
State:
14.8% (16,731)
Number of families with income $100k - 125k:
Bell Gardens:
6.9% (10)
State:
12.0% (13,609)
Median per capita income in Bell Gardens in 2022:
Bell Gardens:
$22,601
State:
$30,289
Change in median per capita income between 2000 and 2022:
Bell Gardens, California:
+99.9%
State:
+98.9%
Income statistics for Multirace residents
Median household income in Bell Gardens, CA in 2022:
Bell Gardens:
$54,305
California:
$83,153
Change in median household income between 2000 and 2022:
Bell Gardens, California:
+82.9%
State:
+106.0%
Number of households with income < $10k:
Bell Gardens:
1.6% (79)
California:
4.2% (85,299)
Number of households with income $10k - 20k:
Bell Gardens:
10.6% (540)
California:
6.1% (122,966)
Number of households with income $20k - 30k:
Bell Gardens:
17.1% (866)
State:
6.4% (129,328)
Number of households with income $30k - 40k:
Bell Gardens:
8.5% (432)
California:
6.4% (130,070)
Number of households with income $40k - 50k:
Bell Gardens:
6.6% (334)
State:
6.5% (131,254)
Number of households with income $50k - 60k:
Bell Gardens:
12.1% (612)
State:
6.5% (132,382)
Number of households with income $60k - 75k:
Bell Gardens:
11.4% (578)
State:
9.4% (191,472)
Number of households with income $75k - 100k:
Bell Gardens:
14.9% (758)
State:
13.3% (269,691)
Number of households with income $100k - 125k:
Bell Gardens:
7.3% (370)
State:
10.2% (207,286)
Number of households with income $125k - 150k:
Bell Gardens:
2.0% (103)
State:
7.8% (158,259)
Number of households with income $150k - 200k:
Bell Gardens:
5.9% (301)
State:
10.3% (209,227)
Number of households with income > $200k:
Bell Gardens:
2.0% (100)
State:
13.0% (263,210)
Aggregate household income in Bell Gardens in 2022: $314,076,689
Median family income in Bell Gardens in 2022:
Bell Gardens:
$51,249
State:
$87,642
Number of families with income < $10k:
Bell Gardens:
4.5% (215)
California:
3.2% (48,017)
Number of families with income $10k - 20k:
Bell Gardens:
8.5% (405)
State:
4.1% (60,419)
Number of families with income $20k - 30k:
Bell Gardens:
16.6% (789)
State:
6.1% (89,742)
Number of families with income $30k - 40k:
Bell Gardens:
6.6% (315)
State:
6.2% (91,415)
Number of families with income $40k - 50k:
Bell Gardens:
11.0% (521)
State:
6.8% (100,085)
Number of families with income $50k - 60k:
Bell Gardens:
13.7% (651)
State:
6.7% (98,298)
Number of families with income $60k - 75k:
Bell Gardens:
10.8% (513)
State:
9.5% (140,131)
Number of families with income $75k - 100k:
Bell Gardens:
13.0% (616)
State:
13.8% (203,439)
Number of families with income $100k - 125k:
Bell Gardens:
7.2% (341)
State:
10.4% (153,515)
Number of families with income $125k - 150k:
Bell Gardens:
1.5% (70)
State:
8.4% (124,115)
Number of families with income $150k - 200k:
Bell Gardens:
4.9% (231)
State:
10.9% (161,643)
Number of families with income > $200k:
Bell Gardens:
1.6% (74)
State:
14.0% (207,317)
Median non-family income in Bell Gardens in 2022:
Bell Gardens:
$17,015
State:
$56,558
Change in median non-family income between 2000 and 2022:: -4.5%
Bell Gardens, California:
-4.5%
State:
+100.2%
Median per capita income in Bell Gardens in 2022:
Bell Gardens:
$16,486
State:
$32,124
Change in median per capita income between 2000 and 2022:
Bell Gardens, California:
+101.0%
California:
+120.4%
Income statistics for other residents
Median household income in Bell Gardens, CA in 2022:
Bell Gardens:
$60,347
State:
$71,383
Number of households with income < $10k:
Bell Gardens:
6.1% (141)
State:
4.6% (93,035)
Number of households with income $10k - 20k:
Bell Gardens:
8.3% (190)
State:
6.3% (126,222)
Number of households with income $20k - 30k:
Bell Gardens:
7.1% (162)
State:
7.1% (142,656)
Number of households with income $30k - 40k:
Bell Gardens:
12.1% (278)
State:
8.2% (165,018)
Number of households with income $40k - 50k:
Bell Gardens:
4.3% (98)
State:
8.0% (161,732)
Number of households with income $50k - 60k:
Bell Gardens:
11.2% (258)
State:
7.6% (152,152)
Number of households with income $60k - 75k:
Bell Gardens:
12.0% (275)
State:
10.4% (209,951)
Number of households with income $75k - 100k:
Bell Gardens:
19.4% (446)
State:
14.7% (296,102)
Number of households with income $100k - 125k:
Bell Gardens:
6.2% (143)
California:
10.7% (214,281)
Number of households with income $125k - 150k:
Bell Gardens:
5.1% (118)
State:
7.1% (143,092)
Number of households with income $150k - 200k:
Bell Gardens:
4.5% (103)
State:
8.6% (172,215)
Number of households with income > $200k:
Bell Gardens:
3.7% (84)
State:
6.7% (134,102)
Aggregate household income in Bell Gardens in 2022: $160,292,580
Median family income in Bell Gardens in 2022:
Bell Gardens:
$59,970
California:
$72,756
Number of families with income < $10k:
Bell Gardens:
4.9% (93)
State:
4.3% (69,090)
Number of families with income $10k - 20k:
Bell Gardens:
6.3% (121)
State:
5.1% (82,116)
Number of families with income $20k - 30k:
Bell Gardens:
6.6% (127)
State:
7.0% (112,854)
Number of families with income $30k - 40k:
Bell Gardens:
15.4% (293)
California:
8.4% (135,938)
Number of families with income $40k - 50k:
Bell Gardens:
5.4% (103)
State:
8.4% (135,353)
Number of families with income $50k - 60k:
Bell Gardens:
11.6% (221)
California:
7.7% (124,826)
Number of families with income $60k - 75k:
Bell Gardens:
8.6% (164)
State:
10.7% (173,628)
Number of families with income $75k - 100k:
Bell Gardens:
20.0% (380)
State:
15.2% (245,724)
Number of families with income $100k - 125k:
Bell Gardens:
5.5% (104)
State:
10.9% (176,716)
Number of families with income $125k - 150k:
Bell Gardens:
6.2% (117)
State:
7.4% (119,985)
Number of families with income $150k - 200k:
Bell Gardens:
5.1% (98)
California:
8.5% (137,332)
Number of families with income > $200k:
Bell Gardens:
4.4% (83)
State:
6.6% (106,346)
Median non-family income in Bell Gardens in 2022:
Bell Gardens:
$28,159
State:
$43,881
Change in median non-family income between 2000 and 2022:
Bell Gardens, California:
+87.3%
California:
+84.6%
Median per capita income in Bell Gardens in 2022:
Bell Gardens:
$19,565
California:
$25,164
Change in median per capita income between 2000 and 2022:
Bell Gardens, California:
+147.7%
California:
+137.9%
Discuss Bell Gardens, California (CA) on our hugely popular California forum.