Avon, Connecticut (CT) income map, earnings map, and wages data
The median household income in Avon, CT in 2022 was $153,872, which was 42.5% greater than the median annual income of $88,429 across the entire state of Connecticut. Compared to the median income of $90,934 in 2000 this represents an increase of 40.9%. The per capita income in 2022 was $94,585, which means an increase of 45.3% compared to 2000 when it was $51,706.
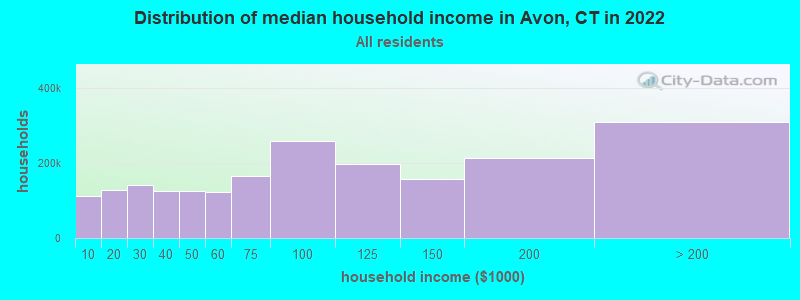
Income statistics for all residents
Median household income in Avon, CT in 2022:| Avon: | $153,873 |
| State: | $88,429 |
Change in median household income between 2000 and 2022:| Avon, Connecticut: | +69.2% |
| State: | +64.0% |
Number of households with income < $10k:| Avon: | 5.2% (62,675) |
| State: | 5.1% (72,746) |
Number of households with income $10k - 20k:| Avon: | 5.8% (70,675) |
| State: | 5.7% (81,643) |
Number of households with income $20k - 30k:| Avon: | 6.6% (79,998) |
| State: | 6.5% (92,844) |
Number of households with income $30k - 40k:| Avon: | 5.9% (71,793) |
| State: | 5.9% (83,934) |
Number of households with income $40k - 50k:| Avon: | 5.9% (71,333) |
| Connecticut: | 5.8% (83,025) |
Number of households with income $50k - 60k:| Avon: | 5.8% (69,946) |
| Connecticut: | 5.7% (81,788) |
Number of households with income $60k - 75k:| Avon: | 8.1% (98,004) |
| State: | 8.1% (115,651) |
Number of households with income $75k - 100k:| Avon: | 12.6% (153,060) |
| State: | 12.6% (180,173) |
Number of households with income $100k - 125k:| Avon: | 9.8% (119,155) |
| State: | 9.9% (141,231) |
Number of households with income $125k - 150k:| Avon: | 7.8% (95,157) |
| State: | 7.9% (112,826) |
Number of households with income $150k - 200k:| Avon: | 10.7% (130,167) |
| State: | 10.8% (154,641) |
Number of households with income > $200k:| Avon: | 16.0% (194,461) |
| Connecticut: | 16.3% (233,133) |
Aggregate household income in Avon in 2022: $34,901,765,010
Median family income in Avon in 2022:| Avon: | $194,961 |
| State: | $115,183 |
Median non-family income in Avon in 2022:| Avon: | $82,432 |
| State: | $50,964 |
Change in median non-family income between 2000 and 2022:| Avon, Connecticut: | +71.5% |
| State: | +65.1% |
Median per capita income in Avon in 2022:| Avon: | $94,586 |
| State: | $51,581 |
Change in median per capita income between 2000 and 2022:| Avon, Connecticut: | +82.9% |
| Connecticut: | +79.3% |
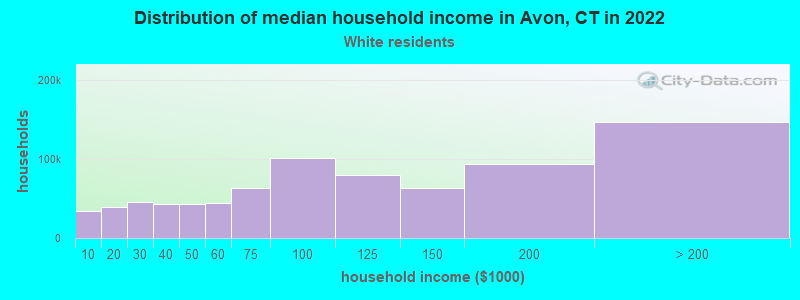
Income statistics for White residents
Median household income in Avon, CT in 2022:| Avon: | $153,898 |
| Connecticut: | $96,890 |
Change in median household income between 2000 and 2022:| Avon, Connecticut: | +69.4% |
| Connecticut: | +68.5% |
Number of households with income < $10k:| Avon: | 4.2% (33,661) |
| Connecticut: | 4.2% (42,265) |
Number of households with income $10k - 20k:| Avon: | 4.9% (38,700) |
| State: | 4.8% (48,323) |
Number of households with income $20k - 30k:| Avon: | 5.8% (46,024) |
| Connecticut: | 5.7% (57,716) |
Number of households with income $30k - 40k:| Avon: | 5.4% (42,603) |
| State: | 5.3% (53,827) |
Number of households with income $40k - 50k:| Avon: | 5.3% (42,426) |
| State: | 5.3% (53,301) |
Number of households with income $50k - 60k:| Avon: | 5.6% (44,152) |
| Connecticut: | 5.5% (55,690) |
Number of households with income $60k - 75k:| Avon: | 7.9% (63,096) |
| State: | 8.0% (80,329) |
Number of households with income $75k - 100k:| Avon: | 12.7% (101,104) |
| State: | 12.7% (128,070) |
Number of households with income $100k - 125k:| Avon: | 10.0% (79,391) |
| State: | 10.0% (101,210) |
Number of households with income $125k - 150k:| Avon: | 8.0% (63,737) |
| State: | 8.0% (81,250) |
Number of households with income $150k - 200k:| Avon: | 11.8% (93,719) |
| Connecticut: | 11.8% (119,527) |
Number of households with income > $200k:| Avon: | 18.4% (146,714) |
| State: | 18.6% (187,875) |
Aggregate household income in Avon in 2022: $25,592,138,847
Median family income in Avon in 2022:| Avon: | $200,980 |
| Connecticut: | $128,955 |
Number of families with income < $10k:| Avon: | 0.4% (31) |
| Connecticut: | 1.9% (11,537) |
Number of families with income $10k - 20k:| Avon: | 0.4% (30) |
| State: | 1.8% (11,289) |
Number of families with income $20k - 30k:| Avon: | 0.9% (63) |
| State: | 3.0% (18,506) |
Number of families with income $30k - 40k:| Avon: | 0.7% (50) |
| State: | 2.9% (18,160) |
Number of families with income $40k - 50k:| Avon: | 0.8% (54) |
| State: | 3.9% (24,550) |
Number of families with income $50k - 60k:| Avon: | 1.1% (78) |
| Connecticut: | 4.3% (26,723) |
Number of families with income $60k - 75k:| Avon: | 2.6% (178) |
| State: | 7.1% (44,075) |
Number of families with income $75k - 100k:| Avon: | 6.9% (478) |
| Connecticut: | 12.5% (77,679) |
Number of families with income $100k - 125k:| Avon: | 6.8% (474) |
| State: | 11.1% (69,086) |
Number of families with income $125k - 150k:| Avon: | 8.4% (587) |
| Connecticut: | 9.6% (59,616) |
Number of families with income $150k - 200k:| Avon: | 20.5% (1,431) |
| Connecticut: | 15.7% (97,890) |
Number of families with income > $200k:| Avon: | 50.5% (3,521) |
| State: | 26.3% (163,417) |
Median non-family income in Avon in 2022:| Avon: | $82,412 |
| Connecticut: | $54,067 |
Change in median non-family income between 2000 and 2022:| Avon, Connecticut: | +73.7% |
| State: | +68.7% |
Median per capita income in Avon in 2022:| Avon: | $100,850 |
| State: | $59,916 |
Change in median per capita income between 2000 and 2022:| Avon, Connecticut: | +92.1% |
| State: | +90.2% |
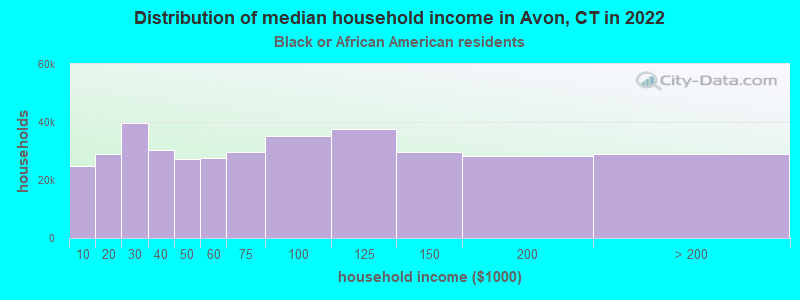
Income statistics for Black or African American residents
Median household income in Avon, CT in 2022:| Avon: | $148,427 |
| State: | $61,803 |
Change in median household income between 2000 and 2022:| Avon, Connecticut: | +60.9% |
| State: | +76.1% |
Number of households with income < $10k:| Avon: | 6.8% (24,947) |
| State: | 6.8% (9,494) |
Number of households with income $10k - 20k:| Avon: | 7.9% (28,913) |
| Connecticut: | 7.9% (11,003) |
Number of households with income $20k - 30k:| Avon: | 10.8% (39,534) |
| Connecticut: | 10.8% (15,045) |
Number of households with income $30k - 40k:| Avon: | 8.2% (30,221) |
| State: | 8.2% (11,501) |
Number of households with income $40k - 50k:| Avon: | 7.4% (27,370) |
| State: | 7.4% (10,416) |
Number of households with income $50k - 60k:| Avon: | 7.5% (27,680) |
| Connecticut: | 7.5% (10,534) |
Number of households with income $60k - 75k:| Avon: | 8.0% (29,546) |
| State: | 8.0% (11,244) |
Number of households with income $75k - 100k:| Avon: | 9.6% (35,132) |
| State: | 9.6% (13,370) |
Number of households with income $100k - 125k:| Avon: | 10.2% (37,429) |
| State: | 10.2% (14,244) |
Number of households with income $125k - 150k:| Avon: | 8.0% (29,551) |
| State: | 8.0% (11,246) |
Number of households with income $150k - 200k:| Avon: | 7.7% (28,187) |
| State: | 7.7% (10,727) |
Number of households with income > $200k:| Avon: | 7.9% (29,131) |
| Connecticut: | 7.9% (11,086) |
Aggregate household income in Avon in 2022: $59,260,004
Median family income in Avon in 2022:| Avon: | $207,190 |
| Connecticut: | $87,228 |
Number of families with income $50k - 60k:| Avon: | 4.7% (11) |
| State: | 5.4% (4,480) |
Number of families with income $75k - 100k:| Avon: | 13.7% (33) |
| State: | 12.7% (10,598) |
Number of families with income $150k - 200k:| Avon: | 13.7% (33) |
| State: | 11.4% (9,497) |
Number of families with income > $200k:| Avon: | 67.8% (161) |
| State: | 10.8% (9,057) |
Median non-family income in Avon in 2022:
Change in median non-family income between 2000 and 2022:| Avon, Connecticut: | +77.0% |
| State: | +77.0% |
Median per capita income in Avon in 2022:| Avon: | $93,515 |
| Connecticut: | $36,289 |
Change in median per capita income between 2000 and 2022:| Avon, Connecticut: | +115.2% |
| State: | +117.5% |
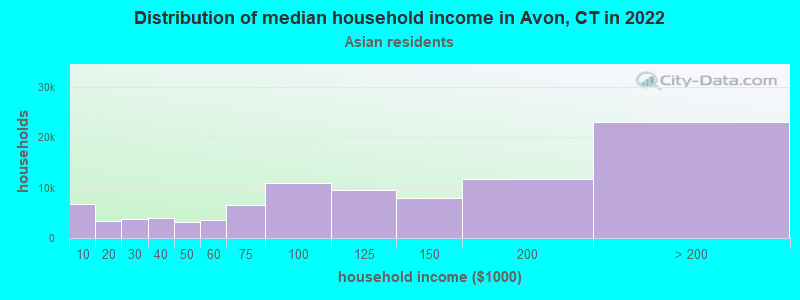
Income statistics for Asian residents
Median household income in Avon, CT in 2022:| Avon: | $203,629 |
| Connecticut: | $110,568 |
Change in median household income between 2000 and 2022:| Avon, Connecticut: | +110.1% |
| State: | +79.5% |
Number of households with income < $10k:| Avon: | 7.1% (6,681) |
| State: | 7.1% (4,245) |
Number of households with income $10k - 20k:| Avon: | 3.5% (3,284) |
| Connecticut: | 3.5% (2,087) |
Number of households with income $20k - 30k:| Avon: | 4.1% (3,878) |
| Connecticut: | 4.1% (2,464) |
Number of households with income $30k - 40k:| Avon: | 4.1% (3,900) |
| Connecticut: | 4.1% (2,478) |
Number of households with income $40k - 50k:| Avon: | 3.3% (3,121) |
| State: | 3.3% (1,983) |
Number of households with income $50k - 60k:| Avon: | 3.9% (3,664) |
| Connecticut: | 3.9% (2,328) |
Number of households with income $60k - 75k:| Avon: | 7.0% (6,654) |
| State: | 7.0% (4,228) |
Number of households with income $75k - 100k:| Avon: | 11.5% (10,877) |
| Connecticut: | 11.5% (6,911) |
Number of households with income $100k - 125k:| Avon: | 10.2% (9,643) |
| State: | 10.2% (6,127) |
Number of households with income $125k - 150k:| Avon: | 8.5% (7,993) |
| Connecticut: | 8.5% (5,079) |
Number of households with income $150k - 200k:| Avon: | 12.4% (11,700) |
| State: | 12.4% (7,434) |
Number of households with income > $200k:| Avon: | 24.4% (23,074) |
| State: | 24.4% (14,661) |
Aggregate household income in Avon in 2022: $83,644,469
Median family income in Avon in 2022:| Avon: | $257,274 |
| State: | $134,548 |
Number of families with income $20k - 30k:| Avon: | 2.3% (9) |
| State: | 3.8% (1,682) |
Number of families with income $40k - 50k:| Avon: | 2.7% (11) |
| State: | 2.0% (863) |
Number of families with income $75k - 100k:| Avon: | 3.0% (12) |
| Connecticut: | 11.0% (4,844) |
Number of families with income $100k - 125k:| Avon: | 8.4% (33) |
| Connecticut: | 10.5% (4,621) |
Number of families with income $125k - 150k:| Avon: | 6.4% (25) |
| State: | 8.2% (3,588) |
Number of families with income $150k - 200k:| Avon: | 18.1% (72) |
| State: | 14.2% (6,237) |
Number of families with income > $200k:| Avon: | 58.9% (233) |
| State: | 30.8% (13,522) |
Median non-family income in Avon in 2022:| Avon: | $154,979 |
| State: | $63,785 |
Change in median non-family income between 2000 and 2022:| Avon, Connecticut: | +148.6% |
| State: | +77.9% |
Median per capita income in Avon in 2022:| Avon: | $75,726 |
| Connecticut: | $55,295 |
Change in median per capita income between 2000 and 2022:| Avon, Connecticut: | +103.6% |
| Connecticut: | +97.8% |
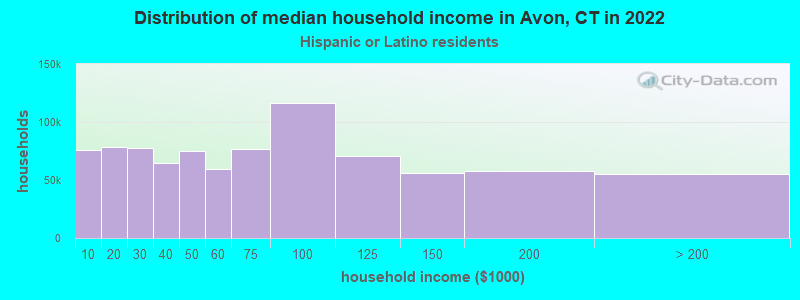
Income statistics for Hispanic or Latino residents
Median household income in Avon, CT in 2022:| Avon: | $218,720 |
| State: | $60,275 |
Change in median household income between 2000 and 2022:| Avon, Connecticut: | +67.8% |
| Connecticut: | +87.9% |
Number of households with income < $10k:| Avon: | 8.7% (75,524) |
| State: | 8.7% (18,584) |
Number of households with income $10k - 20k:| Avon: | 9.1% (78,169) |
| State: | 9.1% (19,235) |
Number of households with income $20k - 30k:| Avon: | 8.9% (77,170) |
| Connecticut: | 8.9% (18,989) |
Number of households with income $30k - 40k:| Avon: | 7.5% (64,888) |
| Connecticut: | 7.5% (15,967) |
Number of households with income $40k - 50k:| Avon: | 8.7% (75,044) |
| Connecticut: | 8.7% (18,466) |
Number of households with income $50k - 60k:| Avon: | 6.9% (59,764) |
| Connecticut: | 6.9% (14,706) |
Number of households with income $60k - 75k:| Avon: | 8.9% (76,759) |
| State: | 8.9% (18,888) |
Number of households with income $75k - 100k:| Avon: | 13.5% (116,508) |
| State: | 13.5% (28,669) |
Number of households with income $100k - 125k:| Avon: | 8.2% (70,850) |
| Connecticut: | 8.2% (17,434) |
Number of households with income $125k - 150k:| Avon: | 6.5% (55,887) |
| State: | 6.5% (13,752) |
Number of households with income $150k - 200k:| Avon: | 6.6% (57,358) |
| State: | 6.6% (14,114) |
Number of households with income > $200k:| Avon: | 6.4% (55,391) |
| State: | 6.4% (13,630) |
Aggregate household income in Avon in 2022: $49,550,807
Median family income in Avon in 2022:| Avon: | $223,004 |
| State: | $68,336 |
Number of families with income < $10k:| Avon: | 1.8% (16) |
| Connecticut: | 5.2% (7,456) |
Number of families with income $10k - 20k:| Avon: | 2.7% (23) |
| Connecticut: | 6.0% (8,616) |
Number of families with income $20k - 30k:| Avon: | 5.7% (50) |
| State: | 8.9% (12,680) |
Number of families with income $30k - 40k:| Avon: | 3.3% (28) |
| Connecticut: | 8.5% (12,090) |
Number of families with income $40k - 50k:| Avon: | 3.2% (28) |
| Connecticut: | 8.8% (12,624) |
Number of families with income $50k - 60k:| Avon: | 4.1% (36) |
| Connecticut: | 8.4% (11,924) |
Number of families with income $60k - 75k:| Avon: | 5.6% (48) |
| State: | 8.9% (12,677) |
Number of families with income $75k - 100k:| Avon: | 14.4% (125) |
| Connecticut: | 14.3% (20,457) |
Number of families with income $100k - 125k:| Avon: | 8.7% (76) |
| State: | 8.2% (11,720) |
Number of families with income $125k - 150k:| Avon: | 12.7% (110) |
| Connecticut: | 8.2% (11,729) |
Number of families with income $150k - 200k:| Avon: | 15.5% (135) |
| State: | 7.1% (10,096) |
Number of families with income > $200k:| Avon: | 22.4% (195) |
| State: | 7.4% (10,622) |
Median per capita income in Avon in 2022:| Avon: | $47,411 |
| Connecticut: | $28,507 |
Change in median per capita income between 2000 and 2022:| Avon, Connecticut: | +80.3% |
| State: | +117.2% |
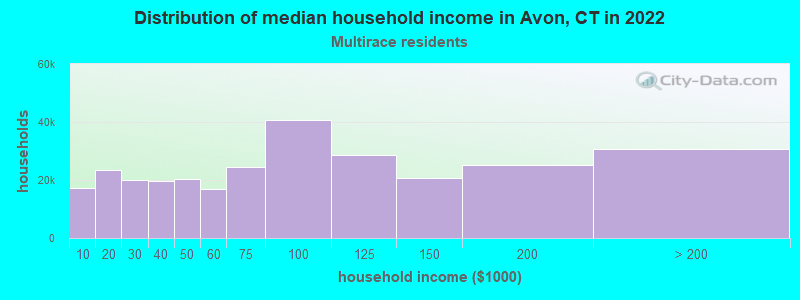
Income statistics for Multirace residents
Median household income in Avon, CT in 2022:| Avon: | $184,005 |
| State: | $77,277 |
Change in median household income between 2000 and 2022:| Avon, Connecticut: | +119.4% |
| State: | +113.6% |
Number of households with income < $10k:| Avon: | 6.0% (17,280) |
| State: | 6.0% (7,457) |
Number of households with income $10k - 20k:| Avon: | 8.1% (23,494) |
| State: | 8.1% (10,139) |
Number of households with income $20k - 30k:| Avon: | 7.0% (20,165) |
| Connecticut: | 7.0% (8,702) |
Number of households with income $30k - 40k:| Avon: | 6.9% (19,803) |
| State: | 6.9% (8,546) |
Number of households with income $40k - 50k:| Avon: | 7.0% (20,188) |
| State: | 7.0% (8,712) |
Number of households with income $50k - 60k:| Avon: | 5.9% (16,988) |
| State: | 5.9% (7,331) |
Number of households with income $60k - 75k:| Avon: | 8.5% (24,641) |
| Connecticut: | 8.5% (10,634) |
Number of households with income $75k - 100k:| Avon: | 14.1% (40,783) |
| State: | 14.1% (17,600) |
Number of households with income $100k - 125k:| Avon: | 9.9% (28,694) |
| State: | 9.9% (12,383) |
Number of households with income $125k - 150k:| Avon: | 7.2% (20,672) |
| Connecticut: | 7.2% (8,921) |
Number of households with income $150k - 200k:| Avon: | 8.8% (25,309) |
| State: | 8.8% (10,922) |
Number of households with income > $200k:| Avon: | 10.6% (30,696) |
| State: | 10.6% (13,247) |
Aggregate household income in Avon in 2022: $31,428,588
Median family income in Avon in 2022:| Avon: | $180,321 |
| Connecticut: | $84,255 |
Number of families with income $75k - 100k:| Avon: | 53.2% (144) |
| Connecticut: | 14.5% (12,236) |
Number of families with income > $200k:| Avon: | 46.8% (127) |
| State: | 13.7% (11,603) |
Median per capita income in Avon in 2022:| Avon: | $53,532 |
| State: | $32,794 |
Change in median per capita income between 2000 and 2022:| Avon, Connecticut: | +95.5% |
| State: | +117.2% |