York, PA (Pennsylvania) Houses and Residents
| York: | $100,278 |
| Pennsylvania: | $245,500 |
Mean price in 2022:
Detached houses: $157,912
Here: $157,912 State: $317,202 Townhouses or other attached units: $117,893
Here: $117,893 State: $254,369 In 2-unit structures: $164,211
Here: $164,211 State: $249,182 In 3-to-4-unit structures: $182,952
Here: $182,952 State: $297,446 In 5-or-more-unit structures: $171,846
Here: $171,846 State: $320,068 Mobile homes: $123,653
Here: $123,653 State: $92,414
Total population: 43,865 (Urban population: 40,889, Rural population: 0)
Houses: 19,472 (17,974 occupied: 7,957 owner occupied, 10,337 renter occupied)
| % of renters here: | 57% |
| State: | 31% |
Housing density: 3,742 houses/condos per square mile
Median price asked for vacant for-sale houses and condos in 2022: $45,176.
Median contract rent in 2022: $776 (lower quartile is $549, upper quartile is $963)
Median rent asked for vacant for-rent units in 2022: $773
Median gross rent in York, PA in 2022: $937
Housing units in York with a mortgage: 4,567 (274 second mortgage, 12 home equity loan, 190 both second mortgage and home equity loan)
Houses without a mortgage: 146
Median household income for houses/condos with a mortgage: $67,191
Median household income for apartments without a mortgage: $47,370
Median monthly housing costs: $923
Compare current foreclosures in York, PA:
| Photo | Address | Area | Beds / Baths | Price | Details |
|---|---|---|---|---|---|

|
#1
E Philadelphia St
York, PA 17403
|
1,660 sq. feet
|
1 baths 3 beds |
show details | |

|
#2
Rosebrook Dr
York, PA 17402
|
3,179 sq. feet
|
3 baths 4 beds |
show details | |

|
#3
Green Valley Rd
York, PA 17403
|
1,890 sq. feet
|
2 baths 4 beds |
show details | |

|
#4
Herman Dr
York, PA 17408
|
2,285 sq. feet
|
2 baths 4 beds |
show details | |

|
#5
Devers Rd
York, PA 17404
|
1,036 sq. feet
|
1 baths 3 beds |
show details | |

|
#6
S Main St
York, PA 17408
|
- sq. feet
|
1 baths 4 beds |
show details | |

|
#7
Farmview Dr
York, PA 17408
|
1,680 sq. feet
|
1 baths 3 beds |
show details | |

|
#8
S Salem Church Rd
York, PA 17408
|
2,256 sq. feet
|
2 baths 4 beds |
show details | |

|
#9
Chestnut St
York, PA 17403
|
1,472 sq. feet
|
1 baths 3 beds |
show details | |

|
#10
Winding Rd
York, PA 17408
|
1,340 sq. feet
|
1 baths 3 beds |
show details |
| Photo | Address | Area | Beds / Baths | Price | Details |
|---|---|---|---|---|---|

|
#11
Wolfs Church Rd
York, PA 17408
|
1,248 sq. feet
|
1 baths 3 beds |
show details | |

|
#12
Margate Rd
York, PA 17408
|
1,680 sq. feet
|
2 baths 3 beds |
show details | |

|
#13
Meadow Cross Way
York, PA 17402
|
6,348 sq. feet
|
4 baths 5 beds |
show details | |

|
#14
Madison Ave
York, PA 17404
|
1,612 sq. feet
|
1 baths 5 beds |
show details | |

|
#15
S Royal St
York, PA 17401
|
968 sq. feet
|
1 baths 3 beds |
show details | |

|
#16
Olde Field Dr
York, PA 17408
|
1,931 sq. feet
|
2 baths 4 beds |
show details | |

|
#17
Eagleton Dr
York, PA 17407
|
2,128 sq. feet
|
2 baths 4 beds |
show details | |

|
#18
San Gabriel Dr
York, PA 17406
|
1,393 sq. feet
|
1 baths 3 beds |
show details | |

|
#19
Carl St
York, PA 17404
|
1,042 sq. feet
|
1 baths 3 beds |
show details | |

|
#20
Linden Ave
York, PA 17404
|
2,084 sq. feet
|
2 baths 4 beds |
show details |
| Photo | Address | Area | Beds / Baths | Price | Details |
|---|---|---|---|---|---|

|
#21
S Albemarle St
York, PA 17403
|
1,152 sq. feet
|
1 baths 3 beds |
show details | |

|
#22
Martin Rd
York, PA 17408
|
717 sq. feet
|
1 baths 1 beds |
show details | |

|
#23
Wellington St
York, PA 17403
|
1,472 sq. feet
|
1 baths 3 beds |
show details | |

|
#24
Teslin Rd
York, PA 17404
|
1,040 sq. feet
|
1 baths 3 beds |
show details | |

|
#25
San Gabriel Dr
York, PA 17406
|
1,140 sq. feet
|
1 baths 3 beds |
show details | |

|
#26
Tioga St
York, PA 17404
|
2,016 sq. feet
|
2 baths 6 beds |
show details | |

|
#27
Springwood Rd
York, PA 17402
|
1,606 sq. feet
|
2 baths 3 beds |
show details | |

|
#28
Joshua Dr
York, PA 17404
|
2,203 sq. feet
|
2 baths 4 beds |
show details | |

|
#29
Walnut Bottom Rd
York, PA 17408
|
1,688 sq. feet
|
2 baths 3 beds |
show details | |

|
#30
E Locust St
York, PA 17403
|
1,880 sq. feet
|
2 baths 2 beds |
show details |
| Photo | Address | Area | Beds / Baths | Price | Details |
|---|---|---|---|---|---|

|
#31
Middle St
York, PA 17408
|
1,568 sq. feet
|
1 baths 5 beds |
show details | |

|
#32
W Market St
York, PA 17404
|
1,664 sq. feet
|
1 baths 3 beds |
show details | |

|
#33
Manor Rd
York, PA 17406
|
1,980 sq. feet
|
1 baths 3 beds |
show details | |

|
#34
N Duke St
York, PA 17404
|
1,316 sq. feet
|
2 baths 3 beds |
show details | |

|
#35
E 7th Ave
York, PA 17404
|
1,404 sq. feet
|
1 baths 3 beds |
show details | |

|
#36
S George St
York, PA 17403
|
2,150 sq. feet
|
2 baths 4 beds |
show details | |

|
#37
Eastland Ave
York, PA 17406
|
1,008 sq. feet
|
1 baths 3 beds |
show details | |

|
#38
Harrowgate Rd
York, PA 17402
|
2,520 sq. feet
|
2 baths 4 beds |
show details | |

|
#39
Church Rd
York, PA 17408
|
2,666 sq. feet
|
2 baths 4 beds |
show details | |

|
#40
Hill St
York, PA 17403
|
1,451 sq. feet
|
1 baths 3 beds |
show details |
| Photo | Address | Area | Beds / Baths | Price | Details |
|---|---|---|---|---|---|

|
#41
Hill St
York, PA 17403
|
1,040 sq. feet
|
1 baths 2 beds |
show details | |

|
#42
Ridge Ave
York, PA 17403
|
1,142 sq. feet
|
1 baths 3 beds |
show details | |

|
#43
Church Rd
York, PA 17408
|
1,236 sq. feet
|
2 baths 4 beds |
show details | |

|
#44
Patriot St
York, PA 17408
|
2,218 sq. feet
|
3 baths 4 beds |
show details | |

|
#45
Freysville Rd
York, PA 17406
|
5,064 sq. feet
|
1 baths 3 beds |
show details | |

|
#46
E Prospect St
York, PA 17403
|
1,152 sq. feet
|
1 baths 3 beds |
show details | |

|
#47
Eagleton Dr
York, PA 17407
|
1,856 sq. feet
|
2 baths 4 beds |
show details | |

|
#48
Lynbrook Dr S
York, PA 17402
|
1,385 sq. feet
|
1 baths 3 beds |
show details | |

|
#49
Woodspring Dr
York, PA 17402
|
3,171 sq. feet
|
2 baths 4 beds |
show details | |

|
Check over 1 million property listings on Foreclosure.com!
|
browse all offers | |||

Latest news about housing in York, PA collected exclusively by city-data.com from local newspapers, TV, and radio stations

 | SOUTHERN YORK COUNTY - Rental Homes? (3 replies) |
| Good Apartments in the York, Lancaster, or Harrisburg Area (3 replies) |
| Moving From New York, NY To Philadelphia (17 replies) |
| family moving to philadelphia from new york (62 replies) |
| York, PA - Apartments in the Route 30/North Hills Rd area (8 replies) |
| Affordable Housing in York Co. -Closest to Lancaster (0 replies) |

Median year apartment built: 1943
Household type by relationship:
Households: 45,174- Male householders: 7,185 (2,875 living alone), Female householders: 10,721 (3,609 living alone)
4,711 spouses (4,663 opposite-sex spouses), 1,958 unmarried partners, (1,896 opposite-sex unmarried partners), 13,581 children (12,386 natural, 403 adopted, 790 stepchildren), 1,270 grandchildren, 711 brothers or sisters, 780 parents, 0 foster children, 1,052 other relatives, 1,906 non-relatives
- In group quarters: 1,296
Size of family households: 3,661 2-persons, 2,589 3-persons, 1,680 4-persons, 1,243 5-persons, 297 6-persons, 504 7-or-more-persons.
Size of nonfamily households: 6,561 1-person, 1,455 2-persons, 102 3-persons, 89 4-persons, 37 5-persons, 53 6-persons, 1 7-or-more-persons.
3,699 married couples with children.
4,578 single-parent households (654 men, 3,924 women).
71.7% of residents of York speak English at home.
27.2% of residents speak Spanish at home (52% speak English very well, 19% speak English well, 17% speak English not well, 12% don't speak English at all).
0.7% of residents speak other Indo-European language at home (79% speak English very well, 2% speak English well, 19% speak English not well).
1.2% of residents speak Asian or Pacific Island language at home (29% speak English very well, 26% speak English well, 42% speak English not well, 3% don't speak English at all).
0.6% of residents speak other language at home (87% speak English very well, 13% speak English well).
Foreign born population: 5,581 (12.4%)
(51.0% of them are naturalized citizens)
| Here: | 6.5 |
| State: | 6.8 |
| Here: | 4.3 |
| State: | 4.3 |

- Bedrooms in owner-occupied houses and condos in York, Pennsylvania
- 0no bedroom
- 1631 bedroom
- 1,5922 bedrooms
- 3,5893 bedrooms
- 1,5704 bedrooms
- 1,0445+ bedrooms

- Bedrooms in renter-occupied apartments in York, Pennsylvania
- 944no bedroom
- 3,1771 bedroom
- 2,4232 bedrooms
- 1,9313 bedrooms
- 9894 bedrooms
- 8735+ bedrooms

- Cars and other vehicles available in York in owner-occupied houses/condos
- 510no vehicle
- 3,3061 vehicle
- 3,0282 vehicles
- 8803 vehicles
- 1704 vehicles
- 635+ vehicles

- Cars and other vehicles available in York in renter-occupied apartments
- 3,174no vehicle
- 4,9531 vehicle
- 1,6892 vehicles
- 3353 vehicles
- 1504 vehicles
- 355+ vehicles

- Rooms in owner-occupied houses in York, Pennsylvania
- 01 room
- 02 rooms
- 1653 rooms
- 7864 rooms
- 1,0065 rooms
- 2,0286 rooms
- 1,4197 rooms
- 1,4408 rooms
- 1,1139+ rooms

- Rooms in renter-occupied apartments in York, Pennsylvania
- 9441 room
- 7862 rooms
- 1,8273 rooms
- 1,9894 rooms
- 1,3995 rooms
- 1,1666 rooms
- 8547 rooms
- 9638 rooms
- 4099+ rooms


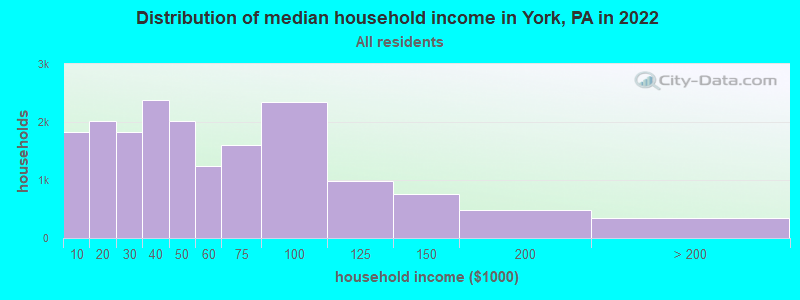
York, PA household income distribution

- 1,821Less than $10,000
- 2,023$10,000 to $19,999
- 1,831$20,000 to $29,999
- 2,375$30,000 to $39,999
- 2,023$40,000 to $49,999
- 1,248$50,000 to $59,999
- 1,603$60,000 to $74,999
- 2,353$75,000 to $99,999
- 990$100,000 to $124,999
- 751$125,000 to $149,999
- 482$150,000 to $199,999
- 340$200,000 or more
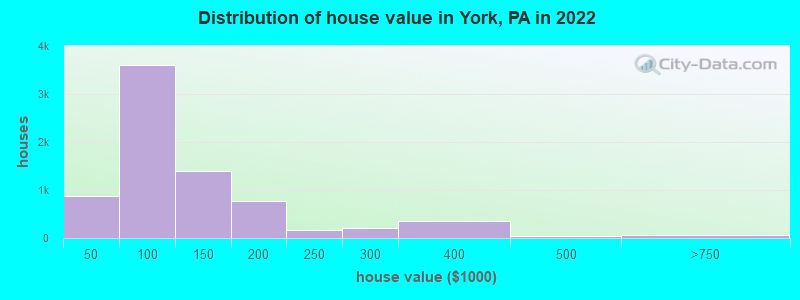
Home value of owner - occupied houses in 2022 in York, PA
-
- 5Less than $10,000
- 66$10,000 to $14,999
- 40$15,000 to $19,999
- 144$20,000 to $24,999
- 79$25,000 to $29,999
- 77$30,000 to $34,999
- 269$35,000 to $39,999
- 196$40,000 to $49,999
- 700$50,000 to $59,999
- 491$60,000 to $69,999
- 1,101$70,000 to $79,999
- 798$80,000 to $89,999
- 324$90,000 to $99,999
- 806$100,000 to $124,999
- 597$125,000 to $149,999
- 593$150,000 to $174,999
- 186$175,000 to $199,999
- 169$200,000 to $249,999
- 216$250,000 to $299,999
- 358$300,000 to $399,999
- 49$400,000 to $499,999
- 43$500,000 to $749,999
- 9$750,000 to $999,999
- 16$2,000,000 or more
Rent paid by renters in 2022 in York, PA
-
- 207Less than $100
- 7$100 to $149
- 74$150 to $199
- 147$200 to $249
- 197$250 to $299
- 240$300 to $349
- 217$350 to $399
- 168$400 to $449
- 323$450 to $499
- 375$500 to $549
- 506$550 to $599
- 781$600 to $649
- 875$650 to $699
- 800$700 to $749
- 449$750 to $799
- 1,320$800 to $899
- 1,226$900 to $999
- 975$1,000 to $1,249
- 359$1,250 to $1,499
- 98$1,500 to $1,999
- 27$2,000 to $2,499
- 20$2,500 to $2,999
- 10$3,500 or more
- 188No cash rent

Percentage of workers working in this county: 88.4%
Number of people working at home: 2,409 (12.1% of all workers)
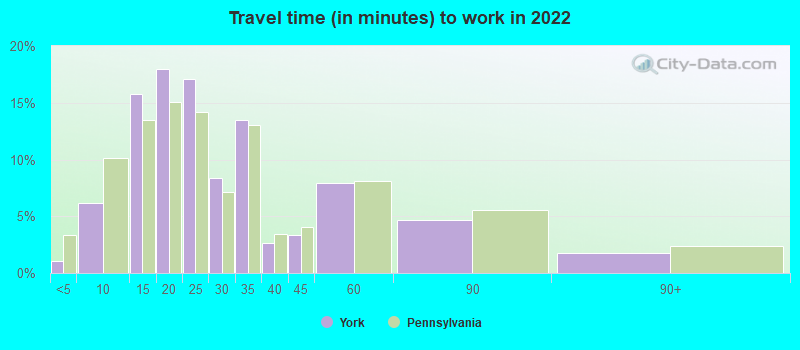
Travel time to work (commute)
- Less than 5 minutes: 143
- 5 to 9 minutes: 1,353
- 10 to 14 minutes: 3,658
- 15 to 19 minutes: 3,908
- 20 to 24 minutes: 2,397
- 25 to 29 minutes: 1,254
- 30 to 34 minutes: 1,619
- 35 to 39 minutes: 339
- 40 to 44 minutes: 543
- 45 to 59 minutes: 1,355
- 60 to 89 minutes: 777
- 90 or more minutes: 224
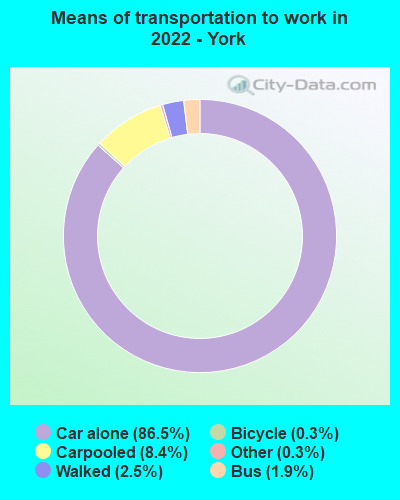
Means of transportation to work:
- Drove a car alone: 24,220 (78.2%)
- Carpooled: 2,291 (7.4%)
- Bus: 345 (1.1%)
- Taxi: 94 (0.3%)
- Bicycle: 215 (0.7%)
- Walked: 613 (2.0%)
- Worked at home: 2,409 (7.8%)
- Unemployment by race in 2022
- Unemployment rate for White non-Hispanic residents
- 5.6%Males
- 5.0%Females
- Unemployment rate for Black residents
- 18.3%Males
- 15.7%Females
- Unemployment rate for American Indian and Alaska Native residents
- 16.0%Females
- Unemployment rate for other race residents
- 9.9%Males
- 18.1%Females
- Unemployment rate for two or more race residents
- 4.2%Males
- 3.1%Females
- Unemployment rate for Hispanic or Latino residents
- 15.0%Males
- 7.2%Females

- Year of entry for the foreign-born population in York, Pennsylvania
- 2,2382010 or later
- 1,1972000 to 2009
- 8371990 to 1999
- 4431980 to 1989
- 1911970 to 1979
- 143Before 1970

First ancestries reported:
- German: 3,004 (12.3%)
- American: 1,697 (6.9%)
- English: 631 (2.6%)
- Irish: 361 (1.5%)
- Italian: 360 (1.5%)
- African: 311 (1.3%)
- Jamaican: 246 (1.0%)
- European: 156 (0.6%)
- Pennsylvania German: 110 (0.4%)
- Lebanese: 105 (0.4%)
- Slovak: 96 (0.4%)
- Polish: 95 (0.4%)
- Haitian: 92 (0.4%)
- Scotch-Irish: 63 (0.3%)
- Northern European: 58 (0.2%)
- French: 50 (0.2%)
- Hungarian: 46 (0.2%)
- U.S. Virgin Islander: 46 (0.2%)
- Dutch: 45 (0.2%)
- French Canadian: 45 (0.2%)
- Greek: 45 (0.2%)
- Kenyan: 45 (0.2%)
- Egyptian: 37 (0.2%)
- Scottish: 31 (0.1%)
- Swedish: 27 (0.1%)
- Welsh: 26 (0.1%)
- British: 24 (0.10%)
- Ghanaian: 19 (0.08%)
- Eastern European: 13 (0.05%)
- Swiss: 7 (0.03%)
- Romanian: 5 (0.02%)
- Canadian: 3 (0.01%)
Most common places of birth for foreign-born residents (%):
| York: | 69.8% (3,491) |
| Pennsylvania: | 9.2% (86,544) |
| York: | 6.3% (316) |
| Pennsylvania: | 5.8% (54,190) |
| York: | 5.6% (281) |
| Pennsylvania: | 0.8% (7,727) |
| York: | 3.6% (179) |
| Pennsylvania: | 2.4% (22,612) |
| York: | 3.2% (161) |
| Pennsylvania: | 3.3% (31,542) |
| York: | 2.5% (124) |
| Pennsylvania: | 0.1% (797) |
| York: | 1.8% (91) |
| Pennsylvania: | 1.5% (13,823) |
| York: | 1.7% (85) |
| Pennsylvania: | 7.2% (67,704) |
| York: | 1.5% (77) |
| Pennsylvania: | 1.6% (15,224) |
Place of birth for U.S.-born residents:
- This state: 24,096
- Other state: 11,932
- Northeast: 5,548
- Midwest: 705
- South: 4,765
- West: 890
82.9% of York residents lived in the same house 1 years ago.
Out of people who lived in different houses, 38.1% lived in this county.
Out of people who lived in different counties, 32.0% lived in Pennsylvania.
| York: | 82.9% |
| State average: | 89.3% |
Education attainment for males 25 years and older:
- No schooling: 288
- Nursery to 4th grade: 83
- 5th and 6th grade: 169
- 7th and 8th grade: 232
- 9th grade: 397
- 10th grade: 298
- 11th grade: 274
- 12th grade, no diploma: 670
- High school graduate (or equivalency): 5,995
- Less than 1 year of college: 537
- Some college more than 1 year, no degree: 1,303
- Associate degree: 963
- Bachelor's degree: 1,419
- Master's degree: 520
- Professional school degree: 150
- Doctorate degree: 48

Education attainment for females 25 years and older:
- No schooling: 346
- Nursery to 4th grade: 135
- 5th and 6th grade: 182
- 7th and 8th grade: 337
- 9th grade: 143
- 10th grade: 290
- 11th grade: 652
- 12th grade, no diploma: 320
- High school graduate (or equivalency): 5,621
- Less than 1 year of college: 738
- Some college more than 1 year, no degree: 1,670
- Associate degree: 1,720
- Bachelor's degree: 1,562
- Master's degree: 808
- Professional school degree: 89
- Doctorate degree: 211


Housing units in structures:
- One, detached: 4,249
- One, attached: 7,962
- Two: 2,091
- 3 or 4: 1,576
- 5 to 9: 808
- 10 to 19: 702
- 20 to 49: 558
- 50 or more: 1,450
- Mobile homes: 72
Median worth of mobile homes: $125,176
Housing units lacking complete kitchen facilities in 2022: 4.3%
House/condo owner moved in on average 16 years ago
Renter moved in on average 3 years ago

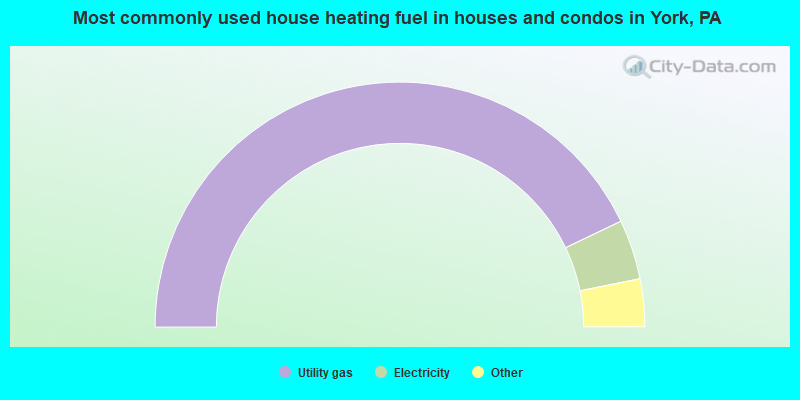
- 85.8%Utility gas
- 7.9%Electricity
- 3.7%Fuel oil, kerosene, etc.
- 1.3%Bottled, tank, or LP gas
- 0.6%Other fuel
- 0.5%No fuel used
- 0.2%Coal or coke
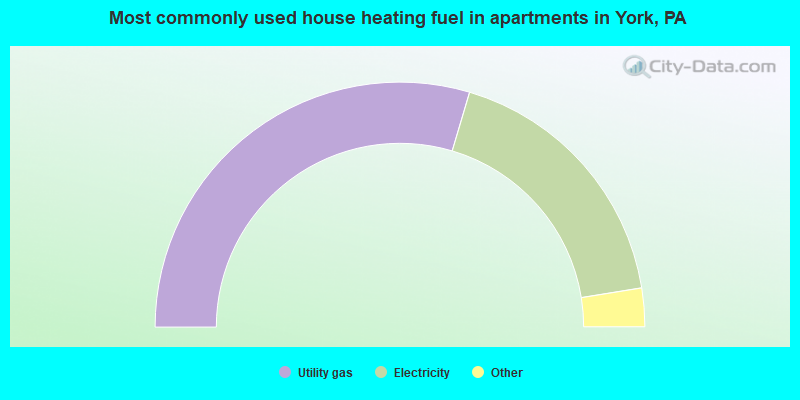
- 59.2%Utility gas
- 35.7%Electricity
- 2.1%Bottled, tank, or LP gas
- 1.9%No fuel used
- 0.6%Fuel oil, kerosene, etc.
- 0.6%Other fuel
Private vs. public school enrollment:
| Here: | 15.0% |
| Pennsylvania: | 15.7% |
| Here: | 10.2% |
| Pennsylvania: | 13.4% |
| Here: | 48.0% |
| Pennsylvania: | 39.8% |


