Wood Dale, IL (Illinois) Houses and Residents
| Wood Dale: | $283,082 |
| Illinois: | $251,600 |
Mean price in 2022:
Detached houses: $377,538
Here: $377,538 State: $310,164 Townhouses or other attached units: $259,117
Here: $259,117 State: $286,230 In 2-unit structures: $126,212
Here: $126,212 State: $299,638 In 3-to-4-unit structures: $209,683
Here: $209,683 State: $330,907 In 5-or-more-unit structures: $576,670
Here: $576,670 State: $318,887 Mobile homes: $79,308
Here: $79,308 State: $78,855
Total population: 13,945 (All urban)
Houses: 5,298 (5,139 occupied: 3,932 owner occupied, 1,212 renter occupied)
| % of renters here: | 24% |
| State: | 33% |
Housing density: 1,134 houses/condos per square mile
Median price asked for vacant for-sale houses and condos in 2022: $329,584.
Median contract rent in 2022: $1,353 (lower quartile is $1,141, upper quartile is $1,643)
Median rent asked for vacant for-rent units in 2022: $10,976
Median gross rent in Wood Dale, IL in 2022: $1,589
Housing units in Wood Dale with a mortgage: 2,273 (155 second mortgage, 0 home equity loan, 103 both second mortgage and home equity loan)
Houses without a mortgage: 119
Median household income for houses/condos with a mortgage: $108,587
Median household income for apartments without a mortgage: $64,697
Median monthly housing costs: $1,475
Compare current foreclosures near Wood Dale, IL:
| Photo | Address | Area | Beds / Baths | Price | Details |
|---|---|---|---|---|---|

|
#1
Woodside Dr
Wood Dale, IL 60191
|
3,504 sq. feet
|
4 baths 5 beds |
show details | |

|
#2
Montclare Ln
Wood Dale, IL 60191
|
2,206 sq. feet
|
2 baths - beds |
show details | |

|
#3
Oakwood Dr
Wood Dale, IL 60191
|
2,319 sq. feet
|
- baths - beds |
show details | |

|
#4
N Central Ave
Wood Dale, IL 60191
|
864 sq. feet
|
- baths - beds |
show details | |

|
#5
N Central Ave
Wood Dale, IL 60191
|
1,128 sq. feet
|
- baths - beds |
show details | |

|
#6
Jeanne Ct # 7
Wood Dale, IL 60191
|
- sq. feet
|
- baths - beds |
show details | |

|
#7
E Potter St
Wood Dale, IL 60191
|
1,787 sq. feet
|
- baths - beds |
show details | |

|
#8
Jefferson Ln
Wood Dale, IL 60191
|
1,080 sq. feet
|
- baths - beds |
show details | |

|
#9
Jefferson Ln
Wood Dale, IL 60191
|
1,080 sq. feet
|
- baths - beds |
show details | |

|
#10
Cypress Ct
Wood Dale, IL 60191
|
2,131 sq. feet
|
- baths - beds |
show details |
| Photo | Address | Area | Beds / Baths | Price | Details |
|---|---|---|---|---|---|

|
#11
N Edgewood Ave
Wood Dale, IL 60191
|
- sq. feet
|
- baths - beds |
show details | |

|
#12
E Division St Apt C2
Wood Dale, IL 60191
|
- sq. feet
|
- baths - beds |
show details | |

|
#13
George St
Wood Dale, IL 60191
|
1,093 sq. feet
|
- baths - beds |
show details | |

|
#14
Dillon Dr
Wood Dale, IL 60191
|
- sq. feet
|
- baths - beds |
show details | |

|
#15
Irving Park Rd
Wood Dale, IL 60191
|
- sq. feet
|
- baths - beds |
show details | |

|
#16
Prospect Ave
Wood Dale, IL 60191
|
1,440 sq. feet
|
- baths - beds |
show details | |

|
#17
Itasca St
Wood Dale, IL 60191
|
- sq. feet
|
- baths - beds |
show details | |

|
#18
Ash Ave
Wood Dale, IL 60191
|
1,111 sq. feet
|
- baths - beds |
show details | |

|
#19
Park Ln Apt 1a
Wood Dale, IL 60191
|
- sq. feet
|
- baths - beds |
show details | |

|
#20
Juliann Dr Apt 10
Wood Dale, IL 60191
|
- sq. feet
|
- baths - beds |
show details |
| Photo | Address | Area | Beds / Baths | Price | Details |
|---|---|---|---|---|---|

|
#21
N 4th Ave
Des Plaines, IL 60016
|
1,381 sq. feet
|
1 baths 3 beds |
$335,000
|
show details |

|
#22
N Olcott Ave
Chicago, IL 60634
|
2,161 sq. feet
|
2 baths 4 beds |
$559,000
|
show details |

|
#23
N Francisco Ave
Chicago, IL 60659
|
1,100 sq. feet
|
1 baths 2 beds |
$159,000
|
show details |

|
#24
N Sheridan Rd Apt 6e
Chicago, IL 60660
|
1,200 sq. feet
|
2 baths 2 beds |
$255,000
|
show details |

|
#25
Christiana Ave # 1
Skokie, IL 60076
|
1,400 sq. feet
|
1 baths 3 beds |
$319,000
|
show details |

|
#26
S 13th Ave
Maywood, IL 60153
|
1,176 sq. feet
|
1 baths 3 beds |
$279,900
|
show details |

|
#27
S Lyman Ave
Des Plaines, IL 60016
|
2,233 sq. feet
|
2 baths 4 beds |
$330,000
|
show details |

|
#28
Main St
Skokie, IL 60076
|
1,428 sq. feet
|
1 baths 3 beds |
$455,000
|
show details |

|
#29
W 63rd St
Chicago, IL 60638
|
1,250 sq. feet
|
2 baths 4 beds |
$385,000
|
show details |

|
#30
S 87th Ave
Justice, IL 60458
|
2,725 sq. feet
|
3 baths 4 beds |
$585,000
|
show details |
| Photo | Address | Area | Beds / Baths | Price | Details |
|---|---|---|---|---|---|

|
#31
N Austin Ave
Chicago, IL 60634
|
2,500 sq. feet
|
3 baths 4 beds |
$365,000
|
show details |

|
#32
W Van Buren St
Chicago, IL 60644
|
2,839 sq. feet
|
3 baths 8 beds |
$87,500
|
show details |

|
#33
E Crest Ave
Addison, IL 60101
|
2,023 sq. feet
|
1 baths 5 beds |
$329,000
|
show details |

|
#34
Newcastle Ave
Westchester, IL 60154
|
1,640 sq. feet
|
1 baths 2 beds |
$239,200
|
show details |

|
#35
S Ridgeland Ave
Oak Park, IL 60302
|
2,400 sq. feet
|
3 baths 4 beds |
$625,000
|
show details |

|
#36
Raymond Ave
Brookfield, IL 60513
|
1,020 sq. feet
|
1 baths 2 beds |
$219,900
|
show details |

|
#37
Wisconsin Ave
Barrington, IL 60010
|
1,297 sq. feet
|
2 baths 3 beds |
$489,900
|
show details |

|
#38
Webster Ln
Des Plaines, IL 60018
|
1,608 sq. feet
|
3 baths 3 beds |
$515,000
|
show details |

|
#39
Carriage Way Dr
Arlington Heights, IL 60004
|
- sq. feet
|
2 baths 2 beds |
$179,900
|
show details |

|
#40
N 74th Ave
Elmwood Park, IL 60707
|
1,300 sq. feet
|
1 baths 3 beds |
$235,000
|
show details |
| Photo | Address | Area | Beds / Baths | Price | Details |
|---|---|---|---|---|---|

|
#41
Briar Hill Dr
Schaumburg, IL 60194
|
1,600 sq. feet
|
2 baths 4 beds |
$410,400
|
show details |

|
#42
S Wood Dale Rd Apt 607
Wood Dale, IL 60191
|
- sq. feet
|
- baths - beds |
show details | |

|
#43
Woods Dr Unit Unit 2004
Skokie, IL 60077
|
- sq. feet
|
2 baths 3 beds |
$572,000
|
show details |

|
#44
W Quincy St
Chicago, IL 60644
|
960 sq. feet
|
1 baths - beds |
$19,000
|
show details |

|
#45
Avenida Serra Test
Des Plaines, IL 60018
|
- sq. feet
|
2 baths 3 beds |
$100,000
|
show details |

|
#46
W Arthington St
Chicago, IL 60612
|
969 sq. feet
|
1 baths - beds |
$20,000
|
show details |

|
#47
Washington Blvd Apt 1
Oak Park, IL 60302
|
- sq. feet
|
1 baths 2 beds |
$149,900
|
show details |

|
#48
W Cermak Rd
Chicago, IL 60623
|
2,971 sq. feet
|
3 baths 7 beds |
show details | |

|
#49
W Grenshaw St
Chicago, IL 60624
|
2,148 sq. feet
|
2 baths 6 beds |
show details | |

|
Check over 1 million property listings on Foreclosure.com!
|
browse all offers | |||


 | Very weak housing market in Highland Park (66 replies) |
| Average trailer lot rent near my area (4 replies) |
| Thoughts on Wood Dale? (2 replies) |
| Thoughts on Wood Dale (3 replies) |
| Working in Franklin Park-Best suburb to buy a house? (5 replies) |
| Where should we move? Addison, Villa Park, Wood Dale, Des Plaines, More.... (21 replies) |

Median year apartment built: 1977
Household type by relationship:
Households: 13,758- Male householders: 2,545 (258 living alone), Female householders: 2,514 (742 living alone)
3,016 spouses (3,016 opposite-sex spouses), 289 unmarried partners, (284 opposite-sex unmarried partners), 4,302 children (4,029 natural, 85 adopted, 188 stepchildren), 122 grandchildren, 65 brothers or sisters, 551 parents, 0 foster children, 238 other relatives, 90 non-relatives
- In group quarters: 21
Size of family households: 1,736 2-persons, 826 3-persons, 729 4-persons, 408 5-persons, 95 6-persons, 54 7-or-more-persons.
Size of nonfamily households: 1,036 1-person, 228 2-persons, 10 3-persons.
1,615 married couples with children.
723 single-parent households (90 men, 633 women).
51.2% of residents of Wood Dale speak English at home.
20.4% of residents speak Spanish at home (64% speak English very well, 16% speak English well, 12% speak English not well, 7% don't speak English at all).
26.0% of residents speak other Indo-European language at home (61% speak English very well, 25% speak English well, 10% speak English not well, 3% don't speak English at all).
0.6% of residents speak Asian or Pacific Island language at home (44% speak English very well, 56% speak English well).
1.3% of residents speak other language at home (60% speak English very well, 32% speak English well, 8% speak English not well).
Foreign born population: 4,017 (29.2%)
(69.3% of them are naturalized citizens)
| Here: | 6.0 |
| State: | 6.4 |
| Here: | 4.7 |
| State: | 4.1 |

- Bedrooms in owner-occupied houses and condos in Wood Dale, Illinois
- 5no bedroom
- 161 bedroom
- 1,0932 bedrooms
- 1,9133 bedrooms
- 7464 bedrooms
- 1605+ bedrooms

- Bedrooms in renter-occupied apartments in Wood Dale, Illinois
- 47no bedroom
- 1621 bedroom
- 6352 bedrooms
- 3543 bedrooms
- 94 bedrooms
- 55+ bedrooms

- Cars and other vehicles available in Wood Dale in owner-occupied houses/condos
- 29no vehicle
- 1,0301 vehicle
- 1,7092 vehicles
- 8573 vehicles
- 2254 vehicles
- 805+ vehicles

- Cars and other vehicles available in Wood Dale in renter-occupied apartments
- 60no vehicle
- 3521 vehicle
- 6312 vehicles
- 1623 vehicles
- 74 vehicles
- 05+ vehicles

- Rooms in owner-occupied houses in Wood Dale, Illinois
- 01 room
- 02 rooms
- 1003 rooms
- 5354 rooms
- 7085 rooms
- 1,0076 rooms
- 6017 rooms
- 5258 rooms
- 4569+ rooms

- Rooms in renter-occupied apartments in Wood Dale, Illinois
- 291 room
- 422 rooms
- 1233 rooms
- 3234 rooms
- 3355 rooms
- 1596 rooms
- 1037 rooms
- 658 rooms
- 339+ rooms


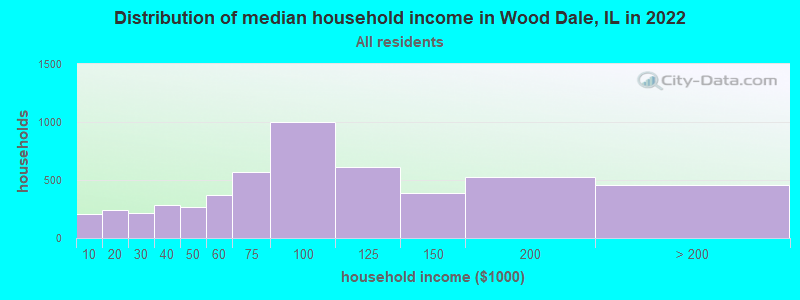
Wood Dale, IL household income distribution

- 211Less than $10,000
- 240$10,000 to $19,999
- 214$20,000 to $29,999
- 283$30,000 to $39,999
- 271$40,000 to $49,999
- 368$50,000 to $59,999
- 569$60,000 to $74,999
- 996$75,000 to $99,999
- 610$100,000 to $124,999
- 391$125,000 to $149,999
- 528$150,000 to $199,999
- 461$200,000 or more
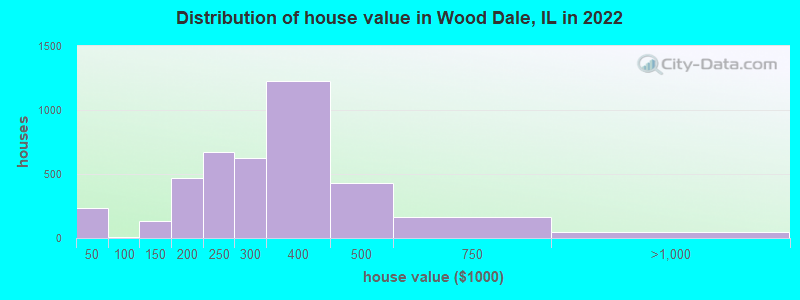
Home value of owner - occupied houses in 2022 in Wood Dale, IL
-
- 9Less than $10,000
- 9$15,000 to $19,999
- 105$20,000 to $24,999
- 69$25,000 to $29,999
- 25$30,000 to $34,999
- 12$35,000 to $39,999
- 7$70,000 to $79,999
- 57$100,000 to $124,999
- 78$125,000 to $149,999
- 202$150,000 to $174,999
- 269$175,000 to $199,999
- 674$200,000 to $249,999
- 625$250,000 to $299,999
- 1,229$300,000 to $399,999
- 427$400,000 to $499,999
- 166$500,000 to $749,999
- 45$750,000 to $999,999
Rent paid by renters in 2022 in Wood Dale, IL
-
- 7$600 to $649
- 41$650 to $699
- 19$750 to $799
- 10$800 to $899
- 75$900 to $999
- 208$1,000 to $1,249
- 409$1,250 to $1,499
- 211$1,500 to $1,999
- 87$2,000 to $2,499
- 18$2,500 to $2,999
- 29No cash rent


Percentage of workers working in this county: 60.0%
Number of people working at home: 745 (10.0% of all workers)
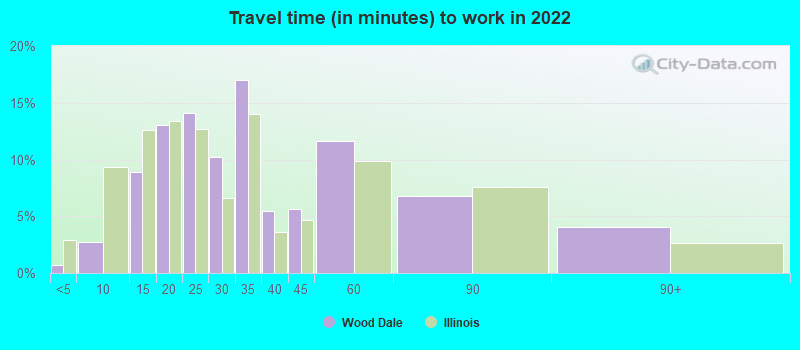
Travel time to work (commute)
- Less than 5 minutes: 32
- 5 to 9 minutes: 259
- 10 to 14 minutes: 1,324
- 15 to 19 minutes: 617
- 20 to 24 minutes: 1,148
- 25 to 29 minutes: 857
- 30 to 34 minutes: 1,078
- 35 to 39 minutes: 200
- 40 to 44 minutes: 204
- 45 to 59 minutes: 409
- 60 to 89 minutes: 338
- 90 or more minutes: 199
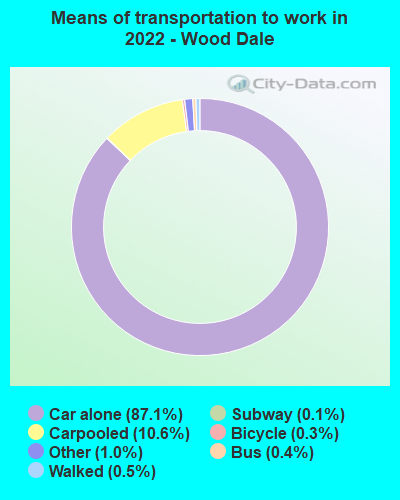
Means of transportation to work:
- Drove a car alone: 9,002 (78.0%)
- Carpooled: 1,345 (11.7%)
- Bus: 62 (0.5%)
- Long-distance train or commuter rail: 11 (0.1%)
- Taxi: 119 (1.0%)
- Bicycle: 24 (0.2%)
- Walked: 45 (0.4%)
- Worked at home: 745 (6.5%)

- Unemployment by race in 2022
- Unemployment rate for White non-Hispanic residents
- 3.0%Males
- 1.5%Females
- Unemployment rate for Black residents
- 32.7%Males
- Unemployment rate for other race residents
- 12.1%Males
- 19.5%Females
- Unemployment rate for two or more race residents
- 3.5%Males
- 7.3%Females
- Unemployment rate for Hispanic or Latino residents
- 7.3%Males
- 12.9%Females

- Year of entry for the foreign-born population in Wood Dale, Illinois
- 7192010 or later
- 7622000 to 2009
- 1,0671990 to 1999
- 5231980 to 1989
- 4971970 to 1979
- 836Before 1970

First ancestries reported:
- Polish: 1,465 (20.1%)
- Italian: 757 (10.4%)
- German: 256 (3.5%)
- American: 216 (3.0%)
- Ukrainian: 213 (2.9%)
- English: 165 (2.3%)
- European: 161 (2.2%)
- Irish: 142 (1.9%)
- Bulgarian: 133 (1.8%)
- French Canadian: 101 (1.4%)
- Yugoslavian: 101 (1.4%)
- Serbian: 97 (1.3%)
- Greek: 71 (1.0%)
- Iraqi: 64 (0.9%)
- Scottish: 64 (0.9%)
- Lithuanian: 58 (0.8%)
- Swedish: 41 (0.6%)
- Dutch: 37 (0.5%)
- Czech: 34 (0.5%)
- Norwegian: 25 (0.3%)
- Czechoslovakian: 24 (0.3%)
- French: 23 (0.3%)
- Eastern European: 22 (0.3%)
- African: 22 (0.3%)
- Croatian: 19 (0.3%)
- Russian: 18 (0.2%)
- Lebanese: 13 (0.2%)
- Romanian: 13 (0.2%)
- Alsatian: 13 (0.2%)
- Belgian: 11 (0.2%)
- Slovak: 11 (0.2%)
- Jamaican: 10 (0.1%)
- Danish: 9 (0.1%)
- Hungarian: 8 (0.1%)
- Scotch-Irish: 8 (0.1%)
- Assyrian: 6 (0.08%)
- Finnish: 6 (0.08%)
- Luxembourger: 6 (0.08%)
- Armenian: 4 (0.05%)
- Austrian: 4 (0.05%)
- British: 4 (0.05%)
Most common places of birth for foreign-born residents (%):
| Wood Dale: | 31.7% (1,281) |
| Illinois: | 6.9% (124,474) |
| Wood Dale: | 27.3% (1,101) |
| Illinois: | 34.7% (626,958) |
| Wood Dale: | 6.0% (241) |
| Illinois: | 9.2% (166,409) |
| Wood Dale: | 3.5% (140) |
| Illinois: | 1.6% (29,519) |
| Wood Dale: | 3.4% (139) |
| Illinois: | 0.9% (15,679) |
| Wood Dale: | 3.2% (130) |
| Illinois: | 1.6% (29,316) |
| Wood Dale: | 2.8% (114) |
| Illinois: | 0.8% (14,165) |
| Wood Dale: | 2.2% (87) |
| Illinois: | 0.5% (8,574) |
| Wood Dale: | 2.0% (82) |
| Illinois: | 1.0% (18,753) |
| Wood Dale: | 1.7% (69) |
| Illinois: | 0.6% (10,776) |
| Wood Dale: | 1.7% (67) |
| Illinois: | 0.9% (16,308) |
Place of birth for U.S.-born residents:
- This state: 8,578
- Other state: 702
- Northeast: 121
- Midwest: 295
- South: 162
- West: 117
90.0% of Wood Dale residents lived in the same house 1 years ago.
Out of people who lived in different houses, 27.2% lived in this county.
Out of people who lived in different counties, 93.8% lived in Illinois.
| Wood Dale: | 90.0% |
| State average: | 88.3% |
Education attainment for males 25 years and older:
- No schooling: 124
- Nursery to 4th grade: 12
- 5th and 6th grade: 64
- 7th and 8th grade: 70
- 9th grade: 8
- 10th grade: 101
- 11th grade: 27
- 12th grade, no diploma: 167
- High school graduate (or equivalency): 1,570
- Less than 1 year of college: 311
- Some college more than 1 year, no degree: 455
- Associate degree: 570
- Bachelor's degree: 983
- Master's degree: 108
- Professional school degree: 21
- Doctorate degree: 3

Education attainment for females 25 years and older:
- No schooling: 310
- Nursery to 4th grade: 43
- 5th and 6th grade: 105
- 7th and 8th grade: 46
- 9th grade: 10
- 10th grade: 41
- 11th grade: 57
- 12th grade, no diploma: 104
- High school graduate (or equivalency): 1,626
- Less than 1 year of college: 403
- Some college more than 1 year, no degree: 638
- Associate degree: 450
- Bachelor's degree: 854
- Master's degree: 402
- Professional school degree: 0
- Doctorate degree: 28


Housing units in structures:
- One, detached: 2,740
- One, attached: 886
- Two: 22
- 3 or 4: 205
- 5 to 9: 213
- 10 to 19: 518
- 20 to 49: 149
- 50 or more: 394
- Mobile homes: 167
House/condo owner moved in on average 12 years ago
Renter moved in on average 4 years ago

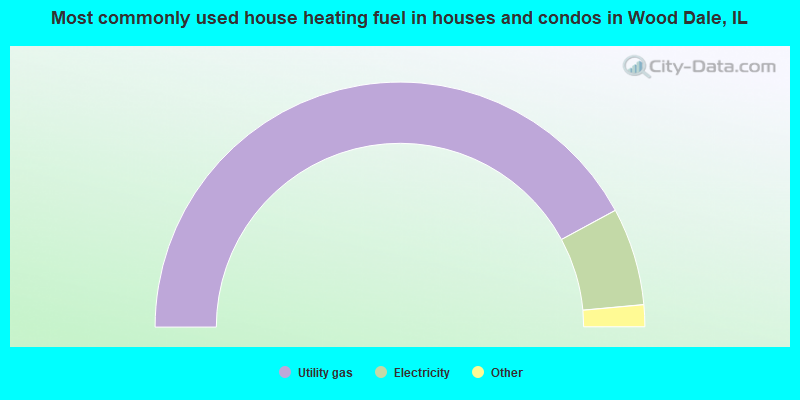
- 84.2%Utility gas
- 12.9%Electricity
- 2.0%Bottled, tank, or LP gas
- 0.5%No fuel used
- 0.3%Fuel oil, kerosene, etc.
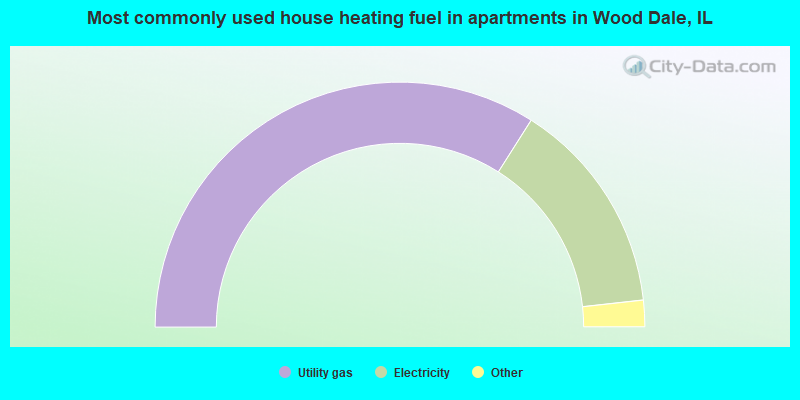
- 68.0%Utility gas
- 28.5%Electricity
- 2.0%Bottled, tank, or LP gas
- 1.5%No fuel used
Private vs. public school enrollment:
| Here: | 8.1% |
| Illinois: | 13.3% |
| Here: | 4.3% |
| Illinois: | 9.9% |
| Here: | 14.9% |
| Illinois: | 27.4% |


