Wonder Lake, IL (Illinois) Houses and Residents
Estimated median house or condo value in 2022: $212,051 (it was $121,400 in 2000 )
Wonder Lake:
$212,051Illinois:
$251,600
Lower value quartile - upper value quartile: $162,826 - $247,696Total population: 8,967 (Urban population: 6,865 (5,305 inside urbanized areas, 1,560 inside urban clusters ), Rural population: 690 (34 farm, 656 nonfarm ))
Houses: 3,049 (2,712 occupied: 2,330 owner occupied, 382 renter occupied )
% of renters here:
14%State:
33%
Housing density: 488 houses/condos per square mile
Median price asked for vacant for-sale houses and condos in 2022 in this county: $276,011.
Median contract rent in 2022: $1,123 (lower quartile is $955, upper quartile is $1,467)
Median rent asked for vacant for-rent units in 2022: $1,388
Median gross rent in Wonder Lake, IL in 2022: $1,361
Housing units in Wonder Lake with a mortgage: 1,780 (251 second mortgage, 182 home equity loan, 0 both second mortgage and home equity loan )Houses without a mortgage: 477
Data:
Median house or condo value ($)
Median house or condo value ($ change since 2000)
Median house or condo value ($) - White
Median house or condo value ($) - Black or African American
Median house or condo value ($) - Asian
Median house or condo value ($) - Hispanic or Latino
Median house or condo value ($) - American Indian and Alaska Native
Median house or condo value ($) - Multirace
Median house or condo value ($) - Other Race
Median price asked for mobile homes ($)
Household density (households per square mile)
Mean house or condo value by units in structure - 1, detached ($)
Mean house or condo value by units in structure - 1, attached ($)
Mean house or condo value by units in structure - 2 ($)
Mean house or condo value by units in structure by units in structure - 3 or 4 ($)
Mean house or condo value by units in structure - 5 or more ($)
Mean house or condo value by units in structure - Boat, RV, van, etc. ($)
Mean house or condo value by units in structure - Mobile home ($)
Median contract rent ($)
Median contract rent - Lower quartile ($)
Median contract rent - Upper quartile ($)
Median gross rent ($)
Urban houses (%)
Rural houses (%)
Houses occupied (%)
Houses occupied (% change since 2000)
Houses owner occupied (%)
Houses owner occupied (% change since 2000)
Houses renter occupied (%)
Houses renter occupied (% change since 2000)
Vacant housing units - For rent (%)
Vacant housing units - For rent (% change since 2000)
Vacant housing units - For sale only (%)
Vacant housing units - For sale only (% change since 2000)
Vacant housing units - Rented or sold, not occupied (%)
Vacant housing units - Rented or sold, not occupied (% change since 2000)
Vacant housing units - For seasonal, recreational, or occasional use (%)
Vacant housing units - For seasonal, recreational, or occasional use (% change since 2000)
Vacant housing units - For migrant workers (%)
Vacant housing units - For migrant workers (% change since 2000)
Vacant housing units - Other vacant (%)
Vacant housing units - Other vacant (% change since 2000)
Median monthly housing costs ($)
Median household income for houses/condos with a mortgage ($)
Median household income for houses/condos without a mortgage ($)
Median household income ($)
Median household income ($) - White
Median household income ($) - Black or African American
Median household income ($) - Asian
Median household income ($) - Hispanic or Latino
Median household income ($) - American Indian and Alaska Native
Median household income ($) - Multirace
Median household income ($) - Other Race
Mortgage status - with mortgage (%)
Mortgage status - with second mortgage (%)
Mortgage status - with home equity loan (%)
Mortgage status - with both second mortgage and home equity loan (%)
Mortgage status - without a mortgage (%)
Median year house/condo built
Median year apartment built
Household type by relationship - Male householder living alone (%)
Household type by relationship - Male householder not living alone (%)
Household type by relationship - Female householder living alone (%)
Household type by relationship - Female householder not living alone (%)
Household type by relationship - Opposite-Sex spouse (%)
Household type by relationship - Same-Sex spouse (%)
Household type by relationship - Opposite-Sex unmarried partner (%)
Household type by relationship - Same-Sex unmarried partner (%)
Household type by relationship - In group quarters (%)
Size of family households - 2-person household (%)
Size of family households - 3-person household (%)
Size of family households - 4-person household (%)
Size of family households - 5-person household (%)
Size of family households - 6-person household (%)
Size of family households - 7-or-more-person household (%)
Size of nonfamily households - 1-person household (%)
Size of nonfamily households - 2-person household (%)
Size of nonfamily households - 3-person household (%)
Size of nonfamily households - 4-person household (%)
Size of nonfamily households - 5-person household (%)
Size of nonfamily households - 6-person household (%)
Size of nonfamily households - 7-or-moreperson household (%)
Year house built - Built 2010 or later (%)
Year house built - Built 2000 to 2009 (%)
Year house built - Built 1990 to 1999 (%)
Year house built - Built 1980 to 1989 (%)
Year house built - Built 1970 to 1979 (%)
Year house built - Built 1960 to 1969 (%)
Year house built - Built 1950 to 1959 (%)
Year house built - Built 1940 to 1949 (%)
Year house built - Built 1939 or earlier (%)
Median number of rooms in houses and condos
Median number of rooms in apartments
Median number of bedrooms in owner occupied houses
Mean number of bedrooms in owner occupied houses
Median number of bedrooms in renter occupied houses
Mean number of bedrooms in renter occupied houses
Median number of vehichles in owner occupied houses
Mean number of vehichles in owner occupied houses
Median number of vehichles in renter occupied houses
Mean number of vehichles in renter occupied houses
Rooms in owner-occupied houses - 1 room (%)
Rooms in owner-occupied houses - 2 rooms (%)
Rooms in owner-occupied houses - 3 rooms (%)
Rooms in owner-occupied houses - 4 rooms (%)
Rooms in owner-occupied houses - 5 rooms (%)
Rooms in owner-occupied houses - 6 rooms (%)
Rooms in owner-occupied houses - 7 rooms (%)
Rooms in owner-occupied houses - 8 rooms (%)
Rooms in owner-occupied houses - 9+ rooms (%)
Rooms in renter-occupied houses - 1 room (%)
Rooms in renter-occupied houses - 2 rooms (%)
Rooms in renter-occupied houses - 3 rooms (%)
Rooms in renter-occupied houses - 4 rooms (%)
Rooms in renter-occupied houses - 5 rooms (%)
Rooms in renter-occupied houses - 6 rooms (%)
Rooms in renter-occupied houses - 7 rooms (%)
Rooms in renter-occupied houses - 8 rooms (%)
Rooms in renter-occupied houses - 9+ rooms (%)
Bedrooms in owner-occupied houses - no bedrooms (%)
Bedrooms in owner-occupied houses - 1 bedroom (%)
Bedrooms in owner-occupied houses - 2 bedrooms (%)
Bedrooms in owner-occupied houses - 3 bedrooms (%)
Bedrooms in owner-occupied houses - 4 bedrooms (%)
Bedrooms in owner-occupied houses - 5+ bedrooms (%)
Bedrooms in renter-occupied houses - no bedrooms (%)
Bedrooms in renter-occupied houses - 1 bedroom (%)
Bedrooms in renter-occupied houses - 2 bedrooms (%)
Bedrooms in renter-occupied houses - 3 bedrooms (%)
Bedrooms in renter-occupied houses - 4 bedrooms (%)
Bedrooms in renter-occupied houses - 5+ bedrooms (%)
Vehicles available in owner-occupied houses - no vehicle available (%)
Vehicles available in owner-occupied houses - 1 vehicle available(%)
Vehicles available in owner-occupied houses - 2 Vehicles available (%)
Vehicles available in owner-occupied houses - 3 Vehicles available (%)
Vehicles available in owner-occupied houses - 4 Vehicles available (%)
Vehicles available in owner-occupied houses - 5+ Vehicles available (%)
Vehicles available in renter-occupied houses - no vehicle available (%)
Vehicles available in renter-occupied houses - 1 vehicle available (%)
Vehicles available in renter-occupied houses - 2 Vehicles available (%)
Vehicles available in renter-occupied houses - 3 Vehicles available (%)
Vehicles available in renter-occupied houses - 4 Vehicles available (%)
Vehicles available in renter-occupied houses - 5+ Vehicles available (%)
Housing units in structures - 1, detached (%)
Housing units in structures - 1, attached (%)
Housing units in structures - 2 (%)
Housing units in structures - 3 or 4 (%)
Housing units in structures - 5 to 9 (%)
Housing units in structures - 10 to 19 (%)
Housing units in structures - 20 to 49 (%)
Housing units in structures - 50 or more (%)
Housing units in structures - Mobile home (%)
Housing units in structures - Boat, RV, van, etc. (%)
Housing units in structures - Owners - 1, detached (%)
Housing units in structures - Owners - 1, attached (%)
Housing units in structures - Owners - 2 (%)
Housing units in structures - Owners - 3 or 4 (%)
Housing units in structures - Owners - 5 to 9 (%)
Housing units in structures - Owners - 10 to 19 (%)
Housing units in structures - Owners - 20 to 49 (%)
Housing units in structures - Owners - 50 or more (%)
Housing units in structures - Owners - Mobile home (%)
Housing units in structures - Owners - Boat, RV, van, etc. (%)
Housing units in structures - Renters - 1, detached (%)
Housing units in structures - Renters - 1, attached (%)
Housing units in structures - Renters - 2 (%)
Housing units in structures - Renters - 3 or 4 (%)
Housing units in structures - Renters - 5 to 9 (%)
Housing units in structures - Renters - 10 to 19 (%)
Housing units in structures - Renters - 20 to 49 (%)
Housing units in structures - Renters - 50 or more (%)
Housing units in structures - Renters - Mobile home (%)
Housing units in structures - Renters - Boat, RV, van, etc. (%)
House/condo owner moved in on average (years ago)
Renter moved in on average (years ago)
Year householder moved into unit - Moved in 1999 to March 2000 (%)
Year householder moved into unit - Moved in 1999 to March 2000 (%) - White
Year householder moved into unit - Moved in 1999 to March 2000 (%) - Black or African American
Year householder moved into unit - Moved in 1999 to March 2000 (%) - Asian
Year householder moved into unit - Moved in 1999 to March 2000 (%) - Hispanic or Latino
Year householder moved into unit - Moved in 1999 to March 2000 (%) - American Indian and Alaska Native
Year householder moved into unit - Moved in 1999 to March 2000 (%) - Multirace
Year householder moved into unit - Moved in 1999 to March 2000 (%) - Other Race
Year householder moved into unit - Moved in 1995 to 1998 (%)
Year householder moved into unit - Moved in 1995 to 1998 (%) - White
Year householder moved into unit - Moved in 1995 to 1998 (%) - Black or African American
Year householder moved into unit - Moved in 1995 to 1998 (%) - Asian
Year householder moved into unit - Moved in 1995 to 1998 (%) - Hispanic or Latino
Year householder moved into unit - Moved in 1995 to 1998 (%) - American Indian and Alaska Native
Year householder moved into unit - Moved in 1995 to 1998 (%) - Multirace
Year householder moved into unit - Moved in 1995 to 1998 (%) - Other Race
Year householder moved into unit - Moved in 1990 to 1994 (%)
Year householder moved into unit - Moved in 1990 to 1994 (%) - White
Year householder moved into unit - Moved in 1990 to 1994 (%) - Black or African American
Year householder moved into unit - Moved in 1990 to 1994 (%) - Asian
Year householder moved into unit - Moved in 1990 to 1994 (%) - Hispanic or Latino
Year householder moved into unit - Moved in 1990 to 1994 (%) - American Indian and Alaska Native
Year householder moved into unit - Moved in 1990 to 1994 (%) - Multirace
Year householder moved into unit - Moved in 1990 to 1994 (%) - Other Race
Year householder moved into unit - Moved in 1980 to 1989 (%)
Year householder moved into unit - Moved in 1980 to 1989 (%) - White
Year householder moved into unit - Moved in 1980 to 1989 (%) - Black or African American
Year householder moved into unit - Moved in 1980 to 1989 (%) - Asian
Year householder moved into unit - Moved in 1980 to 1989 (%) - Hispanic or Latino
Year householder moved into unit - Moved in 1980 to 1989 (%) - American Indian and Alaska Native
Year householder moved into unit - Moved in 1980 to 1989 (%) - Multirace
Year householder moved into unit - Moved in 1980 to 1989 (%) - Other Race
Year householder moved into unit - Moved in 1970 to 1979 (%)
Year householder moved into unit - Moved in 1970 to 1979 (%) - White
Year householder moved into unit - Moved in 1970 to 1979 (%) - Black or African American
Year householder moved into unit - Moved in 1970 to 1979 (%) - Asian
Year householder moved into unit - Moved in 1970 to 1979 (%) - Hispanic or Latino
Year householder moved into unit - Moved in 1970 to 1979 (%) - American Indian and Alaska Native
Year householder moved into unit - Moved in 1970 to 1979 (%) - Multirace
Year householder moved into unit - Moved in 1970 to 1979 (%) - Other Race
Year householder moved into unit - Moved in 1969 or earlier (%)
Year householder moved into unit - Moved in 1969 or earlier (%) - White
Year householder moved into unit - Moved in 1969 or earlier (%) - Black or African American
Year householder moved into unit - Moved in 1969 or earlier (%) - Asian
Year householder moved into unit - Moved in 1969 or earlier (%) - Hispanic or Latino
Year householder moved into unit - Moved in 1969 or earlier (%) - American Indian and Alaska Native
Year householder moved into unit - Moved in 1969 or earlier (%) - Multirace
Year householder moved into unit - Moved in 1969 or earlier (%) - Other Race
Housing units lacking complete plumbing facilities (%)
Housing units lacking complete kitchen facilities (%)
House heating fuel used in houses and condos - Utility gas (%)
House heating fuel used in houses and condos - Bottled, tank, or LP gas (%)
House heating fuel used in houses and condos - Electricity (%)
House heating fuel used in houses and condos - Fuel oil, kerosene, etc. (%)
House heating fuel used in houses and condos - Coal or coke (%)
House heating fuel used in houses and condos - Wood (%)
House heating fuel used in houses and condos - Solar energy (%)
House heating fuel used in houses and condos - Other fuel (%)
House heating fuel used in houses and condos - No fuel used (%)
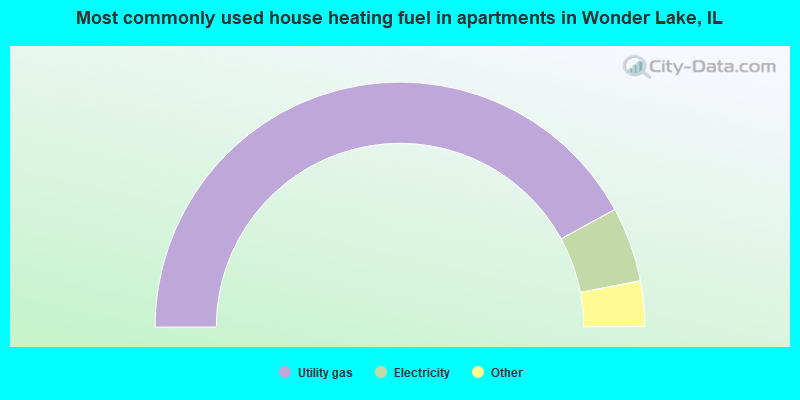
House heating fuel used in apartments - Utility gas (%)
House heating fuel used in apartments - Bottled, tank, or LP gas (%)
House heating fuel used in apartments - Electricity (%)
House heating fuel used in apartments - Fuel oil, kerosene, etc. (%)
House heating fuel used in apartments - Coal or coke (%)
House heating fuel used in apartments - Wood (%)
House heating fuel used in apartments - Solar energy (%)
House heating fuel used in apartments - Other fuel (%)
House heating fuel used in apartments - No fuel used (%)
Household type by relationship:
Households: 307,113
In family households: 273,656 (63,850 male householders , 18,438 female householders )
67,988 spouses , 103,852 children (97,485 natural , 2,177 adopted , 4,190 stepchildren ), 4,026 grandchildren , 2,227 brothers or sisters , 2,314 parents , foster children , 3,142 other relatives , 5,814 non-relatives In nonfamily households: 33,457 (13,228 male householders (9,980 living alone )), 13,683 female householders (11,640 living alone )), 6,546 nonrelatives In group quarters: 1,647 (1,337 institutionalized population)
65,142 married couples with children. single-parent households (2,453 men , 6,974 women ).
91.5% of residents of Wonder Lake speak English at home. of residents speak Spanish at home (56% speak English very well , 22% speak English well , 19% speak English not well , 3% don't speak English at all ).of residents speak other Indo-European language at home (77% speak English very well , 19% speak English well , 3% speak English not well ).of residents speak Asian or Pacific Island language at home (9% speak English very well , 57% speak English well , 35% speak English not well ).of residents speak other language at home (12% speak English very well , 88% speak English well ).
Foreign born population: 552 (6.1%)of them are naturalized citizens )
Median number of rooms in houses and condos:
Median number of rooms in apartments
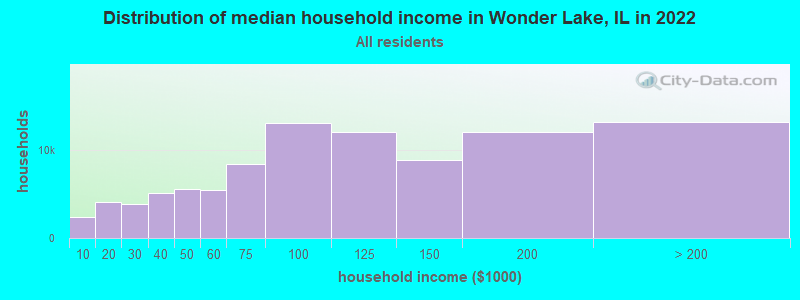
Wonder Lake, IL household income distribution 2,354 Less than $10,0004,071 $10,000 to $19,9993,829 $20,000 to $29,9995,171 $30,000 to $39,9995,566 $40,000 to $49,9995,510 $50,000 to $59,9998,395 $60,000 to $74,99913,125 $75,000 to $99,99912,132 $100,000 to $124,9998,886 $125,000 to $149,99912,062 $150,000 to $199,99913,232 $200,000 or more
Percentage of workers working in this county: 80.5%Number of people working at home: 793 (16.5% of all workers )
Travel time to work (commute)
Less than 5 minutes: 975 to 9 minutes: 17910 to 14 minutes: 43115 to 19 minutes: 50120 to 24 minutes: 55225 to 29 minutes: 36530 to 34 minutes: 54135 to 39 minutes: 9740 to 44 minutes: 17445 to 59 minutes: 35060 to 89 minutes: 28890 or more minutes: 245
Means of transportation to work:
Drove a car alone: 3,335 (86.0%)Carpooled: 394 (10.2%)Bus or trolley bus : 9 (0.2%)Streetcar or trolley car : 4 (0.1%)Railroad : 29 (0.7%)Walked: 44 (1.1%)Other means: 5 (0.1%)Worked at home: 56 (1.4%)
Year of entry for the foreign-born population in Wonder Lake, Illinois
66 1995 to March 2000 17 1990 to 1994 55 1985 to 1989 37 1980 to 1984 32 1975 to 1979 16 1970 to 1974 23 1965 to 1969 97 Before 1965
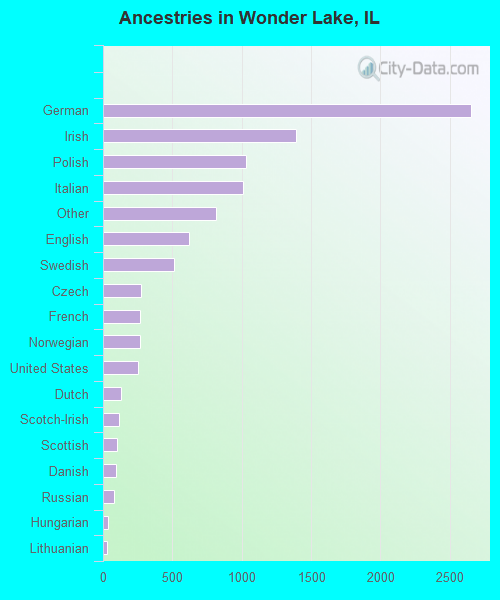
First ancestries reported:
German: 2,651 (27.2%)
Irish: 1,390 (14.2%)
Polish: 1,031 (10.6%)
Italian: 1,008 (10.3%)
Other: 816 (8.4%)
English: 619 (6.3%)
Swedish: 509 (5.2%)
Czech: 273 (2.8%)
French: 265 (2.7%)
Norwegian: 265 (2.7%)
United States: 256 (2.6%)
Dutch: 132 (1.4%)
Scotch-Irish: 115 (1.2%)
Scottish: 102 (1.0%)
Danish: 95 (1.0%)
Russian: 81 (0.8%)
Hungarian: 36 (0.4%)
Lithuanian: 30 (0.3%)
French Canadian: 22 (0.2%)
Greek: 22 (0.2%)
Welsh: 15 (0.2%)
Swiss: 13 (0.1%)
Slovak: 12 (0.1%)
Ukrainian: 6 (0.06%) Most common places of birth for foreign-born residents (%): Mexico Wonder Lake:
43.1% (148)Illinois:
40.4% (617,828)
United Kingdom Wonder Lake:
10.2% (35)Illinois:
1.3% (20,130)
Germany Wonder Lake:
9.0% (31)Illinois:
2.1% (32,764)
Poland Wonder Lake:
7.0% (24)Illinois:
9.1% (139,710)
Czechoslovakia (includes Czech Republic and Slovakia) Wonder Lake:
5.0% (17)Illinois:
0.5% (7,538)
Australia Wonder Lake:
3.8% (13)Illinois:
0.1% (1,813)
Romania Wonder Lake:
3.5% (12)Illinois:
0.8% (12,017)
Yugoslavia Wonder Lake:
3.5% (12)Illinois:
1.0% (15,301)
Philippines Wonder Lake:
3.2% (11)Illinois:
4.4% (67,072)
Ireland Wonder Lake:
2.9% (10)Illinois:
0.7% (10,958)
Canada Wonder Lake:
2.9% (10)Illinois:
1.2% (19,098)
Place of birth for U.S.-born residents:
This state: 5,930Other state: 1,278Northeast: 191Midwest: 684South: 223West: 180 60% of Wonder Lake residents lived in the same house 5 years ago.
Out of people who lived in different houses, 67% lived in this county.
Out of people who lived in different counties, 70% lived in Illinois.
Education attainment for males 25 years and older:
No schooling: 18Nursery to 4th grade: 15th and 6th grade: 127th and 8th grade: 529th grade: 2710th grade: 8511th grade: 3212th grade, no diploma: 63High school graduate (or equivalency): 1,103Less than 1 year of college: 248Some college more than 1 year, no degree: 451Associate degree: 104Bachelor's degree: 147Master's degree: 75Professional school degree: 24Doctorate degree: 2
Education attainment for females 25 years and older:
No schooling: 19Nursery to 4th grade: 15th and 6th grade: 117th and 8th grade: 819th grade: 2710th grade: 10211th grade: 10012th grade, no diploma: 90High school graduate (or equivalency): 859Less than 1 year of college: 364Some college more than 1 year, no degree: 381Associate degree: 168Bachelor's degree: 187Master's degree: 54Professional school degree: 0Doctorate degree: 2
Housing units in structures:
One, detached: 3,015Two: 34Housing units lacking complete kitchen facilities: 0.6%Private vs. public school enrollment:
Students in private schools in grades 1 to 8 (elementary and middle school): 30 Students in private schools in grades 9 to 12 (high school): 39 Students in private undergraduate colleges: 43