Winston-Salem, NC (North Carolina) Houses and Residents
| Winston-Salem: | $231,800 |
| North Carolina: | $280,600 |
Mean price in 2022:
Detached houses: $297,167
Here: $297,167 State: $375,326 Townhouses or other attached units: $207,197
Here: $207,197 State: $317,935 In 2-unit structures: $187,017
Here: $187,017 State: $250,488 In 3-to-4-unit structures: $243,081
Here: $243,081 State: $254,939 In 5-or-more-unit structures: $224,032
Here: $224,032 State: $329,290 Mobile homes: $76,883
Here: $76,883 State: $124,933
Total population: 239,269 (Urban population: 185,338, Rural population: 142 (all nonfarm))
Houses: 114,796 (100,769 occupied: 54,906 owner occupied, 45,863 renter occupied)
| % of renters here: | 46% |
| State: | 33% |
Housing density: 1,055 houses/condos per square mile
Median price asked for vacant for-sale houses and condos in 2022: $241,239.
Median contract rent in 2022: $840 (lower quartile is $624, upper quartile is $1,237)
Median rent asked for vacant for-rent units in 2022: $1,227
Median gross rent in Winston-Salem, NC in 2022: $1,011
Housing units in Winston-Salem with a mortgage: 35,239 (4,642 second mortgage, 21 home equity loan, 4,180 both second mortgage and home equity loan)
Houses without a mortgage: 1,302
Median household income for houses/condos with a mortgage: $79,290
Median household income for apartments without a mortgage: $63,209
Median monthly housing costs: $1,010
Compare current foreclosures near Winston-Salem, NC:
| Photo | Address | Area | Beds / Baths | Price | Details |
|---|---|---|---|---|---|

|
#1
Silas Creek Pkwy
Winston Salem, NC 27103
|
1,372 sq. feet
|
2 baths 3 beds |
$280,000
|
show details |

|
#2
Highway 65 West
Walnut Cove, NC 27052
|
2,126 sq. feet
|
2 baths 3 beds |
$310,000
|
show details |

|
#3
Lester Ln
Winston Salem, NC 27103
|
1,557 sq. feet
|
2 baths 4 beds |
$290,000
|
show details |

|
#4
Nancy Ln
Winston Salem, NC 27107
|
1,050 sq. feet
|
1 baths 3 beds |
$165,000
|
show details |

|
#5
Hastings Hill Rd
Kernersville, NC 27284
|
912 sq. feet
|
1 baths 2 beds |
$29,900
|
show details |

|
#6
Angel Oaks Dr
Winston Salem, NC 27105
|
1,692 sq. feet
|
2 baths 3 beds |
show details | |

|
#7
Bangor Dr
Winston Salem, NC 27107
|
1,682 sq. feet
|
2 baths 4 beds |
show details | |

|
#8
Boyer Dr
Clemmons, NC 27012
|
3,170 sq. feet
|
3 baths 5 beds |
show details | |

|
#9
Bethel Ridge Dr
Oak Ridge, NC 27310
|
3,234 sq. feet
|
3 baths 4 beds |
show details | |

|
#10
Buddingbrook Ln
Winston Salem, NC 27106
|
2,471 sq. feet
|
3 baths 4 beds |
show details |
| Photo | Address | Area | Beds / Baths | Price | Details |
|---|---|---|---|---|---|

|
#11
Lassiter Dr
High Point, NC 27265
|
1,383 sq. feet
|
2 baths 3 beds |
show details | |

|
#12
Red Copper Cir
Winston Salem, NC 27106
|
1,104 sq. feet
|
1 baths 1 beds |
show details | |

|
#13
Rindle Dr
High Point, NC 27262
|
1,730 sq. feet
|
2 baths 4 beds |
show details | |

|
#14
Maple Branch Dr
High Point, NC 27265
|
3,450 sq. feet
|
3 baths 4 beds |
show details | |

|
#15
Aspen Grove Dr
Belews Creek, NC 27009
|
2,370 sq. feet
|
2 baths 3 beds |
show details | |

|
#16
Midian Ct
Winston Salem, NC 27105
|
1,152 sq. feet
|
2 baths 3 beds |
show details | |

|
#17
Coalson Dr
Walkertown, NC 27051
|
2,405 sq. feet
|
2 baths 4 beds |
show details | |

|
#18
Northridge Dr
King, NC 27021
|
1,682 sq. feet
|
2 baths 3 beds |
show details | |

|
#19
Pope Hill Ct
Kernersville, NC 27284
|
1,352 sq. feet
|
2 baths 3 beds |
show details | |

|
#20
Oak Garden Dr
Kernersville, NC 27284
|
2,284 sq. feet
|
2 baths 3 beds |
show details |
| Photo | Address | Area | Beds / Baths | Price | Details |
|---|---|---|---|---|---|

|
#21
Prince Charles Dr
Kernersville, NC 27284
|
1,496 sq. feet
|
1 baths 3 beds |
show details | |

|
#22
Meadowbrook Dr
King, NC 27021
|
1,614 sq. feet
|
1 baths 3 beds |
show details | |

|
#23
Shadetree Dr
Winston Salem, NC 27107
|
2,550 sq. feet
|
2 baths 4 beds |
show details | |

|
#24
Rainwood Dr
Winston Salem, NC 27107
|
1,431 sq. feet
|
2 baths 3 beds |
show details | |

|
#25
Scarlett Dr
High Point, NC 27265
|
1,682 sq. feet
|
2 baths 3 beds |
show details | |

|
#26
W Lexington Ave
High Point, NC 27262
|
2,016 sq. feet
|
2 baths 3 beds |
show details | |

|
#27
Mallard View Ln
Winston Salem, NC 27127
|
1,776 sq. feet
|
2 baths 3 beds |
show details | |

|
#28
Knob Hill Dr
Clemmons, NC 27012
|
2,300 sq. feet
|
2 baths 3 beds |
show details | |

|
#29
Brook Stone Ct
Clemmons, NC 27012
|
2,034 sq. feet
|
2 baths 3 beds |
show details | |

|
#30
Wyo Rd
Mocksville, NC 27028
|
768 sq. feet
|
1 baths 2 beds |
show details |
| Photo | Address | Area | Beds / Baths | Price | Details |
|---|---|---|---|---|---|

|
#31
Elk Valley Ct
Winston Salem, NC 27103
|
2,030 sq. feet
|
2 baths 3 beds |
show details | |

|
#32
Parkdale Dr
Clemmons, NC 27012
|
1,920 sq. feet
|
2 baths 3 beds |
show details | |

|
#33
Pondhaven Dr
High Point, NC 27265
|
2,521 sq. feet
|
2 baths 4 beds |
show details | |

|
#34
Watercrest Ct
Kernersville, NC 27284
|
2,236 sq. feet
|
2 baths 4 beds |
show details | |

|
#35
Tumbleweed Dr
Winston Salem, NC 27127
|
2,042 sq. feet
|
2 baths 3 beds |
show details | |

|
#36
Lamore Ct
Winston Salem, NC 27107
|
2,768 sq. feet
|
2 baths 3 beds |
show details | |

|
#37
Pecan Ridge Cir
Kernersville, NC 27284
|
2,299 sq. feet
|
2 baths 4 beds |
show details | |

|
#38
Eagle Point Ct
Kernersville, NC 27284
|
2,232 sq. feet
|
2 baths 4 beds |
show details | |

|
#39
Lake Valley Dr
Winston Salem, NC 27107
|
2,285 sq. feet
|
2 baths 3 beds |
show details | |

|
#40
Eagle Crest Dr
Pfafftown, NC 27040
|
2,520 sq. feet
|
2 baths 3 beds |
show details |
| Photo | Address | Area | Beds / Baths | Price | Details |
|---|---|---|---|---|---|

|
#41
Lalanda Dr
Lewisville, NC 27023
|
1,567 sq. feet
|
1 baths 3 beds |
show details | |

|
#42
Herinhut Rd
Winston Salem, NC 27127
|
2,357 sq. feet
|
2 baths 3 beds |
show details | |

|
#43
Prestwick Ln
Rural Hall, NC 27045
|
1,349 sq. feet
|
1 baths 3 beds |
show details | |

|
#44
Mount Hope Dr
Winston Salem, NC 27107
|
1,252 sq. feet
|
2 baths 3 beds |
show details | |

|
#45
S Stratford Rd
Winston Salem, NC 27103
|
1,508 sq. feet
|
2 baths 3 beds |
show details | |

|
#46
Blue Stone Ln
Winston Salem, NC 27107
|
1,536 sq. feet
|
2 baths 3 beds |
show details | |

|
#47
Alabnon Rd
Lewisville, NC 27023
|
1,542 sq. feet
|
2 baths 3 beds |
show details | |

|
#48
Greenly Dr
Pfafftown, NC 27040
|
2,360 sq. feet
|
2 baths 4 beds |
show details | |

|
#49
Willow Bend Dr
Kernersville, NC 27284
|
1,240 sq. feet
|
2 baths 3 beds |
show details | |

|
Check over 1 million property listings on Foreclosure.com!
|
browse all offers | |||

Latest news about housing in Winston-Salem, NC collected exclusively by city-data.com from local newspapers, TV, and radio stations


Median year apartment built: 1982
Household type by relationship:
Households: 251,343- Male householders: 43,098 (13,672 living alone), Female householders: 57,671 (19,682 living alone)
37,158 spouses (36,692 opposite-sex spouses), 5,929 unmarried partners, (5,748 opposite-sex unmarried partners), 73,088 children (70,398 natural, 753 adopted, 1,937 stepchildren), 6,154 grandchildren, 4,028 brothers or sisters, 3,820 parents, 133 foster children, 5,013 other relatives, 5,168 non-relatives
- In group quarters: 10,083
Size of family households: 31,148 2-persons, 13,608 3-persons, 9,096 4-persons, 5,144 5-persons, 1,047 6-persons, 713 7-or-more-persons.
Size of nonfamily households: 33,354 1-person, 5,957 2-persons, 270 3-persons, 432 4-persons.
28,146 married couples with children.
22,914 single-parent households (1,495 men, 21,419 women).
81.4% of residents of Winston-Salem speak English at home.
13.9% of residents speak Spanish at home (58% speak English very well, 20% speak English well, 13% speak English not well, 9% don't speak English at all).
2.0% of residents speak other Indo-European language at home (72% speak English very well, 18% speak English well, 9% speak English not well, 1% don't speak English at all).
1.6% of residents speak Asian or Pacific Island language at home (70% speak English very well, 20% speak English well, 5% speak English not well, 5% don't speak English at all).
1.0% of residents speak other language at home (81% speak English very well, 10% speak English well, 9% speak English not well).
Foreign born population: 26,601 (10.6%)
(28.1% of them are naturalized citizens)
| Here: | 6.4 |
| State: | 6.4 |
| Here: | 4.3 |
| State: | 4.4 |

- Bedrooms in owner-occupied houses and condos in Winston-Salem, North Carolina
- 99no bedroom
- 5711 bedroom
- 7,1532 bedrooms
- 30,0053 bedrooms
- 13,5224 bedrooms
- 3,5565+ bedrooms

- Bedrooms in renter-occupied apartments in Winston-Salem, North Carolina
- 1,376no bedroom
- 9,4871 bedroom
- 19,3822 bedrooms
- 13,8083 bedrooms
- 1,7384 bedrooms
- 725+ bedrooms

- Cars and other vehicles available in Winston-Salem in owner-occupied houses/condos
- 1,034no vehicle
- 13,8321 vehicle
- 25,0732 vehicles
- 11,1953 vehicles
- 2,5204 vehicles
- 1,2525+ vehicles
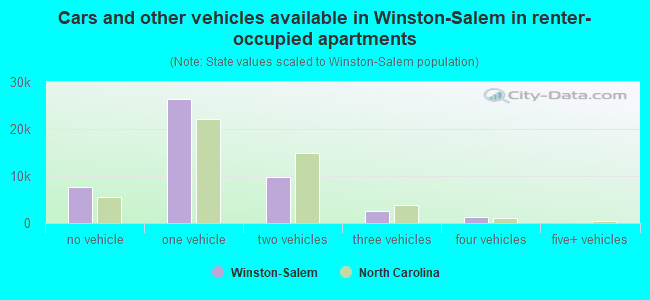
- Cars and other vehicles available in Winston-Salem in renter-occupied apartments
- 5,426no vehicle
- 26,0511 vehicle
- 12,4732 vehicles
- 9813 vehicles
- 9324 vehicles
- 05+ vehicles

- Rooms in owner-occupied houses in Winston-Salem, North Carolina
- 991 room
- 1122 rooms
- 1243 rooms
- 5,7674 rooms
- 9,1325 rooms
- 13,0276 rooms
- 8,1287 rooms
- 7,1308 rooms
- 11,3879+ rooms

- Rooms in renter-occupied apartments in Winston-Salem, North Carolina
- 1,2451 room
- 2,2442 rooms
- 8,5163 rooms
- 13,3484 rooms
- 11,2065 rooms
- 4,4736 rooms
- 2,6967 rooms
- 9548 rooms
- 1,1819+ rooms


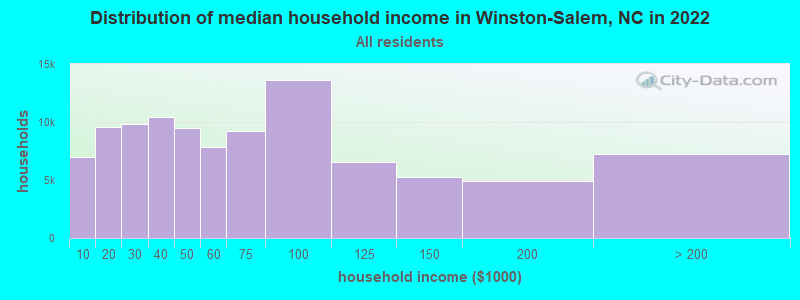
Winston-Salem, NC household income distribution

- 6,962Less than $10,000
- 9,562$10,000 to $19,999
- 9,838$20,000 to $29,999
- 10,416$30,000 to $39,999
- 9,468$40,000 to $49,999
- 7,821$50,000 to $59,999
- 9,192$60,000 to $74,999
- 13,605$75,000 to $99,999
- 6,569$100,000 to $124,999
- 5,217$125,000 to $149,999
- 4,911$150,000 to $199,999
- 7,208$200,000 or more
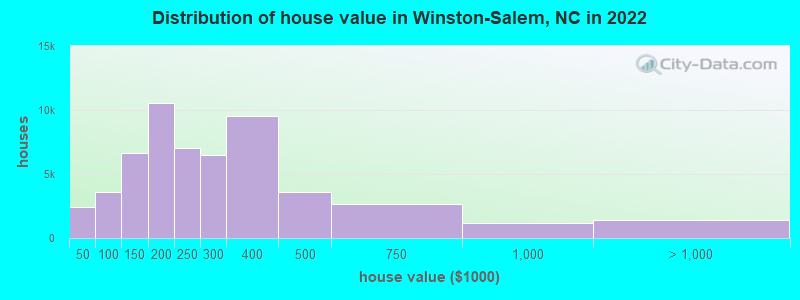
Home value of owner - occupied houses in 2022 in Winston-Salem, NC
-
- 402Less than $10,000
- 98$10,000 to $14,999
- 506$15,000 to $19,999
- 498$20,000 to $24,999
- 428$25,000 to $29,999
- 90$30,000 to $34,999
- 146$35,000 to $39,999
- 222$40,000 to $49,999
- 128$50,000 to $59,999
- 640$60,000 to $69,999
- 336$70,000 to $79,999
- 1,243$80,000 to $89,999
- 1,046$90,000 to $99,999
- 3,269$100,000 to $124,999
- 3,376$125,000 to $149,999
- 6,792$150,000 to $174,999
- 3,761$175,000 to $199,999
- 7,041$200,000 to $249,999
- 6,499$250,000 to $299,999
- 9,503$300,000 to $399,999
- 3,616$400,000 to $499,999
- 2,663$500,000 to $749,999
- 1,168$750,000 to $999,999
- 690$1,000,000 to $1,499,999
- 278$1,500,000 to $1,999,999
- 467$2,000,000 or more
Rent paid by renters in 2022 in Winston-Salem, NC
-
- 41Less than $100
- 502$100 to $149
- 115$150 to $199
- 574$200 to $249
- 332$250 to $299
- 981$300 to $349
- 1,331$350 to $399
- 79$400 to $449
- 693$450 to $499
- 2,682$500 to $549
- 2,207$550 to $599
- 2,950$600 to $649
- 3,345$650 to $699
- 2,643$700 to $749
- 1,956$750 to $799
- 3,681$800 to $899
- 3,998$900 to $999
- 5,023$1,000 to $1,249
- 4,609$1,250 to $1,499
- 4,983$1,500 to $1,999
- 438$2,000 to $2,499
- 148$2,500 to $2,999
- 96$3,000 to $3,499
- 429$3,500 or more
- 2,027No cash rent


Percentage of workers working in this county: 82.7%
Number of people working at home: 16,733 (15.0% of all workers)
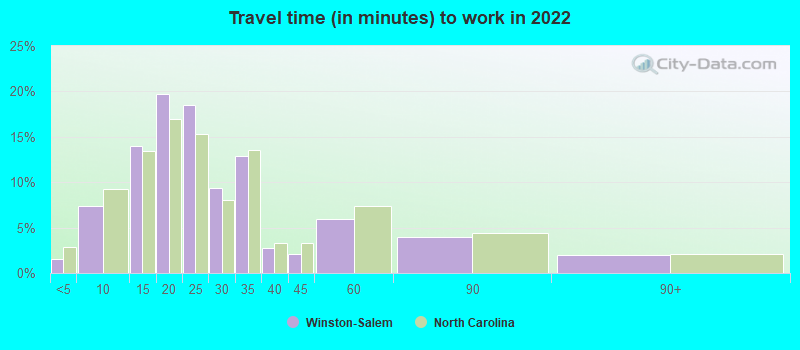
Travel time to work (commute)
- Less than 5 minutes: 1,428
- 5 to 9 minutes: 9,464
- 10 to 14 minutes: 16,332
- 15 to 19 minutes: 20,762
- 20 to 24 minutes: 15,395
- 25 to 29 minutes: 10,058
- 30 to 34 minutes: 10,170
- 35 to 39 minutes: 881
- 40 to 44 minutes: 1,482
- 45 to 59 minutes: 1,861
- 60 to 89 minutes: 4,478
- 90 or more minutes: 2,620
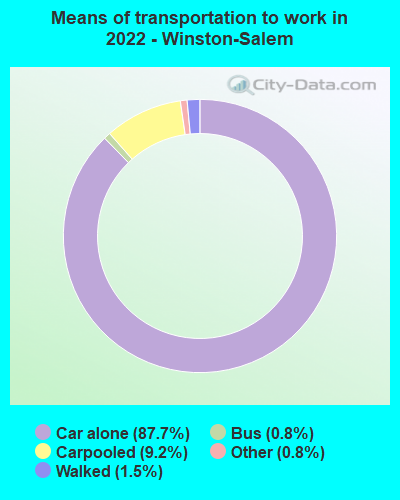
Means of transportation to work:
- Drove a car alone: 110,024 (77.4%)
- Carpooled: 11,502 (8.1%)
- Bus: 959 (0.7%)
- Taxi: 1,002 (0.7%)
- Bicycle: 69 (0.0%)
- Walked: 1,886 (1.3%)
- Worked at home: 16,733 (11.8%)

- Unemployment by race in 2022
- Unemployment rate for White non-Hispanic residents
- 3.1%Males
- 3.4%Females
- Unemployment rate for Black residents
- 9.3%Males
- 9.8%Females
- Unemployment rate for American Indian and Alaska Native residents
- 1.8%Males
- Unemployment rate for Asian residents
- 1.3%Males
- 3.9%Females
- Unemployment rate for other race residents
- 1.9%Males
- 8.0%Females
- Unemployment rate for two or more race residents
- 10.2%Males
- 8.6%Females
- Unemployment rate for Hispanic or Latino residents
- 5.8%Males
- 2.4%Females

- Year of entry for the foreign-born population in Winston-Salem, North Carolina
- 10,1742010 or later
- 7,9962000 to 2009
- 5,4921990 to 1999
- 2,8741980 to 1989
- 9391970 to 1979
- 814Before 1970
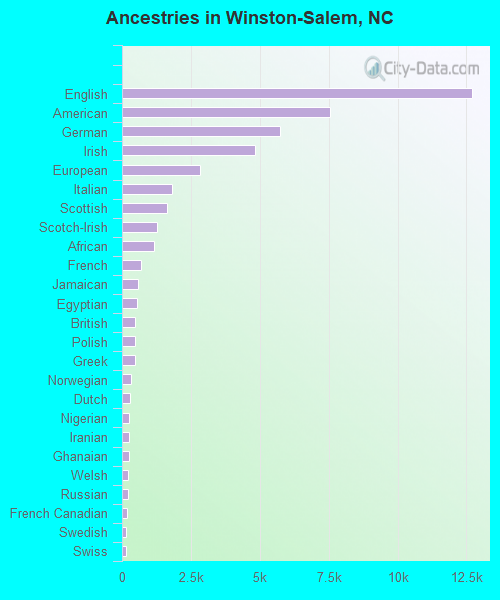
First ancestries reported:
- English: 12,686 (8.6%)
- American: 7,553 (5.1%)
- German: 5,750 (3.9%)
- Irish: 4,839 (3.3%)
- European: 2,815 (1.9%)
- Italian: 1,820 (1.2%)
- Scottish: 1,626 (1.1%)
- Scotch-Irish: 1,259 (0.9%)
- African: 1,173 (0.8%)
- French: 680 (0.5%)
- Jamaican: 574 (0.4%)
- Egyptian: 540 (0.4%)
- British: 483 (0.3%)
- Polish: 458 (0.3%)
- Greek: 454 (0.3%)
- Norwegian: 310 (0.2%)
- Dutch: 284 (0.2%)
- Nigerian: 245 (0.2%)
- Iranian: 239 (0.2%)
- Ghanaian: 238 (0.2%)
- Welsh: 235 (0.2%)
- Russian: 201 (0.1%)
- French Canadian: 191 (0.1%)
- Swedish: 159 (0.1%)
- Swiss: 156 (0.1%)
- Sudanese: 147 (0.10%)
- Senegalese: 144 (0.10%)
- Eastern European: 138 (0.09%)
- Czech: 136 (0.09%)
- Zimbabwean: 133 (0.09%)
- Haitian: 127 (0.09%)
- Northern European: 117 (0.08%)
- New Zealander: 105 (0.07%)
- Guyanese: 100 (0.07%)
- Scandinavian: 98 (0.07%)
- Moroccan: 97 (0.07%)
- Hungarian: 96 (0.06%)
- Ukrainian: 96 (0.06%)
- Romanian: 92 (0.06%)
- Danish: 79 (0.05%)
- Croatian: 78 (0.05%)
- Lebanese: 76 (0.05%)
- Brazilian: 74 (0.05%)
- Canadian: 71 (0.05%)
- Portuguese: 67 (0.05%)
- Estonian: 63 (0.04%)
- Ugandan: 62 (0.04%)
- Arab: 59 (0.04%)
- Slovak: 55 (0.04%)
- Austrian: 49 (0.03%)
- Czechoslovakian: 41 (0.03%)
- Pennsylvania German: 31 (0.02%)
- Finnish: 29 (0.02%)
- Armenian: 29 (0.02%)
- West Indian: 28 (0.02%)
- Celtic: 27 (0.02%)
- Kenyan: 27 (0.02%)
- Cape Verdean: 25 (0.02%)
- Trinidadian and Tobagonian: 24 (0.02%)
- Turkish: 22 (0.01%)
- Australian: 21 (0.01%)
- Lithuanian: 15 (0.01%)
- Serbian: 14 (0.01%)
- U.S. Virgin Islander: 13 (0.01%)
- Yugoslavian: 11 (0.01%)
- Israeli: 10 (0.01%)
- Slavic: 8 (0.01%)
- Ethiopian: 8 (0.01%)
Most common places of birth for foreign-born residents (%):
| Winston-Salem: | 35.6% (9,798) |
| North Carolina: | 24.7% (214,776) |
| Winston-Salem: | 8.5% (2,331) |
| North Carolina: | 3.8% (33,379) |
| Winston-Salem: | 4.9% (1,352) |
| North Carolina: | 9.3% (80,594) |
| Winston-Salem: | 4.5% (1,241) |
| North Carolina: | 3.2% (27,477) |
| Winston-Salem: | 3.9% (1,071) |
| North Carolina: | 2.1% (18,275) |
| Winston-Salem: | 3.1% (853) |
| North Carolina: | 2.6% (22,964) |
| Winston-Salem: | 2.4% (661) |
| North Carolina: | 1.7% (15,135) |
| Winston-Salem: | 2.3% (620) |
| North Carolina: | 4.7% (40,707) |
| Winston-Salem: | 2.3% (620) |
| North Carolina: | 0.6% (4,847) |
| Winston-Salem: | 1.8% (507) |
| North Carolina: | 2.4% (20,695) |
Place of birth for U.S.-born residents:
- This state: 141,342
- Other state: 79,425
- Northeast: 26,499
- Midwest: 13,119
- South: 33,309
- West: 6,498
85.6% of Winston-Salem residents lived in the same house 1 years ago.
Out of people who lived in different houses, 28.9% lived in this county.
Out of people who lived in different counties, 47.3% lived in North Carolina.
| Winston-Salem: | 85.6% |
| State average: | 87.3% |
Education attainment for males 25 years and older:
- No schooling: 1,489
- Nursery to 4th grade: 369
- 5th and 6th grade: 574
- 7th and 8th grade: 1,420
- 9th grade: 1,123
- 10th grade: 1,799
- 11th grade: 1,469
- 12th grade, no diploma: 1,554
- High school graduate (or equivalency): 17,230
- Less than 1 year of college: 4,715
- Some college more than 1 year, no degree: 9,524
- Associate degree: 4,453
- Bachelor's degree: 15,649
- Master's degree: 7,948
- Professional school degree: 2,402
- Doctorate degree: 2,822

Education attainment for females 25 years and older:
- No schooling: 2,485
- Nursery to 4th grade: 0
- 5th and 6th grade: 982
- 7th and 8th grade: 1,627
- 9th grade: 1,139
- 10th grade: 1,102
- 11th grade: 985
- 12th grade, no diploma: 580
- High school graduate (or equivalency): 17,936
- Less than 1 year of college: 7,753
- Some college more than 1 year, no degree: 10,755
- Associate degree: 6,810
- Bachelor's degree: 22,309
- Master's degree: 8,578
- Professional school degree: 2,503
- Doctorate degree: 2,631


Housing units in structures:
- One, detached: 71,222
- One, attached: 5,744
- Two: 1,522
- 3 or 4: 5,769
- 5 to 9: 6,998
- 10 to 19: 10,473
- 20 to 49: 4,543
- 50 or more: 6,642
- Mobile homes: 1,883
Median worth of mobile homes: $17,800
Housing units lacking complete kitchen facilities in 2022: 2.4%
House/condo owner moved in on average 13 years ago
Renter moved in on average 2 years ago

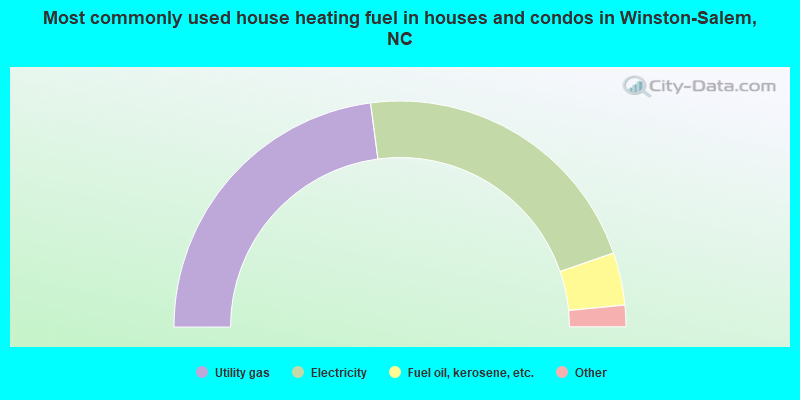
- 45.8%Utility gas
- 43.5%Electricity
- 7.5%Fuel oil, kerosene, etc.
- 2.0%Bottled, tank, or LP gas
- 0.8%No fuel used
- 0.2%Solar energy
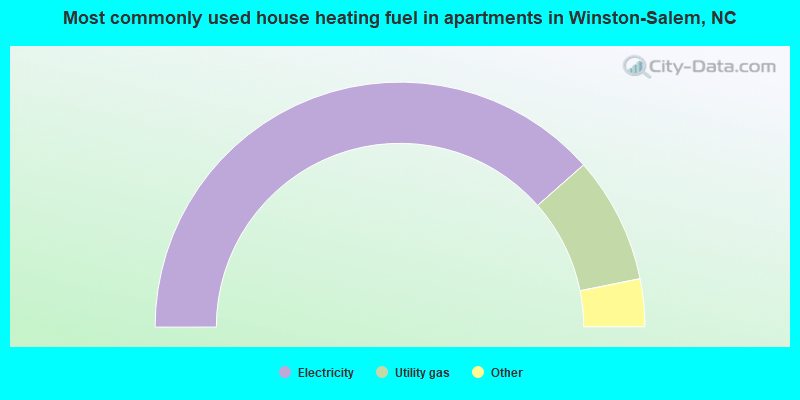
- 77.0%Electricity
- 16.7%Utility gas
- 3.2%Bottled, tank, or LP gas
- 1.5%No fuel used
- 1.5%Fuel oil, kerosene, etc.
- 0.1%Other fuel
Private vs. public school enrollment:
| Here: | 16.7% |
| North Carolina: | 13.8% |
| Here: | 8.9% |
| North Carolina: | 11.9% |
| Here: | 36.3% |
| North Carolina: | 19.3% |


