Winnetka, IL (Illinois) Houses and Residents
| Winnetka: | $1,223,867 |
| Illinois: | $251,600 |
Total population: 12,490 (Urban population: 12,388, Rural population: 0)
Houses: 4,748 (4,260 occupied: 4,000 owner occupied, 331 renter occupied)
| % of renters here: | 8% |
| State: | 33% |
Housing density: 1,240 houses/condos per square mile
Median price asked for vacant for-sale houses and condos in 2022: $713,999.
Median contract rent in 2022: $1,495 (lower quartile is $1,159, upper quartile is over $2,000)
Median rent asked for vacant for-rent units in 2022: $5,337
Median gross rent in Winnetka, IL in 2022: $1,642
Housing units in Winnetka with a mortgage: 2,691 (321 second mortgage, 0 home equity loan, 311 both second mortgage and home equity loan)
Houses without a mortgage: 97
Median household income for houses/condos with a mortgage: $239,328
Median household income for apartments without a mortgage: $213,834
Median monthly housing costs: $3,908
Compare current foreclosures near Winnetka, IL:
| Photo | Address | Area | Beds / Baths | Price | Details |
|---|---|---|---|---|---|

|
#1
Colonial Ln
Winnetka, IL 60093
|
1,374 sq. feet
|
1 baths - beds |
show details | |

|
#2
Hill Ter
Winnetka, IL 60093
|
2,426 sq. feet
|
2 baths - beds |
show details | |

|
#3
Sheridan Rd
Winnetka, IL 60093
|
5,800 sq. feet
|
4 baths - beds |
show details | |

|
#4
Harding Rd
Winnetka, IL 60093
|
2,220 sq. feet
|
2 baths - beds |
show details | |

|
#5
6th St
Winnetka, IL 60093
|
- sq. feet
|
- baths - beds |
show details | |

|
#6
10th St
Winnetka, IL 60093
|
- sq. feet
|
- baths - beds |
show details | |

|
#7
Willow Hill Ct
Winnetka, IL 60093
|
- sq. feet
|
- baths - beds |
show details | |

|
#8
Happ Rd
Winnetka, IL 60093
|
- sq. feet
|
- baths - beds |
show details | |

|
#9
Hibbard Rd
Winnetka, IL 60093
|
- sq. feet
|
- baths - beds |
show details | |

|
#10
10th St
Winnetka, IL 60093
|
- sq. feet
|
- baths - beds |
show details |
| Photo | Address | Area | Beds / Baths | Price | Details |
|---|---|---|---|---|---|

|
#11
N Sheridan Rd Apt 6e
Chicago, IL 60660
|
1,200 sq. feet
|
2 baths 2 beds |
$255,000
|
show details |

|
#12
S Lyman Ave
Des Plaines, IL 60016
|
2,233 sq. feet
|
2 baths 4 beds |
$330,000
|
show details |

|
#13
W Barry Ave Apt 3bc
Chicago, IL 60657
|
2,500 sq. feet
|
3 baths 4 beds |
$699,000
|
show details |

|
#14
N Olcott Ave
Chicago, IL 60634
|
2,161 sq. feet
|
2 baths 4 beds |
$559,000
|
show details |

|
#15
S Ridgeland Ave
Oak Park, IL 60302
|
2,400 sq. feet
|
3 baths 4 beds |
$625,000
|
show details |

|
#16
Carriage Way Dr
Arlington Heights, IL 60004
|
- sq. feet
|
2 baths 2 beds |
$179,900
|
show details |

|
#17
Webster Ln
Des Plaines, IL 60018
|
1,608 sq. feet
|
3 baths 3 beds |
$515,000
|
show details |

|
#18
W Van Buren St
Chicago, IL 60644
|
2,839 sq. feet
|
3 baths 8 beds |
$87,500
|
show details |

|
#19
N 4th Ave
Des Plaines, IL 60016
|
1,381 sq. feet
|
1 baths 3 beds |
$335,000
|
show details |

|
#20
N Francisco Ave
Chicago, IL 60659
|
1,100 sq. feet
|
1 baths 2 beds |
$159,000
|
show details |
| Photo | Address | Area | Beds / Baths | Price | Details |
|---|---|---|---|---|---|

|
#21
N 74th Ave
Elmwood Park, IL 60707
|
1,300 sq. feet
|
1 baths 3 beds |
$235,000
|
show details |

|
#22
N Austin Ave
Chicago, IL 60634
|
2,500 sq. feet
|
3 baths 4 beds |
$365,000
|
show details |

|
#23
Christiana Ave # 1
Skokie, IL 60076
|
1,400 sq. feet
|
1 baths 3 beds |
$319,000
|
show details |

|
#24
E Crest Ave
Addison, IL 60101
|
2,023 sq. feet
|
1 baths 5 beds |
$329,000
|
show details |

|
#25
Main St
Skokie, IL 60076
|
1,428 sq. feet
|
1 baths 3 beds |
$455,000
|
show details |

|
#26
Washington Blvd Apt 1
Oak Park, IL 60302
|
- sq. feet
|
1 baths 2 beds |
$149,900
|
show details |

|
#27
W Quincy St
Chicago, IL 60644
|
960 sq. feet
|
1 baths - beds |
$19,000
|
show details |

|
#28
Avenida Serra Test
Des Plaines, IL 60018
|
- sq. feet
|
2 baths 3 beds |
$100,000
|
show details |

|
#29
Woods Dr Unit Unit 2004
Skokie, IL 60077
|
- sq. feet
|
2 baths 3 beds |
$572,000
|
show details |

|
#30
W Arthington St
Chicago, IL 60612
|
969 sq. feet
|
1 baths - beds |
$20,000
|
show details |
| Photo | Address | Area | Beds / Baths | Price | Details |
|---|---|---|---|---|---|

|
#31
Lathrop Ave Apt 404
Forest Park, IL 60130
|
675 sq. feet
|
1 baths 1 beds |
show details | |

|
#32
N Canal St Apt 719
Chicago, IL 60606
|
1,250 sq. feet
|
1 baths 1 beds |
show details | |

|
#33
W Flournoy St
Chicago, IL 60624
|
1,288 sq. feet
|
2 baths - beds |
$17,000
|
show details |

|
#34
W Irving Park Rd Apt 4
Chicago, IL 60613
|
1,800 sq. feet
|
2 baths 3 beds |
show details | |

|
#35
N Lake Shore Dr Apt 21f
Chicago, IL 60657
|
2,200 sq. feet
|
3 baths 3 beds |
show details | |

|
#36
W Grenshaw St
Chicago, IL 60624
|
2,148 sq. feet
|
2 baths 6 beds |
show details | |

|
#37
W Corcoran Pl Apt 1
Chicago, IL 60644
|
- sq. feet
|
2 baths 3 beds |
$199,900
|
show details |

|
#38
Scarsdale Ct Unit C2
Schaumburg, IL 60193
|
950 sq. feet
|
1 baths 2 beds |
show details | |

|
#39
Rockwell Ln
Des Plaines, IL 60016
|
- sq. feet
|
2 baths 3 beds |
show details | |

|
#40
Broadway Ave
North Chicago, IL 60064
|
1,482 sq. feet
|
2 baths 3 beds |
show details |
| Photo | Address | Area | Beds / Baths | Price | Details |
|---|---|---|---|---|---|

|
#41
N Parkside Ave
Chicago, IL 60651
|
2,024 sq. feet
|
2 baths 4 beds |
show details | |

|
#42
Scott St
Franklin Park, IL 60131
|
1,648 sq. feet
|
2 baths 3 beds |
show details | |

|
#43
Oliphant Ave
Morton Grove, IL 60053
|
1,728 sq. feet
|
2 baths 4 beds |
show details | |

|
#44
Sheryl Ln
Glenview, IL 60025
|
1,269 sq. feet
|
2 baths 3 beds |
show details | |

|
#45
N Ridge Ave Apt 1w
Chicago, IL 60660
|
875 sq. feet
|
1 baths 2 beds |
show details | |

|
#46
S 5th Ave
Maywood, IL 60153
|
728 sq. feet
|
1 baths 1 beds |
show details | |

|
#47
Bentley Pl
Buffalo Grove, IL 60089
|
1,592 sq. feet
|
2 baths 2 beds |
show details | |

|
#48
Henley St
Glenview, IL 60025
|
3,575 sq. feet
|
2 baths 4 beds |
show details | |

|
#49
W Gettysburg St
Chicago, IL 60630
|
3,892 sq. feet
|
4 baths 7 beds |
show details | |

|
Check over 1 million property listings on Foreclosure.com!
|
browse all offers | |||

Latest news about housing in Winnetka, IL collected exclusively by city-data.com from local newspapers, TV, and radio stations


Median year apartment built: 1940
Household type by relationship:
Households: 12,326- Male householders: 2,446 (199 living alone), Female householders: 1,701 (375 living alone)
3,209 spouses (3,209 opposite-sex spouses), 30 unmarried partners, (30 opposite-sex unmarried partners), 4,522 children (4,339 natural, 125 adopted, 57 stepchildren), 77 grandchildren, 37 brothers or sisters, 20 parents, 0 foster children, 76 other relatives, 198 non-relatives
- In group quarters: 7
Size of family households: 1,296 2-persons, 775 3-persons, 872 4-persons, 480 5-persons, 133 6-persons.
Size of nonfamily households: 617 1-person, 53 2-persons, 18 5-persons.
3,498 married couples with children.
169 single-parent households (66 men, 103 women).
88.9% of residents of Winnetka speak English at home.
1.3% of residents speak Spanish at home (83% speak English very well, 10% speak English well, 7% speak English not well).
8.1% of residents speak other Indo-European language at home (89% speak English very well, 4% speak English well, 7% speak English not well).
1.3% of residents speak Asian or Pacific Island language at home (91% speak English very well, 9% speak English well).
0.3% of residents speak other language at home (100% speak English very well).
Foreign born population: 917 (7.4%)
(53.9% of them are naturalized citizens)
| Here: | 10.0 |
| State: | 6.4 |
| Here: | 4.0 |
| State: | 4.1 |

- Bedrooms in owner-occupied houses and condos in Winnetka, Illinois
- 0no bedroom
- 211 bedroom
- 2012 bedrooms
- 5593 bedrooms
- 1,6744 bedrooms
- 1,5455+ bedrooms

- Bedrooms in renter-occupied apartments in Winnetka, Illinois
- 27no bedroom
- 1391 bedroom
- 432 bedrooms
- 103 bedrooms
- 614 bedrooms
- 525+ bedrooms

- Cars and other vehicles available in Winnetka in owner-occupied houses/condos
- 45no vehicle
- 7851 vehicle
- 2,1762 vehicles
- 7993 vehicles
- 1484 vehicles
- 485+ vehicles

- Cars and other vehicles available in Winnetka in renter-occupied apartments
- 56no vehicle
- 1841 vehicle
- 922 vehicles
- 03 vehicles
- 04 vehicles
- 05+ vehicles

- Rooms in owner-occupied houses in Winnetka, Illinois
- 01 room
- 02 rooms
- 283 rooms
- 1374 rooms
- 605 rooms
- 2226 rooms
- 3427 rooms
- 5158 rooms
- 2,6989+ rooms

- Rooms in renter-occupied apartments in Winnetka, Illinois
- 271 room
- 372 rooms
- 643 rooms
- 624 rooms
- 205 rooms
- 06 rooms
- 87 rooms
- 378 rooms
- 779+ rooms


Winnetka, IL household income distribution

- 68Less than $10,000
- 52$10,000 to $19,999
- 101$20,000 to $29,999
- 107$30,000 to $39,999
- 60$40,000 to $49,999
- 146$50,000 to $59,999
- 224$60,000 to $74,999
- 119$75,000 to $99,999
- 205$100,000 to $124,999
- 155$125,000 to $149,999
- 316$150,000 to $199,999
- 2,676$200,000 or more

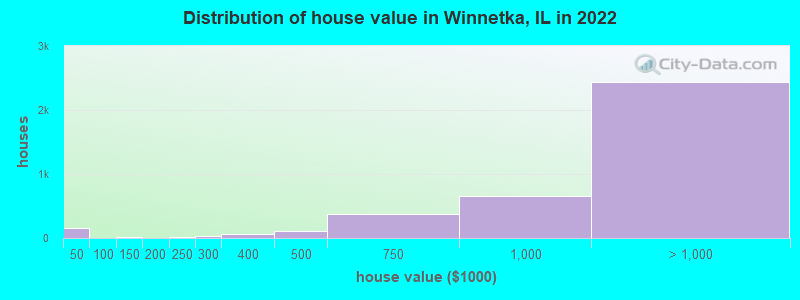
Home value of owner - occupied houses in 2022 in Winnetka, IL
-
- 119Less than $10,000
- 10$10,000 to $14,999
- 10$15,000 to $19,999
- 9$20,000 to $24,999
- 16$125,000 to $149,999
- 20$200,000 to $249,999
- 29$250,000 to $299,999
- 57$300,000 to $399,999
- 108$400,000 to $499,999
- 370$500,000 to $749,999
- 657$750,000 to $999,999
- 1,053$1,000,000 to $1,499,999
- 421$1,500,000 to $1,999,999
- 970$2,000,000 or more
Rent paid by renters in 2022 in Winnetka, IL
-
- 113$1,000 to $1,249
- 34$1,250 to $1,499
- 73$1,500 to $1,999
- 1$2,500 to $2,999
- 104$3,500 or more
- 30No cash rent


Percentage of workers working in this county: 91.2%
Number of people working at home: 1,683 (33.8% of all workers)
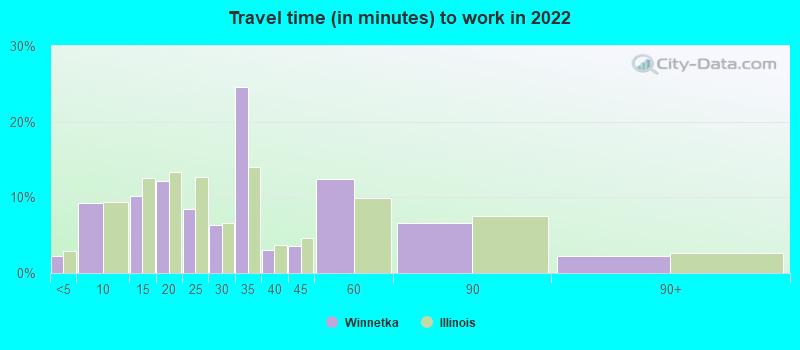
Travel time to work (commute)
- Less than 5 minutes: 74
- 5 to 9 minutes: 314
- 10 to 14 minutes: 190
- 15 to 19 minutes: 362
- 20 to 24 minutes: 354
- 25 to 29 minutes: 277
- 30 to 34 minutes: 288
- 35 to 39 minutes: 117
- 40 to 44 minutes: 253
- 45 to 59 minutes: 861
- 60 to 89 minutes: 366
- 90 or more minutes: 28
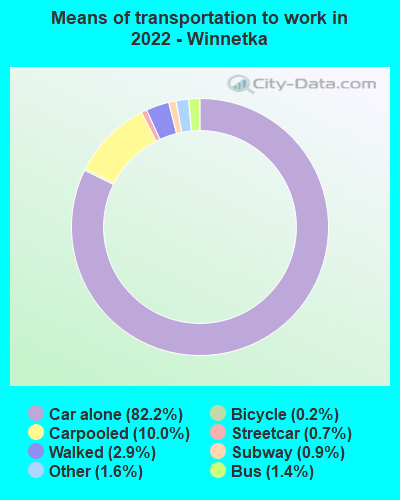
Means of transportation to work:
- Drove a car alone: 3,494 (62.1%)
- Carpooled: 456 (8.1%)
- Bus: 56 (1.0%)
- Subway or elevated rail: 24 (0.4%)
- Long-distance train or commuter rail: 26 (0.5%)
- Taxi: 66 (1.2%)
- Bicycle: 11 (0.2%)
- Walked: 128 (2.3%)
- Worked at home: 1,683 (29.9%)

- Unemployment by race in 2022
- Unemployment rate for White non-Hispanic residents
- 2.9%Males
- 2.4%Females
- Unemployment rate for Hispanic or Latino residents
- 19.0%Males

- Year of entry for the foreign-born population in Winnetka, Illinois
- 3612010 or later
- 2152000 to 2009
- 1591990 to 1999
- 771980 to 1989
- 911970 to 1979
- 253Before 1970
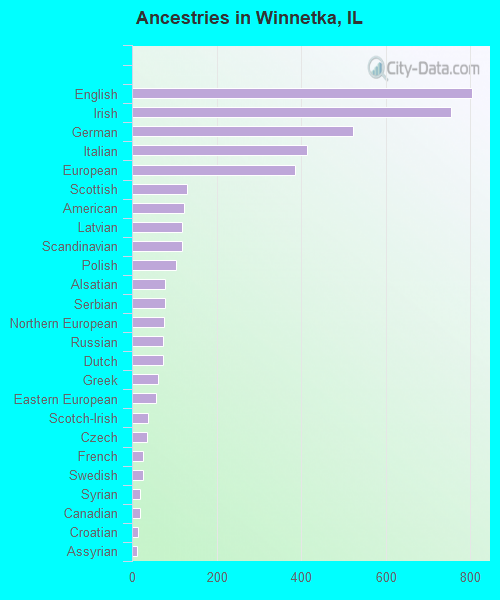
First ancestries reported:
- English: 804 (17.1%)
- Irish: 754 (16.1%)
- German: 523 (11.1%)
- Italian: 413 (8.8%)
- European: 385 (8.2%)
- Scottish: 131 (2.8%)
- American: 122 (2.6%)
- Latvian: 119 (2.5%)
- Scandinavian: 118 (2.5%)
- Polish: 103 (2.2%)
- Alsatian: 78 (1.7%)
- Serbian: 77 (1.6%)
- Northern European: 75 (1.6%)
- Russian: 74 (1.6%)
- Dutch: 73 (1.6%)
- Greek: 62 (1.3%)
- Eastern European: 57 (1.2%)
- Scotch-Irish: 38 (0.8%)
- Czech: 36 (0.8%)
- French: 26 (0.6%)
- Swedish: 26 (0.6%)
- Syrian: 19 (0.4%)
- Canadian: 19 (0.4%)
- Croatian: 14 (0.3%)
- Assyrian: 11 (0.2%)
- Romanian: 10 (0.2%)
- Brazilian: 7 (0.1%)
- Danish: 7 (0.1%)
- Hungarian: 6 (0.1%)
- Lithuanian: 6 (0.1%)
- Welsh: 6 (0.1%)
- British: 4 (0.09%)
Most common places of birth for foreign-born residents (%):
| Winnetka: | 27.8% (255) |
| Illinois: | 0.9% (15,679) |
| Winnetka: | 9.6% (88) |
| Illinois: | 0.5% (9,671) |
| Winnetka: | 7.4% (68) |
| Illinois: | 1.1% (19,306) |
| Winnetka: | 6.5% (60) |
| Illinois: | 0.5% (8,551) |
| Winnetka: | 5.8% (53) |
| Illinois: | 4.1% (74,364) |
| Winnetka: | 5.6% (51) |
| Illinois: | 0.9% (16,308) |
| Winnetka: | 3.4% (31) |
| Illinois: | 9.2% (166,409) |
| Winnetka: | 3.2% (29) |
| Illinois: | 0.9% (16,553) |
| Winnetka: | 2.9% (27) |
| Illinois: | 0.2% (4,177) |
| Winnetka: | 2.8% (26) |
| Illinois: | 0.2% (3,977) |
| Winnetka: | 2.5% (23) |
| Illinois: | 6.9% (124,474) |
| Winnetka: | 2.4% (22) |
| Illinois: | 0.1% (2,017) |
| Winnetka: | 1.6% (15) |
| Illinois: | 0.1% (1,168) |
| Winnetka: | 1.6% (15) |
| Illinois: | 0.3% (5,895) |
Place of birth for U.S.-born residents:
- This state: 6,508
- Other state: 4,725
- Northeast: 1,382
- Midwest: 2,056
- South: 594
- West: 752
90.8% of Winnetka residents lived in the same house 1 years ago.
Out of people who lived in different houses, 43.4% lived in this county.
Out of people who lived in different counties, 5.9% lived in Illinois.
| Winnetka: | 90.8% |
| State average: | 88.3% |
Education attainment for males 25 years and older:
- No schooling: 0
- Nursery to 4th grade: 0
- 5th and 6th grade: 0
- 7th and 8th grade: 0
- 9th grade: 0
- 10th grade: 0
- 11th grade: 0
- 12th grade, no diploma: 60
- High school graduate (or equivalency): 73
- Less than 1 year of college: 9
- Some college more than 1 year, no degree: 150
- Associate degree: 18
- Bachelor's degree: 1,335
- Master's degree: 1,534
- Professional school degree: 618
- Doctorate degree: 174

Education attainment for females 25 years and older:
- No schooling: 0
- Nursery to 4th grade: 0
- 5th and 6th grade: 0
- 7th and 8th grade: 0
- 9th grade: 9
- 10th grade: 0
- 11th grade: 0
- 12th grade, no diploma: 12
- High school graduate (or equivalency): 152
- Less than 1 year of college: 49
- Some college more than 1 year, no degree: 151
- Associate degree: 110
- Bachelor's degree: 1,826
- Master's degree: 1,145
- Professional school degree: 483
- Doctorate degree: 93


Housing units in structures:
- One, detached: 4,062
- One, attached: 144
- Two: 32
- 3 or 4: 89
- 5 to 9: 91
- 10 to 19: 72
- 20 to 49: 173
- 50 or more: 71
- Mobile homes: 11
House/condo owner moved in on average 9 years ago
Renter moved in on average 3 years ago

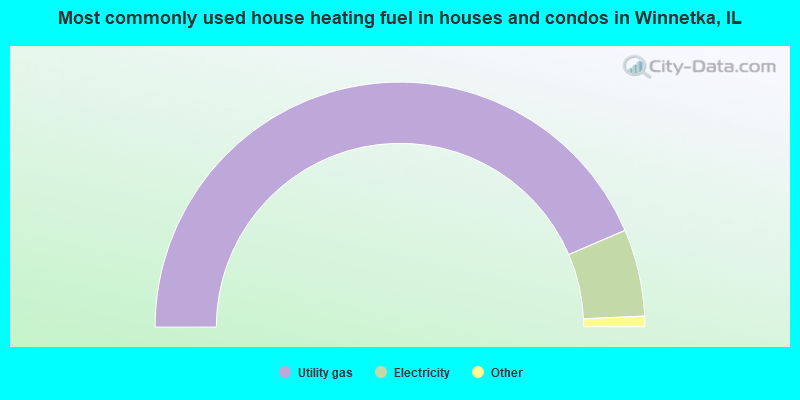
- 87.1%Utility gas
- 11.5%Electricity
- 0.6%Bottled, tank, or LP gas
- 0.4%Other fuel
- 0.2%No fuel used
- 0.1%Fuel oil, kerosene, etc.
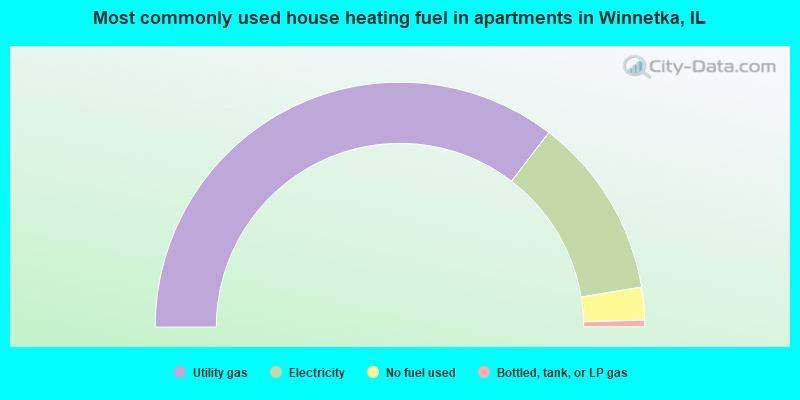
- 70.8%Utility gas
- 24.0%Electricity
- 4.3%No fuel used
- 0.9%Bottled, tank, or LP gas
Private vs. public school enrollment:
| Here: | 17.1% |
| Illinois: | 13.3% |
| Here: | 13.5% |
| Illinois: | 9.9% |
| Here: | 32.8% |
| Illinois: | 27.4% |


