Windsor, CA (California) Houses and Residents
| Windsor: | $744,424 |
| California: | $715,900 |
Total population: 27,414 (Urban population: 22,844, Rural population: 112 (31 farm, 81 nonfarm))
Houses: 9,795 (9,415 occupied: 7,212 owner occupied, 2,311 renter occupied)
| % of renters here: | 24% |
| State: | 44% |
Housing density: 1,453 houses/condos per square mile
Median price asked for vacant for-sale houses and condos in 2022 in this county: $439,673.
Median contract rent in 2022: $1,928 (lower quartile is $1,086, upper quartile is over $2,000)
Median rent asked for vacant for-rent units in 2022: $7,184
Median gross rent in Windsor, CA in 2022: over $2,000
Housing units in Windsor with a mortgage: 4,950 (584 second mortgage, 15 home equity loan, 516 both second mortgage and home equity loan)
Houses without a mortgage: 118
Median household income for houses/condos with a mortgage: $155,352
Median household income for apartments without a mortgage: $79,170
Median monthly housing costs: $2,321
Compare current foreclosures near Windsor, CA:
| Photo | Address | Area | Beds / Baths | Price | Details |
|---|---|---|---|---|---|

|
#1
Kay Dr
Windsor, CA 95492
|
616 sq. feet
|
1 baths 1 beds |
show details | |

|
#2
Windsor Palms Dr
Windsor, CA 95492
|
1,337 sq. feet
|
2 baths 3 beds |
show details | |

|
#3
3rd St
Windsor, CA 95492
|
1,471 sq. feet
|
2 baths 3 beds |
show details | |

|
#4
Starr View Dr
Windsor, CA 95492
|
1,212 sq. feet
|
2 baths 4 beds |
show details | |

|
#5
Old Redwood Hwy
Windsor, CA 95492
|
672 sq. feet
|
1 baths 2 beds |
show details | |

|
#6
Jessica Dr
Windsor, CA 95492
|
1,882 sq. feet
|
2 baths 3 beds |
show details | |

|
#7
Decanter Cir
Windsor, CA 95492
|
2,855 sq. feet
|
2 baths 4 beds |
show details | |

|
#8
Mark West Station Rd
Windsor, CA 95492
|
852 sq. feet
|
1 baths 2 beds |
show details | |

|
#9
Ventana Dr
Windsor, CA 95492
|
2,018 sq. feet
|
3 baths 4 beds |
show details | |

|
#10
Wilcox Rd
Windsor, CA 95492
|
- sq. feet
|
1 baths 2 beds |
show details |
| Photo | Address | Area | Beds / Baths | Price | Details |
|---|---|---|---|---|---|

|
#11
Robbie Way
Windsor, CA 95492
|
948 sq. feet
|
1 baths 2 beds |
show details | |

|
#12
Pollard Way
Windsor, CA 95492
|
1,438 sq. feet
|
2 baths 3 beds |
show details | |

|
#13
Pollard Way
Windsor, CA 95492
|
1,235 sq. feet
|
2 baths 3 beds |
show details | |

|
#14
Robbie Way
Windsor, CA 95492
|
948 sq. feet
|
1 baths 2 beds |
show details | |

|
#15
Wooded Glen Ct
Windsor, CA 95492
|
1,633 sq. feet
|
3 baths 4 beds |
show details | |

|
#16
Equity Ct
Windsor, CA 95492
|
2,342 sq. feet
|
3 baths 4 beds |
show details | |

|
#17
Starr Rd
Windsor, CA 95492
|
3,026 sq. feet
|
2 baths 3 beds |
show details | |

|
#18
Lord Dr
Windsor, CA 95492
|
1,619 sq. feet
|
3 baths 3 beds |
show details | |

|
#19
Billington Ln
Windsor, CA 95492
|
1,467 sq. feet
|
2 baths 3 beds |
show details | |

|
#20
Leno Dr
Windsor, CA 95492
|
- sq. feet
|
- baths - beds |
show details |
| Photo | Address | Area | Beds / Baths | Price | Details |
|---|---|---|---|---|---|

|
#21
Windsor River Rd # 337
Windsor, CA 95492
|
- sq. feet
|
- baths - beds |
show details | |

|
#22
Hidden Valley Rd
Guerneville, CA 95446
|
284 sq. feet
|
1 baths 1 beds |
$199,900
|
show details |

|
#23
Anna Dr
Windsor, CA 95492
|
- sq. feet
|
- baths - beds |
show details | |

|
#24
Decanter Cir
Windsor, CA 95492
|
- sq. feet
|
- baths - beds |
show details | |

|
#25
Emily Rose Cir
Windsor, CA 95492
|
- sq. feet
|
- baths - beds |
show details | |

|
#26
Mcconnell Ave
Santa Rosa, CA 95404
|
1,216 sq. feet
|
2 baths 4 beds |
show details | |

|
#27
Westberry Dr
Santa Rosa, CA 95403
|
994 sq. feet
|
1 baths 2 beds |
show details | |

|
#28
Cazadero Hwy
Cazadero, CA 95421
|
675 sq. feet
|
1 baths 2 beds |
show details | |

|
#29
Poplar St
Santa Rosa, CA 95407
|
945 sq. feet
|
1 baths 2 beds |
show details | |

|
#30
California Ave
Santa Rosa, CA 95405
|
1,704 sq. feet
|
2 baths 4 beds |
show details |
| Photo | Address | Area | Beds / Baths | Price | Details |
|---|---|---|---|---|---|

|
#31
Corby Ave
Santa Rosa, CA 95407
|
836 sq. feet
|
1 baths 2 beds |
show details | |

|
#32
Cazadero Hwy
Cazadero, CA 95421
|
672 sq. feet
|
1 baths 2 beds |
show details | |

|
#33
Eastern Ave
Guerneville, CA 95446
|
1,206 sq. feet
|
1 baths 2 beds |
show details | |

|
#34
Trombetta St
Santa Rosa, CA 95407
|
1,616 sq. feet
|
2 baths 3 beds |
show details | |

|
#35
Canyon 2 Rd
Rio Nido, CA 95471
|
1,088 sq. feet
|
1 baths 2 beds |
show details | |

|
#36
Marilyn Ct
Santa Rosa, CA 95407
|
1,108 sq. feet
|
2 baths 3 beds |
show details | |

|
#37
Sebastopol Ave
Santa Rosa, CA 95407
|
880 sq. feet
|
1 baths 2 beds |
show details | |

|
#38
Duer Rd
Sebastopol, CA 95472
|
2,040 sq. feet
|
2 baths 3 beds |
show details | |

|
#39
Sunrise Pl
Santa Rosa, CA 95409
|
1,813 sq. feet
|
2 baths 3 beds |
show details | |

|
#40
Alderbrook Dr
Santa Rosa, CA 95405
|
1,227 sq. feet
|
1 baths 2 beds |
show details |
| Photo | Address | Area | Beds / Baths | Price | Details |
|---|---|---|---|---|---|

|
#41
Westmont Pl
Santa Rosa, CA 95401
|
984 sq. feet
|
2 baths 2 beds |
show details | |

|
#42
Lockwood Cir
Santa Rosa, CA 95409
|
1,764 sq. feet
|
2 baths 3 beds |
show details | |

|
#43
Aussie Ave
Santa Rosa, CA 95407
|
2,052 sq. feet
|
3 baths 4 beds |
show details | |

|
#44
Ezra Ave
Santa Rosa, CA 95401
|
1,262 sq. feet
|
2 baths 3 beds |
show details | |

|
#45
Westgate Cir
Santa Rosa, CA 95401
|
960 sq. feet
|
2 baths 2 beds |
show details | |

|
#46
Orchard St
Santa Rosa, CA 95404
|
884 sq. feet
|
1 baths 2 beds |
show details | |

|
#47
Mill Station Rd
Sebastopol, CA 95472
|
2,992 sq. feet
|
2 baths 4 beds |
show details | |

|
#48
Locust Ave
Cotati, CA 94931
|
1,056 sq. feet
|
1 baths 3 beds |
show details | |

|
#49
Oxford Pl
Rohnert Park, CA 94928
|
1,869 sq. feet
|
3 baths 4 beds |
show details | |

|
Check over 1 million property listings on Foreclosure.com!
|
browse all offers | |||

Latest news about housing in Windsor, CA collected exclusively by city-data.com from local newspapers, TV, and radio stations


Median year apartment built: 1995
Household type by relationship:
Households: 26,008- Male householders: 4,421 (597 living alone), Female householders: 4,747 (1,190 living alone)
5,301 spouses (5,217 opposite-sex spouses), 570 unmarried partners, (541 opposite-sex unmarried partners), 8,406 children (7,994 natural, 145 adopted, 266 stepchildren), 465 grandchildren, 220 brothers or sisters, 277 parents, 5 foster children, 458 other relatives, 1,013 non-relatives
- In group quarters: 120
Size of family households: 2,622 2-persons, 1,962 3-persons, 1,464 4-persons, 525 5-persons, 207 6-persons, 120 7-or-more-persons.
Size of nonfamily households: 1,968 1-person, 445 2-persons, 54 3-persons, 15 4-persons, 10 5-persons.
3,870 married couples with children.
1,520 single-parent households (854 men, 666 women).
72.5% of residents of Windsor speak English at home.
25.3% of residents speak Spanish at home (60% speak English very well, 21% speak English well, 10% speak English not well, 9% don't speak English at all).
1.4% of residents speak other Indo-European language at home (80% speak English very well, 20% speak English well).
1.1% of residents speak Asian or Pacific Island language at home (45% speak English very well, 26% speak English well, 16% speak English not well, 13% don't speak English at all).
0.5% of residents speak other language at home (92% speak English very well, 8% speak English well).
Foreign born population: 3,425 (13.2%)
(58.3% of them are naturalized citizens)
| Here: | 6.0 |
| State: | 6.0 |
| Here: | 4.7 |
| State: | 3.9 |

- Bedrooms in owner-occupied houses and condos in Windsor, California
- 42no bedroom
- 131 bedroom
- 7482 bedrooms
- 3,6373 bedrooms
- 2,5734 bedrooms
- 1995+ bedrooms
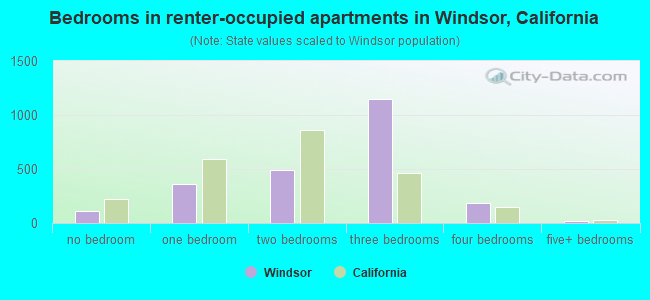
- Bedrooms in renter-occupied apartments in Windsor, California
- 113no bedroom
- 3571 bedroom
- 4872 bedrooms
- 1,1503 bedrooms
- 1864 bedrooms
- 205+ bedrooms

- Cars and other vehicles available in Windsor in owner-occupied houses/condos
- 142no vehicle
- 1,3341 vehicle
- 2,9662 vehicles
- 1,4663 vehicles
- 9384 vehicles
- 3685+ vehicles

- Cars and other vehicles available in Windsor in renter-occupied apartments
- 161no vehicle
- 7711 vehicle
- 7782 vehicles
- 4023 vehicles
- 1654 vehicles
- 345+ vehicles

- Rooms in owner-occupied houses in Windsor, California
- 421 room
- 02 rooms
- 853 rooms
- 6134 rooms
- 1,4945 rooms
- 1,9196 rooms
- 1,5197 rooms
- 7458 rooms
- 7969+ rooms

- Rooms in renter-occupied apartments in Windsor, California
- 1131 room
- 2012 rooms
- 2053 rooms
- 4374 rooms
- 5915 rooms
- 2866 rooms
- 2477 rooms
- 1578 rooms
- 739+ rooms


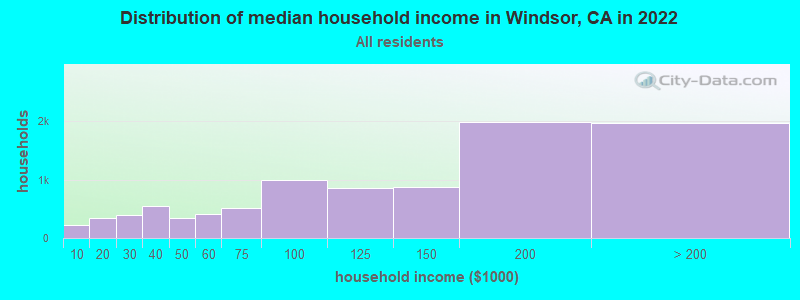
Windsor, CA household income distribution

- 218Less than $10,000
- 339$10,000 to $19,999
- 389$20,000 to $29,999
- 557$30,000 to $39,999
- 340$40,000 to $49,999
- 412$50,000 to $59,999
- 511$60,000 to $74,999
- 989$75,000 to $99,999
- 856$100,000 to $124,999
- 872$125,000 to $149,999
- 1,991$150,000 to $199,999
- 1,970$200,000 or more
Home value of owner - occupied houses in 2022 in Windsor, CA
-
- 66Less than $10,000
- 12$35,000 to $39,999
- 46$50,000 to $59,999
- 27$60,000 to $69,999
- 35$70,000 to $79,999
- 88$80,000 to $89,999
- 9$90,000 to $99,999
- 59$100,000 to $124,999
- 10$125,000 to $149,999
- 85$150,000 to $174,999
- 22$175,000 to $199,999
- 126$200,000 to $249,999
- 43$250,000 to $299,999
- 79$300,000 to $399,999
- 212$400,000 to $499,999
- 2,878$500,000 to $749,999
- 2,627$750,000 to $999,999
- 580$1,000,000 to $1,499,999
- 45$1,500,000 to $1,999,999
- 96$2,000,000 or more

Rent paid by renters in 2022 in Windsor, CA
-
- 27$150 to $199
- 13$200 to $249
- 13$250 to $299
- 10$300 to $349
- 50$350 to $399
- 15$400 to $449
- 29$450 to $499
- 35$500 to $549
- 82$600 to $649
- 7$650 to $699
- 48$700 to $749
- 30$750 to $799
- 73$800 to $899
- 25$900 to $999
- 321$1,000 to $1,249
- 153$1,250 to $1,499
- 296$1,500 to $1,999
- 289$2,000 to $2,499
- 433$2,500 to $2,999
- 181$3,000 to $3,499
- 148$3,500 or more
- 68No cash rent


Percentage of workers working in this county: 91.4%
Number of people working at home: 1,264 (9.3% of all workers)
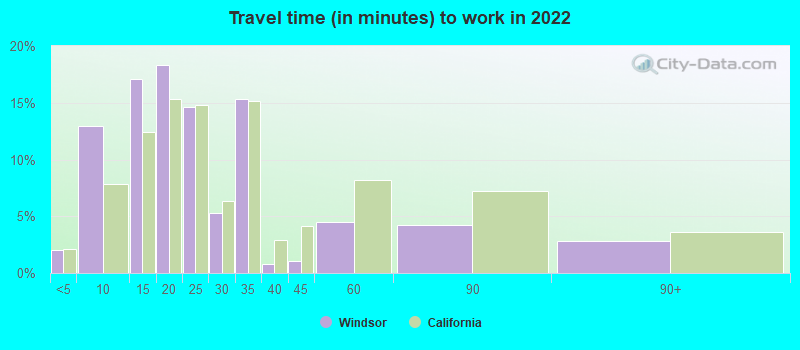
Travel time to work (commute)
- Less than 5 minutes: 325
- 5 to 9 minutes: 1,570
- 10 to 14 minutes: 1,951
- 15 to 19 minutes: 2,585
- 20 to 24 minutes: 1,974
- 25 to 29 minutes: 664
- 30 to 34 minutes: 1,219
- 35 to 39 minutes: 242
- 40 to 44 minutes: 180
- 45 to 59 minutes: 511
- 60 to 89 minutes: 602
- 90 or more minutes: 307
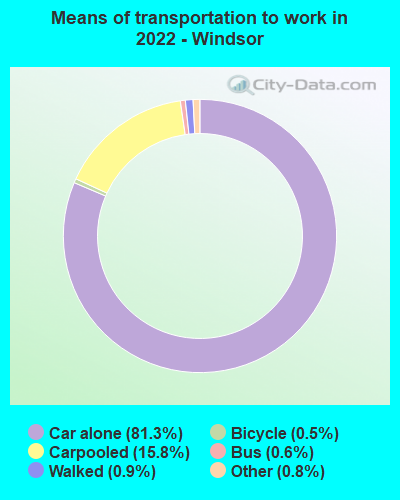
Means of transportation to work:
- Drove a car alone: 5,584 (69.7%)
- Carpooled: 900 (11.2%)
- Bus: 33 (0.4%)
- Taxi: 46 (0.6%)
- Bicycle: 43 (0.5%)
- Walked: 71 (0.9%)
- Worked at home: 1,264 (15.8%)

- Unemployment by race in 2022
- Unemployment rate for White non-Hispanic residents
- 2.3%Males
- 1.0%Females
- Unemployment rate for American Indian and Alaska Native residents
- 9.6%Males
- Unemployment rate for Asian residents
- 2.7%Females
- Unemployment rate for other race residents
- 0.8%Males
- 11.2%Females
- Unemployment rate for two or more race residents
- 3.1%Females
- Unemployment rate for Hispanic or Latino residents
- 2.7%Males
- 4.6%Females

- Year of entry for the foreign-born population in Windsor, California
- 2422010 or later
- 7012000 to 2009
- 9231990 to 1999
- 7951980 to 1989
- 5311970 to 1979
- 675Before 1970

First ancestries reported:
- American: 934 (7.7%)
- European: 761 (6.3%)
- Irish: 703 (5.8%)
- Italian: 644 (5.3%)
- English: 569 (4.7%)
- German: 518 (4.3%)
- Scottish: 222 (1.8%)
- Norwegian: 178 (1.5%)
- Polish: 130 (1.1%)
- Scandinavian: 82 (0.7%)
- Swiss: 76 (0.6%)
- Jordanian: 69 (0.6%)
- Northern European: 64 (0.5%)
- Canadian: 59 (0.5%)
- Basque: 58 (0.5%)
- Portuguese: 55 (0.5%)
- Scotch-Irish: 50 (0.4%)
- Swedish: 50 (0.4%)
- British: 43 (0.4%)
- Russian: 40 (0.3%)
- Welsh: 36 (0.3%)
- Palestinian: 33 (0.3%)
- Dutch: 31 (0.3%)
- French: 28 (0.2%)
- Haitian: 27 (0.2%)
- Greek: 26 (0.2%)
- Celtic: 22 (0.2%)
- Croatian: 17 (0.1%)
- Finnish: 14 (0.1%)
- French Canadian: 13 (0.1%)
- Danish: 13 (0.1%)
- Eastern European: 11 (0.09%)
- Moroccan: 10 (0.08%)
- Ukrainian: 10 (0.08%)
- Maltese: 9 (0.07%)
- Lithuanian: 5 (0.04%)
Most common places of birth for foreign-born residents (%):
| Windsor: | 64.5% (2,218) |
| California: | 37.2% (3,881,193) |
| Windsor: | 4.4% (153) |
| California: | 5.2% (539,184) |
| Windsor: | 3.6% (124) |
| California: | 7.8% (818,297) |
| Windsor: | 2.4% (83) |
| California: | 1.2% (127,477) |
| Windsor: | 2.4% (83) |
| California: | 0.6% (60,582) |
| Windsor: | 1.8% (62) |
| California: | 4.2% (440,287) |
| Windsor: | 1.8% (61) |
| California: | 0.3% (33,937) |
| Windsor: | 1.6% (55) |
| California: | 0.0% (3,677) |
| Windsor: | 1.5% (53) |
| California: | 4.9% (512,335) |
Place of birth for U.S.-born residents:
- This state: 17,559
- Other state: 4,543
- Northeast: 824
- Midwest: 1,563
- South: 1,210
- West: 944
92.0% of Windsor residents lived in the same house 1 years ago.
Out of people who lived in different houses, 42.4% lived in this county.
Out of people who lived in different counties, 49.6% lived in California.
| Windsor: | 92.0% |
| State average: | 88.9% |
Education attainment for males 25 years and older:
- No schooling: 196
- Nursery to 4th grade: 168
- 5th and 6th grade: 275
- 7th and 8th grade: 57
- 9th grade: 55
- 10th grade: 66
- 11th grade: 23
- 12th grade, no diploma: 382
- High school graduate (or equivalency): 1,866
- Less than 1 year of college: 560
- Some college more than 1 year, no degree: 1,687
- Associate degree: 528
- Bachelor's degree: 1,612
- Master's degree: 666
- Professional school degree: 293
- Doctorate degree: 152

Education attainment for females 25 years and older:
- No schooling: 141
- Nursery to 4th grade: 167
- 5th and 6th grade: 160
- 7th and 8th grade: 0
- 9th grade: 90
- 10th grade: 123
- 11th grade: 85
- 12th grade, no diploma: 95
- High school graduate (or equivalency): 1,468
- Less than 1 year of college: 856
- Some college more than 1 year, no degree: 1,679
- Associate degree: 1,072
- Bachelor's degree: 2,547
- Master's degree: 790
- Professional school degree: 160
- Doctorate degree: 83


Housing units in structures:
- One, detached: 7,565
- One, attached: 541
- Two: 219
- 3 or 4: 159
- 5 to 9: 203
- 10 to 19: 159
- 20 to 49: 224
- 50 or more: 217
- Mobile homes: 504
Median worth of mobile homes: $195,528
Housing units lacking complete kitchen facilities in 2022: 1.2%
House/condo owner moved in on average 13 years ago
Renter moved in on average 5 years ago

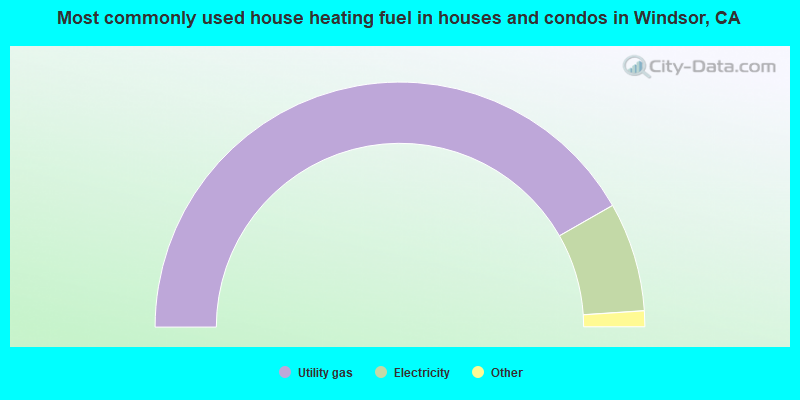
- 83.4%Utility gas
- 14.4%Electricity
- 1.0%Bottled, tank, or LP gas
- 0.6%Wood
- 0.4%Other fuel
- 0.2%No fuel used
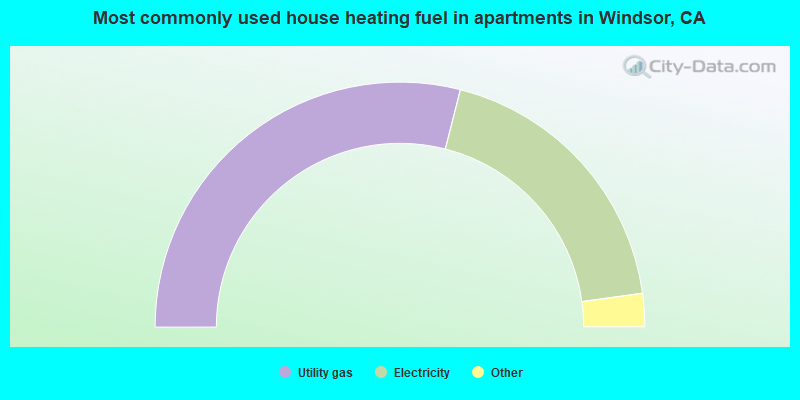
- 58.0%Utility gas
- 37.7%Electricity
- 3.9%No fuel used
- 0.4%Solar energy
Private vs. public school enrollment:
| Here: | 7.0% |
| California: | 10.5% |
| Here: | 3.0% |
| California: | 8.5% |
| Here: | 16.8% |
| California: | 15.9% |


