Housing density: 1,309 houses/condos per square mile
Median price asked for vacant for-sale houses and condos in 2022 in this county: $195,117.
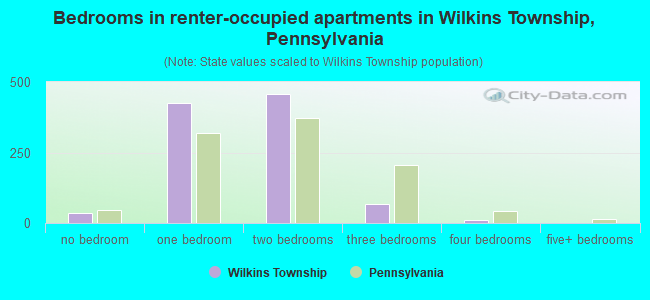
Median contract rent in 2022: $1,109 (lower quartile is $916, upper quartile is $1,377)
Median rent asked for vacant for-rent units in 2022: $1,234
Median gross rent in Wilkins Township, PA in 2022: $1,264
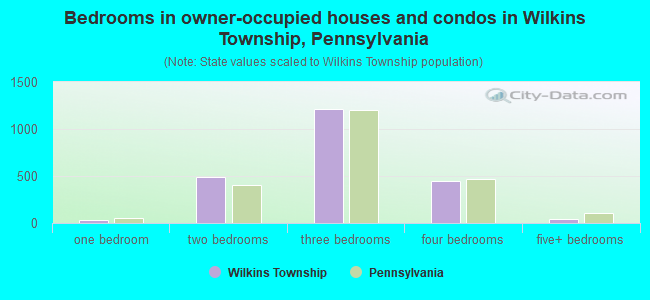
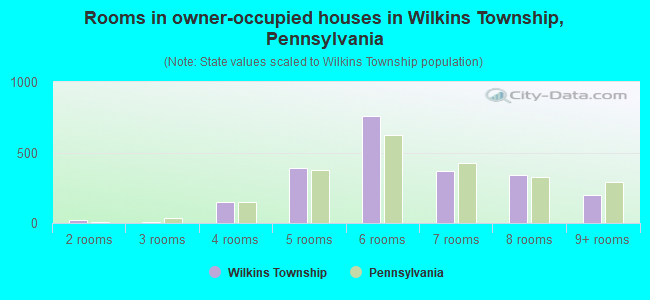
Housing units in Wilkins Township with a mortgage: 1,131 (109 second mortgage, 201 home equity loan, 0 both second mortgage and home equity loan) Houses without a mortgage: 1,018
Compare current foreclosures near Wilkins Township, PA:
In family households: 913,516 (208,635 male householders, 99,374 female householders)
222,332 spouses, 315,393 children (298,168 natural, 7,619 adopted, 9,606 stepchildren), 18,457 grandchildren, 9,985 brothers or sisters, 8,652 parents, foster children, 7,846 other relatives, 18,452 non-relatives
In nonfamily households: 274,778 (100,758 male householders (79,382 living alone)), 125,193 female householders (107,576 living alone)), 48,827 nonrelatives
In group quarters: 35,054 (13,287 institutionalized population)
186,963 married couples with children.
71,829 single-parent households (11,403 men, 60,426 women).
92.7% of residents of Wilkins Township speak English at home.
1.1% of residents speak Spanish at home (50% speak English very well, 11% speak English well, 39% speak English not well).
4.9% of residents speak other Indo-European language at home (71% speak English very well, 15% speak English well, 14% speak English not well).
1.0% of residents speak Asian or Pacific Island language at home (84% speak English very well, 16% speak English well).
0.2% of residents speak other language at home (100% speak English very well).
Foreign born population: 464 (7.0%)
(80.2% of them are naturalized citizens)
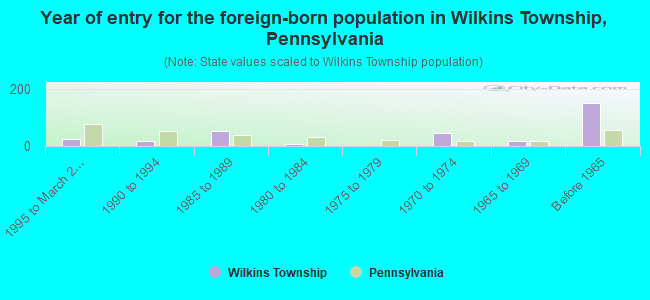
Year of entry for the foreign-born population in Wilkins Township, Pennsylvania
241995 to March 2000
191990 to 1994
511985 to 1989
71980 to 1984
01975 to 1979
461970 to 1974
171965 to 1969
150Before 1965
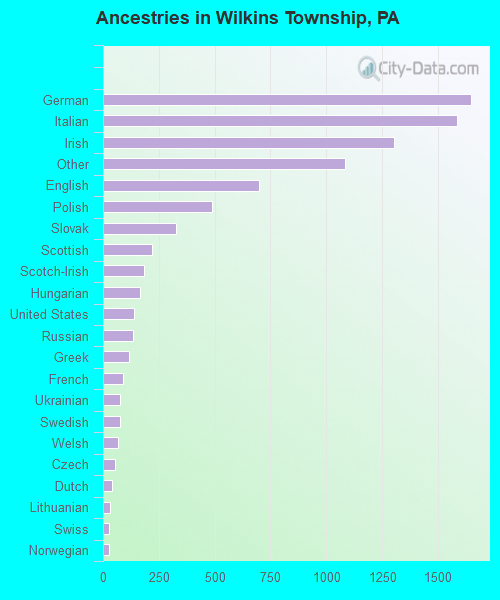
First ancestries reported:
German: 1,647 (19.1%)
Italian: 1,584 (18.4%)
Irish: 1,302 (15.1%)
Other: 1,085 (12.6%)
English: 699 (8.1%)
Polish: 490 (5.7%)
Slovak: 328 (3.8%)
Scottish: 219 (2.5%)
Scotch-Irish: 183 (2.1%)
Hungarian: 167 (1.9%)
United States: 138 (1.6%)
Russian: 136 (1.6%)
Greek: 115 (1.3%)
French: 89 (1.0%)
Ukrainian: 77 (0.9%)
Swedish: 74 (0.9%)
Welsh: 67 (0.8%)
Czech: 55 (0.6%)
Dutch: 41 (0.5%)
Lithuanian: 30 (0.3%)
Swiss: 28 (0.3%)
Norwegian: 25 (0.3%)
French Canadian: 12 (0.1%)
Danish: 7 (0.08%)
Arab: 6 (0.07%)
Most common places of birth for foreign-born residents (%):
Italy
Wilkins Township:
16.9% (53)
Pennsylvania:
6.0% (30,559)
Germany
Wilkins Township:
13.7% (43)
Pennsylvania:
5.1% (25,685)
China, excluding Hong Kong and Taiwan
Wilkins Township:
11.1% (35)
Pennsylvania:
4.6% (23,478)
United Kingdom
Wilkins Township:
8.3% (26)
Pennsylvania:
4.6% (23,171)
India
Wilkins Township:
7.6% (24)
Pennsylvania:
7.4% (37,541)
Greece
Wilkins Township:
5.7% (18)
Pennsylvania:
1.4% (7,362)
Iran
Wilkins Township:
4.5% (14)
Pennsylvania:
0.6% (3,034)
Brazil
Wilkins Township:
4.5% (14)
Pennsylvania:
0.6% (3,264)
Argentina
Wilkins Township:
3.8% (12)
Pennsylvania:
0.5% (2,409)
Canada
Wilkins Township:
3.5% (11)
Pennsylvania:
3.0% (15,200)
Korea
Wilkins Township:
3.2% (10)
Pennsylvania:
5.3% (26,703)
Philippines
Wilkins Township:
3.2% (10)
Pennsylvania:
2.2% (11,411)
Cuba
Wilkins Township:
2.5% (8)
Pennsylvania:
0.8% (3,914)
Turkey
Wilkins Township:
2.2% (7)
Pennsylvania:
0.4% (2,237)
Other Caribbean
Wilkins Township:
2.2% (7)
Pennsylvania:
0.5% (2,472)
Ireland
Wilkins Township:
1.9% (6)
Pennsylvania:
1.3% (6,687)
Austria
Wilkins Township:
1.9% (6)
Pennsylvania:
0.5% (2,714)
Ukraine
Wilkins Township:
1.6% (5)
Pennsylvania:
3.3% (16,897)
Bosnia and Herzegovina
Wilkins Township:
1.6% (5)
Pennsylvania:
0.6% (2,880)
Place of birth for U.S.-born residents:
This state: 5,788
Other state: 810
Northeast: 215
Midwest: 265
South: 271
West: 59
73% of Wilkins Township residents lived in the same house 5 years ago. Out of people who lived in different houses, 79% lived in this county. Out of people who lived in different counties, 55% lived in Pennsylvania.
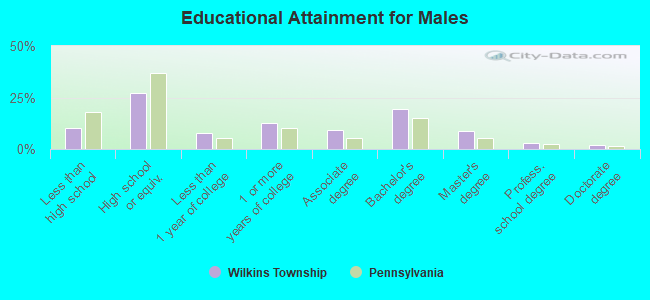
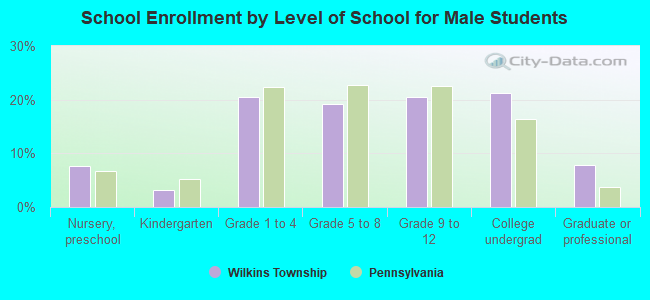
Education attainment for males 25 years and older:
No schooling: 10
Nursery to 4th grade: 10
5th and 6th grade: 6
7th and 8th grade: 34
9th grade: 5
10th grade: 90
11th grade: 31
12th grade, no diploma: 68
High school graduate (or equivalency): 670
Less than 1 year of college: 189
Some college more than 1 year, no degree: 315
Associate degree: 224
Bachelor's degree: 474
Master's degree: 215
Professional school degree: 77
Doctorate degree: 46
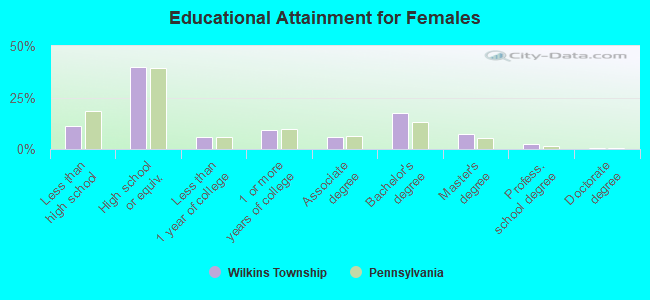
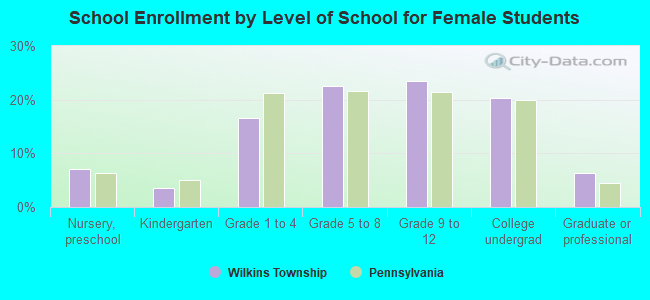
Education attainment for females 25 years and older:
No schooling: 0
Nursery to 4th grade: 0
5th and 6th grade: 17
7th and 8th grade: 46
9th grade: 25
10th grade: 88
11th grade: 64
12th grade, no diploma: 81
High school graduate (or equivalency): 1,145
Less than 1 year of college: 170
Some college more than 1 year, no degree: 258
Associate degree: 174
Bachelor's degree: 502
Master's degree: 213
Professional school degree: 76
Doctorate degree: 12
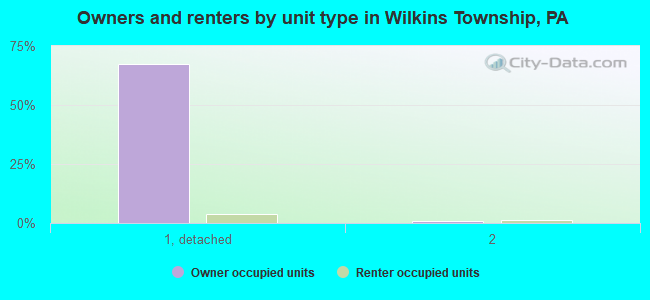
Housing units in structures:
One, detached: 2,390
One, attached: 82
Two: 82
3 or 4: 46
5 to 9: 82
10 to 19: 114
20 to 49: 151
50 or more: 485
Housing units lacking complete plumbing facilities: 0.6%
Housing units lacking complete kitchen facilities: 0.3%