Wheaton, IL (Illinois) Houses and Residents
| Wheaton: | $434,410 |
| Illinois: | $251,600 |
Total population: 53,644 (All urban)
Houses: 21,134 (20,016 occupied: 14,556 owner occupied, 5,481 renter occupied)
| % of renters here: | 27% |
| State: | 33% |
Housing density: 1,883 houses/condos per square mile
Median price asked for vacant for-sale houses and condos in 2022: $377,180.
Median contract rent in 2022: $1,505 (lower quartile is $1,161, upper quartile is $1,940)
Median rent asked for vacant for-rent units in 2022: $2,196
Median gross rent in Wheaton, IL in 2022: $1,606
Housing units in Wheaton with a mortgage: 9,715 (1,021 second mortgage, 17 home equity loan, 938 both second mortgage and home equity loan)
Houses without a mortgage: 429
Median household income for houses/condos with a mortgage: $151,198
Median household income for apartments without a mortgage: $104,025
Median monthly housing costs: $1,776
Compare current foreclosures in Wheaton, IL:
| Photo | Address | Area | Beds / Baths | Price | Details |
|---|---|---|---|---|---|

|
#1
Darwin Ln
Wheaton, IL 60189
|
2,059 sq. feet
|
3 baths 5 beds |
show details | |

|
#2
Fischer St
Wheaton, IL 60189
|
1,570 sq. feet
|
1 baths - beds |
show details | |

|
#3
Orth Dr
Wheaton, IL 60189
|
2,351 sq. feet
|
2 baths - beds |
show details | |

|
#4
Chatham Dr
Wheaton, IL 60189
|
2,427 sq. feet
|
2 baths - beds |
show details | |

|
#5
Hertford Ct
Wheaton, IL 60189
|
1,466 sq. feet
|
1 baths - beds |
show details | |

|
#6
Wigtown Ct
Wheaton, IL 60189
|
1,160 sq. feet
|
1 baths - beds |
show details | |

|
#7
Valley Forge Ct
Wheaton, IL 60189
|
968 sq. feet
|
1 baths - beds |
show details | |

|
#8
S Chase St
Wheaton, IL 60189
|
925 sq. feet
|
1 baths - beds |
show details | |

|
#9
E Evergreen St
Wheaton, IL 60187
|
1,144 sq. feet
|
1 baths - beds |
show details | |

|
#10
Lakecliffe Dr
Wheaton, IL 60189
|
1,311 sq. feet
|
2 baths - beds |
show details |
| Photo | Address | Area | Beds / Baths | Price | Details |
|---|---|---|---|---|---|

|
#11
Appleby Dr
Wheaton, IL 60189
|
2,444 sq. feet
|
2 baths - beds |
show details | |

|
#12
S West St
Wheaton, IL 60187
|
1,524 sq. feet
|
1 baths - beds |
show details | |

|
#13
Stonebridge Cir
Wheaton, IL 60189
|
994 sq. feet
|
1 baths - beds |
show details | |

|
#14
Kilkenny Dr
Wheaton, IL 60189
|
1,466 sq. feet
|
2 baths - beds |
show details | |

|
#15
Bridle Ln
Wheaton, IL 60187
|
1,175 sq. feet
|
1 baths - beds |
show details | |

|
#16
E Liberty Dr
Wheaton, IL 60187
|
1,043 sq. feet
|
1 baths - beds |
show details | |

|
#17
Pierce Ave
Wheaton, IL 60187
|
1,231 sq. feet
|
1 baths - beds |
show details | |

|
#18
Kensington Cir Apt 306
Wheaton, IL 60189
|
- sq. feet
|
- baths - beds |
show details | |

|
#19
S Lorraine Rd Apt 218
Wheaton, IL 60189
|
- sq. feet
|
- baths - beds |
show details | |

|
#20
S Lorraine Rd Apt 2c
Wheaton, IL 60189
|
- sq. feet
|
- baths - beds |
show details |
| Photo | Address | Area | Beds / Baths | Price | Details |
|---|---|---|---|---|---|

|
#21
E Harrison Ave
Wheaton, IL 60187
|
- sq. feet
|
- baths - beds |
show details | |

|
#22
College Ln S
Wheaton, IL 60189
|
- sq. feet
|
- baths - beds |
show details | |

|
#23
Wheaton Ctr Apt 1405
Wheaton, IL 60187
|
- sq. feet
|
- baths - beds |
show details | |

|
#24
Taft Ave
Wheaton, IL 60189
|
2,848 sq. feet
|
- baths - beds |
show details | |

|
#25
Wheaton Ctr Apt 216
Wheaton, IL 60187
|
- sq. feet
|
- baths - beds |
show details | |

|
#26
Sterling Cir Apt 208
Wheaton, IL 60189
|
- sq. feet
|
- baths - beds |
show details | |

|
#27
Wilson Ave
Wheaton, IL 60189
|
999 sq. feet
|
- baths - beds |
show details | |

|
#28
Knollwood Dr
Wheaton, IL 60187
|
- sq. feet
|
- baths - beds |
show details | |

|
#29
Thomas Rd
Wheaton, IL 60187
|
- sq. feet
|
- baths - beds |
show details | |

|
#30
N Cross St Unit 521
Wheaton, IL 60187
|
- sq. feet
|
- baths - beds |
show details |
| Photo | Address | Area | Beds / Baths | Price | Details |
|---|---|---|---|---|---|

|
#31
Briarbrook Dr Apt 309
Wheaton, IL 60189
|
- sq. feet
|
- baths - beds |
show details | |

|
#32
E Roosevelt Rd Apt 6
Wheaton, IL 60187
|
- sq. feet
|
- baths - beds |
show details | |

|
#33
Wheaton Ctr Apt 307
Wheaton, IL 60187
|
- sq. feet
|
- baths - beds |
show details | |

|
#34
Geneva Rd
Wheaton, IL 60187
|
- sq. feet
|
- baths - beds |
show details | |

|
#35
Butterfield Rd
Wheaton, IL 60189
|
- sq. feet
|
- baths - beds |
show details | |

|
#36
Butterfield Rd
Wheaton, IL 60189
|
- sq. feet
|
- baths - beds |
show details | |

|
#37
S Erie St
Wheaton, IL 60187
|
- sq. feet
|
- baths - beds |
show details | |

|
#38
Kensington Cir Apt 107
Wheaton, IL 60189
|
- sq. feet
|
- baths - beds |
show details | |

|
#39
Handel Ct
Wheaton, IL 60189
|
- sq. feet
|
- baths - beds |
show details | |

|
#40
Evans Ave
Wheaton, IL 60187
|
- sq. feet
|
- baths - beds |
show details |
| Photo | Address | Area | Beds / Baths | Price | Details |
|---|---|---|---|---|---|

|
#41
N 126 Evans Ave
Wheaton, IL 60187
|
- sq. feet
|
- baths - beds |
show details | |

|
#42
Apache Dr
Wheaton, IL 60189
|
- sq. feet
|
- baths - beds |
show details | |

|
#43
S Lorraine Rd
Wheaton, IL 60189
|
- sq. feet
|
- baths - beds |
show details | |

|
#44
W Park Circle Dr
Wheaton, IL 60187
|
- sq. feet
|
- baths - beds |
show details | |

|
#45
Wheaton Ctr Apt 207
Wheaton, IL 60187
|
- sq. feet
|
- baths - beds |
show details | |

|
#46
E Geneva Rd
Wheaton, IL 60187
|
3,177 sq. feet
|
- baths - beds |
show details | |

|
#47
W Roosevelt Rd Apt 304
Wheaton, IL 60187
|
- sq. feet
|
- baths - beds |
show details | |

|
#48
Nepil Ave
Wheaton, IL 60187
|
- sq. feet
|
- baths - beds |
show details | |

|
#49
Timber Trl
Wheaton, IL 60189
|
- sq. feet
|
- baths - beds |
show details | |

|
Check over 1 million property listings on Foreclosure.com!
|
browse all offers | |||

Latest news about housing in Wheaton, IL collected exclusively by city-data.com from local newspapers, TV, and radio stations


Median year apartment built: 1978
Household type by relationship:
Households: 53,115- Male householders: 10,325 (1,968 living alone), Female householders: 9,382 (3,681 living alone)
11,340 spouses (11,245 opposite-sex spouses), 1,056 unmarried partners, (1,046 opposite-sex unmarried partners), 15,781 children (14,967 natural, 500 adopted, 313 stepchildren), 206 grandchildren, 216 brothers or sisters, 567 parents, 19 foster children, 212 other relatives, 873 non-relatives
- In group quarters: 3,132
Size of family households: 5,838 2-persons, 2,716 3-persons, 2,558 4-persons, 1,430 5-persons, 255 6-persons, 222 7-or-more-persons.
Size of nonfamily households: 5,855 1-person, 1,066 2-persons, 38 3-persons, 65 4-persons, 16 5-persons.
10,385 married couples with children.
976 single-parent households (152 men, 824 women).
85.7% of residents of Wheaton speak English at home.
4.6% of residents speak Spanish at home (78% speak English very well, 11% speak English well, 9% speak English not well, 1% don't speak English at all).
4.6% of residents speak other Indo-European language at home (69% speak English very well, 17% speak English well, 14% speak English not well, 1% don't speak English at all).
3.6% of residents speak Asian or Pacific Island language at home (49% speak English very well, 34% speak English well, 16% speak English not well, 1% don't speak English at all).
1.3% of residents speak other language at home (77% speak English very well, 18% speak English well, 4% speak English not well).
Foreign born population: 5,943 (11.2%)
(61.6% of them are naturalized citizens)
| Here: | 7.6 |
| State: | 6.4 |
| Here: | 3.6 |
| State: | 4.1 |

- Bedrooms in owner-occupied houses and condos in Wheaton, Illinois
- 15no bedroom
- 1521 bedroom
- 2,0992 bedrooms
- 5,0883 bedrooms
- 5,7244 bedrooms
- 1,4785+ bedrooms

- Bedrooms in renter-occupied apartments in Wheaton, Illinois
- 132no bedroom
- 2,5011 bedroom
- 2,0222 bedrooms
- 6583 bedrooms
- 1414 bedrooms
- 275+ bedrooms

- Cars and other vehicles available in Wheaton in owner-occupied houses/condos
- 406no vehicle
- 3,8571 vehicle
- 7,3592 vehicles
- 2,1153 vehicles
- 7624 vehicles
- 575+ vehicles

- Cars and other vehicles available in Wheaton in renter-occupied apartments
- 639no vehicle
- 2,7891 vehicle
- 1,8272 vehicles
- 1293 vehicles
- 304 vehicles
- 675+ vehicles

- Rooms in owner-occupied houses in Wheaton, Illinois
- 51 room
- 442 rooms
- 1183 rooms
- 8974 rooms
- 1,6075 rooms
- 2,1356 rooms
- 2,0207 rooms
- 2,5338 rooms
- 5,1979+ rooms

- Rooms in renter-occupied apartments in Wheaton, Illinois
- 991 room
- 5742 rooms
- 1,7283 rooms
- 1,5554 rooms
- 6105 rooms
- 4066 rooms
- 3047 rooms
- 1258 rooms
- 839+ rooms


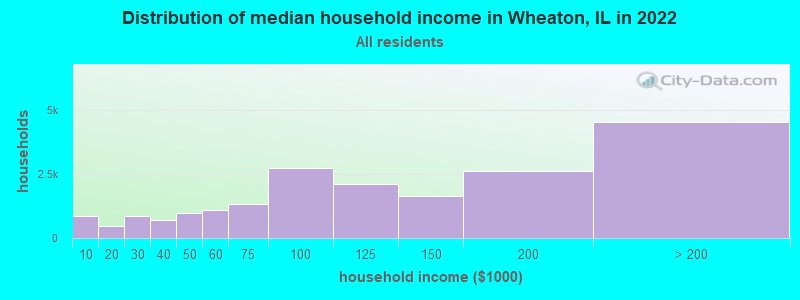
Wheaton, IL household income distribution

- 858Less than $10,000
- 468$10,000 to $19,999
- 866$20,000 to $29,999
- 708$30,000 to $39,999
- 985$40,000 to $49,999
- 1,110$50,000 to $59,999
- 1,345$60,000 to $74,999
- 2,727$75,000 to $99,999
- 2,093$100,000 to $124,999
- 1,643$125,000 to $149,999
- 2,633$150,000 to $199,999
- 4,535$200,000 or more
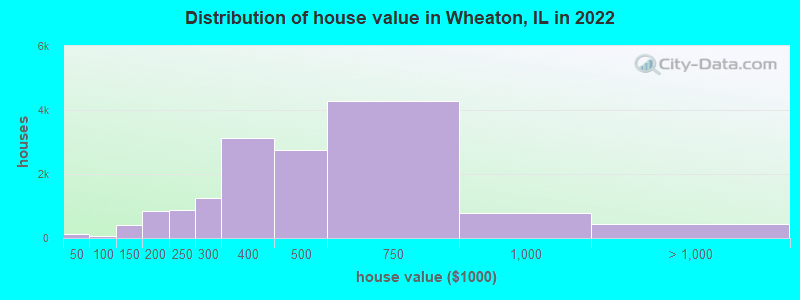
Home value of owner - occupied houses in 2022 in Wheaton, IL
-
- 21Less than $10,000
- 26$10,000 to $14,999
- 32$25,000 to $29,999
- 11$30,000 to $34,999
- 18$35,000 to $39,999
- 19$40,000 to $49,999
- 38$60,000 to $69,999
- 10$70,000 to $79,999
- 8$80,000 to $89,999
- 69$100,000 to $124,999
- 337$125,000 to $149,999
- 464$150,000 to $174,999
- 374$175,000 to $199,999
- 866$200,000 to $249,999
- 1,248$250,000 to $299,999
- 3,117$300,000 to $399,999
- 2,753$400,000 to $499,999
- 4,287$500,000 to $749,999
- 793$750,000 to $999,999
- 302$1,000,000 to $1,499,999
- 96$1,500,000 to $1,999,999
- 26$2,000,000 or more
Rent paid by renters in 2022 in Wheaton, IL
-
- 38$100 to $149
- 16$150 to $199
- 82$200 to $249
- 16$250 to $299
- 52$350 to $399
- 22$400 to $449
- 42$500 to $549
- 48$550 to $599
- 17$700 to $749
- 16$750 to $799
- 211$800 to $899
- 203$900 to $999
- 795$1,000 to $1,249
- 962$1,250 to $1,499
- 1,377$1,500 to $1,999
- 769$2,000 to $2,499
- 80$2,500 to $2,999
- 47$3,000 to $3,499
- 243$3,500 or more
- 92No cash rent


Percentage of workers working in this county: 77.2%
Number of people working at home: 6,560 (25.0% of all workers)
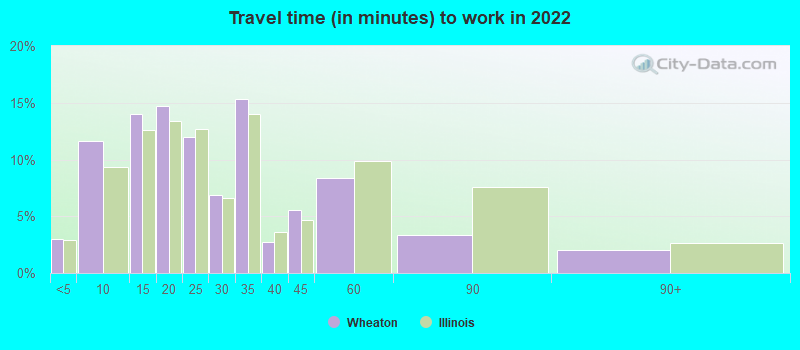
Travel time to work (commute)
- Less than 5 minutes: 562
- 5 to 9 minutes: 2,166
- 10 to 14 minutes: 3,025
- 15 to 19 minutes: 3,125
- 20 to 24 minutes: 2,804
- 25 to 29 minutes: 1,374
- 30 to 34 minutes: 2,028
- 35 to 39 minutes: 581
- 40 to 44 minutes: 1,056
- 45 to 59 minutes: 1,271
- 60 to 89 minutes: 1,477
- 90 or more minutes: 410
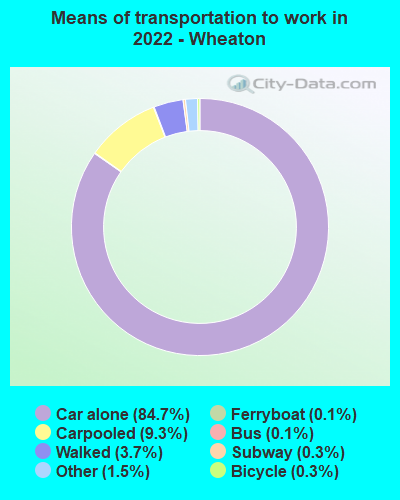
Means of transportation to work:
- Drove a car alone: 16,613 (63.4%)
- Carpooled: 2,241 (8.5%)
- Bus: 34 (0.1%)
- Subway or elevated rail: 3 (0.0%)
- Long-distance train or commuter rail: 59 (0.2%)
- Ferryboat: 14 (0.1%)
- Taxi: 331 (1.3%)
- Bicycle: 57 (0.2%)
- Walked: 678 (2.6%)
- Worked at home: 6,560 (25.0%)

- Unemployment by race in 2022
- Unemployment rate for White non-Hispanic residents
- 2.2%Males
- 2.3%Females
- Unemployment rate for Black residents
- 8.2%Males
- 4.1%Females
- Unemployment rate for Asian residents
- 2.9%Males
- 4.8%Females
- Unemployment rate for other race residents
- 4.9%Males
- 0.4%Females
- Unemployment rate for two or more race residents
- 4.5%Males
- 7.8%Females
- Unemployment rate for Hispanic or Latino residents
- 5.3%Males
- 11.4%Females

- Year of entry for the foreign-born population in Wheaton, Illinois
- 2,8362010 or later
- 9702000 to 2009
- 8791990 to 1999
- 8731980 to 1989
- 8601970 to 1979
- 940Before 1970
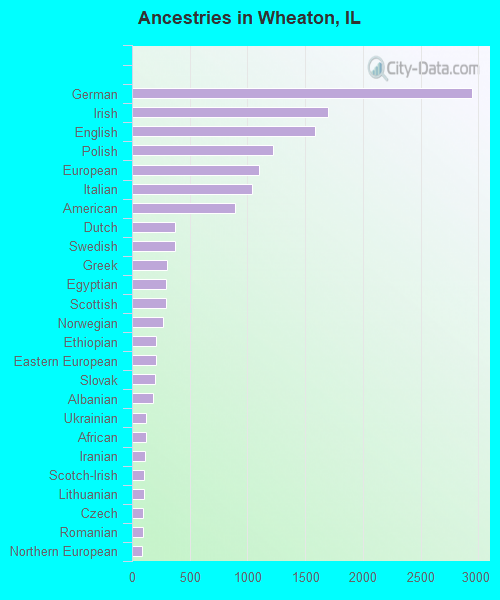
First ancestries reported:
- German: 2,945 (13.6%)
- Irish: 1,694 (7.8%)
- English: 1,586 (7.3%)
- Polish: 1,220 (5.6%)
- European: 1,097 (5.1%)
- Italian: 1,036 (4.8%)
- American: 890 (4.1%)
- Dutch: 375 (1.7%)
- Swedish: 369 (1.7%)
- Greek: 300 (1.4%)
- Egyptian: 298 (1.4%)
- Scottish: 292 (1.3%)
- Norwegian: 268 (1.2%)
- Ethiopian: 204 (0.9%)
- Eastern European: 204 (0.9%)
- Slovak: 201 (0.9%)
- Albanian: 185 (0.9%)
- Ukrainian: 124 (0.6%)
- African: 119 (0.5%)
- Iranian: 110 (0.5%)
- Scotch-Irish: 106 (0.5%)
- Lithuanian: 100 (0.5%)
- Czech: 98 (0.5%)
- Romanian: 95 (0.4%)
- Northern European: 86 (0.4%)
- British: 77 (0.4%)
- Iraqi: 76 (0.4%)
- Russian: 73 (0.3%)
- Bulgarian: 71 (0.3%)
- Serbian: 71 (0.3%)
- Australian: 70 (0.3%)
- Scandinavian: 68 (0.3%)
- Swiss: 59 (0.3%)
- Austrian: 58 (0.3%)
- French: 51 (0.2%)
- Yugoslavian: 50 (0.2%)
- Welsh: 46 (0.2%)
- Nigerian: 44 (0.2%)
- Macedonian: 43 (0.2%)
- Moroccan: 41 (0.2%)
- Croatian: 36 (0.2%)
- French Canadian: 29 (0.1%)
- Finnish: 28 (0.1%)
- Arab: 26 (0.1%)
- Armenian: 24 (0.1%)
- Hungarian: 19 (0.09%)
- Belgian: 19 (0.09%)
- Lebanese: 18 (0.08%)
- Haitian: 15 (0.07%)
- Danish: 14 (0.06%)
- Portuguese: 14 (0.06%)
- Zimbabwean: 14 (0.06%)
- Czechoslovakian: 12 (0.06%)
- Latvian: 10 (0.05%)
- Brazilian: 10 (0.05%)
- Jamaican: 10 (0.05%)
- Slovene: 9 (0.04%)
- Canadian: 8 (0.04%)
- Palestinian: 8 (0.04%)
- Soviet Union: 8 (0.04%)
- Slavic: 7 (0.03%)
- Assyrian: 6 (0.03%)
- Estonian: 5 (0.02%)
Most common places of birth for foreign-born residents (%):
| Wheaton: | 9.2% (547) |
| Illinois: | 9.2% (166,409) |
| Wheaton: | 8.9% (534) |
| Illinois: | 34.7% (626,958) |
| Wheaton: | 8.6% (511) |
| Illinois: | 0.3% (4,552) |
| Wheaton: | 5.4% (322) |
| Illinois: | 4.1% (74,364) |
| Wheaton: | 4.0% (240) |
| Illinois: | 0.7% (13,214) |
| Wheaton: | 3.6% (217) |
| Illinois: | 0.4% (6,488) |
| Wheaton: | 3.6% (215) |
| Illinois: | 0.3% (5,762) |
| Wheaton: | 2.8% (167) |
| Illinois: | 2.2% (40,393) |
| Wheaton: | 2.7% (161) |
| Illinois: | 6.9% (124,474) |
| Wheaton: | 2.3% (139) |
| Illinois: | 0.0% (659) |
| Wheaton: | 2.2% (130) |
| Illinois: | 0.5% (8,551) |
| Wheaton: | 2.1% (126) |
| Illinois: | 0.9% (16,553) |
| Wheaton: | 2.0% (120) |
| Illinois: | 1.2% (22,269) |
| Wheaton: | 1.8% (108) |
| Illinois: | 5.2% (93,003) |
| Wheaton: | 1.8% (108) |
| Illinois: | 0.1% (1,954) |
| Wheaton: | 1.8% (106) |
| Illinois: | 0.4% (6,922) |
| Wheaton: | 1.6% (93) |
| Illinois: | 1.0% (18,753) |
Place of birth for U.S.-born residents:
- This state: 32,467
- Other state: 13,802
- Northeast: 2,385
- Midwest: 6,627
- South: 2,691
- West: 2,086
85.8% of Wheaton residents lived in the same house 1 years ago.
Out of people who lived in different houses, 31.2% lived in this county.
Out of people who lived in different counties, 64.5% lived in Illinois.
| Wheaton: | 85.8% |
| State average: | 88.3% |
Education attainment for males 25 years and older:
- No schooling: 334
- Nursery to 4th grade: 26
- 5th and 6th grade: 35
- 7th and 8th grade: 163
- 9th grade: 13
- 10th grade: 107
- 11th grade: 29
- 12th grade, no diploma: 104
- High school graduate (or equivalency): 1,302
- Less than 1 year of college: 643
- Some college more than 1 year, no degree: 1,611
- Associate degree: 1,471
- Bachelor's degree: 6,182
- Master's degree: 3,424
- Professional school degree: 998
- Doctorate degree: 654

Education attainment for females 25 years and older:
- No schooling: 335
- Nursery to 4th grade: 47
- 5th and 6th grade: 8
- 7th and 8th grade: 60
- 9th grade: 20
- 10th grade: 94
- 11th grade: 34
- 12th grade, no diploma: 78
- High school graduate (or equivalency): 2,222
- Less than 1 year of college: 675
- Some college more than 1 year, no degree: 1,503
- Associate degree: 1,284
- Bachelor's degree: 7,532
- Master's degree: 3,781
- Professional school degree: 681
- Doctorate degree: 328


Housing units in structures:
- One, detached: 12,400
- One, attached: 2,376
- Two: 246
- 3 or 4: 1,191
- 5 to 9: 1,298
- 10 to 19: 1,045
- 20 to 49: 771
- 50 or more: 1,776
- Mobile homes: 23
- Boats, RVs, vans, etc.: 5
Housing units lacking complete kitchen facilities in 2022: 0.4%
House/condo owner moved in on average 12 years ago
Renter moved in on average 1 years ago

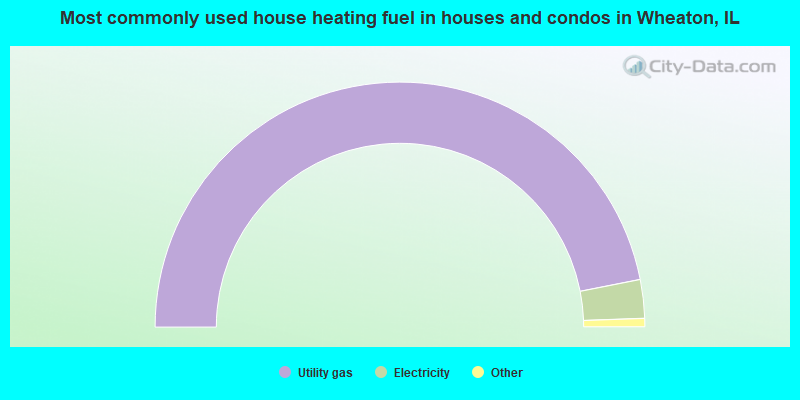
- 93.8%Utility gas
- 5.1%Electricity
- 0.7%Bottled, tank, or LP gas
- 0.3%Other fuel
- 0.1%No fuel used
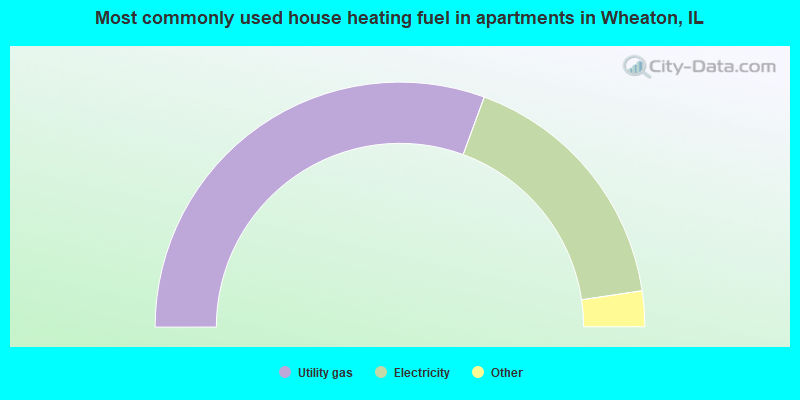
- 61.2%Utility gas
- 34.1%Electricity
- 1.4%Other fuel
- 1.2%Bottled, tank, or LP gas
- 1.2%No fuel used
- 0.9%Fuel oil, kerosene, etc.
Private vs. public school enrollment:
| Here: | 22.5% |
| Illinois: | 13.3% |
| Here: | 11.2% |
| Illinois: | 9.9% |
| Here: | 60.9% |
| Illinois: | 27.4% |


