Westminster, CA (California) Houses and Residents
| Westminster: | $831,500 |
| California: | $715,900 |
Mean price in 2022:
Detached houses: $967,189
Here: $967,189 State: $988,808 Townhouses or other attached units: $723,725
Here: $723,725 State: $838,546 In 2-unit structures: $1,237,580
Here: $1,237,580 State: $1,138,100 In 3-to-4-unit structures: $744,796
Here: $744,796 State: $824,253 In 5-or-more-unit structures: $1,286,466
Here: $1,286,466 State: $730,996 Mobile homes: $129,693
Here: $129,693 State: $184,506
Total population: 92,068 (Urban population: 87,884, Rural population: 0)
Houses: 29,430 (28,477 occupied: 15,479 owner occupied, 12,998 renter occupied)
| % of renters here: | 46% |
| State: | 44% |
Housing density: 2,911 houses/condos per square mile
Median price asked for vacant for-sale houses and condos in 2022: $586,851.
Median contract rent in 2022: $1,943 (lower quartile is $1,535, upper quartile is over $2,000)
Median rent asked for vacant for-rent units in 2022: $2,238
Median gross rent in Westminster, CA in 2022: over $2,000
Housing units in Westminster with a mortgage: 8,951 (688 second mortgage, 34 home equity loan, 595 both second mortgage and home equity loan)
Houses without a mortgage: 124
Median household income for houses/condos with a mortgage: $122,068
Median household income for apartments without a mortgage: $87,697
Median monthly housing costs: $1,946
Compare current foreclosures in Westminster, CA:
| Photo | Address | Area | Beds / Baths | Price | Details |
|---|---|---|---|---|---|

|
#1
Webber Pl
Westminster, CA 92683
|
989 sq. feet
|
1 baths 3 beds |
show details | |

|
#2
Coronet Ave
Westminster, CA 92683
|
1,799 sq. feet
|
2 baths 4 beds |
show details | |

|
#3
Calendula Ave
Westminster, CA 92683
|
1,406 sq. feet
|
2 baths 3 beds |
show details | |

|
#4
Westminster Blvd
Westminster, CA 92683
|
1,547 sq. feet
|
3 baths 4 beds |
show details | |

|
#5
Goldenwest St
Westminster, CA 92683
|
1,177 sq. feet
|
2 baths 4 beds |
show details | |

|
#6
Roxanne Dr
Westminster, CA 92683
|
2,398 sq. feet
|
5 baths 5 beds |
show details | |

|
#7
Downing Cir
Westminster, CA 92683
|
2,449 sq. feet
|
3 baths 4 beds |
show details | |

|
#8
Main St
Westminster, CA 92683
|
1,076 sq. feet
|
1 baths 2 beds |
show details | |

|
#9
Tahoe St
Westminster, CA 92683
|
1,183 sq. feet
|
2 baths 3 beds |
show details | |

|
#10
Gretchen Ln
Westminster, CA 92683
|
1,239 sq. feet
|
2 baths 3 beds |
show details |
| Photo | Address | Area | Beds / Baths | Price | Details |
|---|---|---|---|---|---|

|
#11
Eastbridge St
Westminster, CA 92683
|
1,781 sq. feet
|
3 baths 3 beds |
show details | |

|
#12
Bestel Ave
Westminster, CA 92683
|
2,278 sq. feet
|
2 baths 4 beds |
show details | |

|
#13
Alfred Ave
Westminster, CA 92683
|
1,471 sq. feet
|
2 baths 3 beds |
show details | |

|
#14
Schooner Ave
Westminster, CA 92683
|
1,213 sq. feet
|
2 baths 3 beds |
show details | |

|
#15
Henley Dr # 57
Westminster, CA 92683
|
1,175 sq. feet
|
2 baths 2 beds |
show details | |

|
#16
Trask Ave
Westminster, CA 92683
|
2,120 sq. feet
|
2 baths 4 beds |
show details | |

|
#17
Mast Ave
Westminster, CA 92683
|
1,202 sq. feet
|
2 baths 3 beds |
show details | |

|
#18
Bowling Green St
Westminster, CA 92683
|
2,156 sq. feet
|
2 baths 3 beds |
show details | |

|
#19
Castle St
Westminster, CA 92683
|
1,527 sq. feet
|
1 baths 4 beds |
show details | |

|
#20
Bel Air Cir
Westminster, CA 92683
|
2,447 sq. feet
|
3 baths 3 beds |
show details |
| Photo | Address | Area | Beds / Baths | Price | Details |
|---|---|---|---|---|---|

|
#21
Plumwood St
Westminster, CA 92683
|
2,590 sq. feet
|
3 baths 4 beds |
show details | |

|
#22
Emerado Pl
Westminster, CA 92683
|
1,202 sq. feet
|
2 baths 3 beds |
show details | |

|
#23
Bestel Ave
Westminster, CA 92683
|
1,561 sq. feet
|
2 baths 3 beds |
show details | |

|
#24
Coronet Ave
Westminster, CA 92683
|
1,673 sq. feet
|
3 baths 3 beds |
show details | |

|
#25
Marie Pl
Westminster, CA 92683
|
1,594 sq. feet
|
2 baths 3 beds |
show details | |

|
#26
Hazard Ave
Westminster, CA 92683
|
1,415 sq. feet
|
2 baths 3 beds |
show details | |

|
#27
Harper St
Westminster, CA 92683
|
1,202 sq. feet
|
2 baths 3 beds |
show details | |

|
#28
Van De Velde Way
Westminster, CA 92683
|
1,033 sq. feet
|
2 baths 3 beds |
show details | |

|
#29
Jennrich Ave
Westminster, CA 92683
|
1,283 sq. feet
|
2 baths 4 beds |
show details | |

|
#30
Edwards St
Westminster, CA 92683
|
1,538 sq. feet
|
2 baths 4 beds |
show details |
| Photo | Address | Area | Beds / Baths | Price | Details |
|---|---|---|---|---|---|

|
#31
Stengal St
Westminster, CA 92683
|
1,204 sq. feet
|
1 baths 3 beds |
show details | |

|
#32
Santee Ave
Westminster, CA 92683
|
1,482 sq. feet
|
2 baths 3 beds |
show details | |

|
#33
Banbury Ave
Westminster, CA 92683
|
2,025 sq. feet
|
2 baths 4 beds |
show details | |

|
#34
Barcelona Plz
Westminster, CA 92683
|
1,225 sq. feet
|
3 baths 2 beds |
show details | |

|
#35
Vallecito Dr
Westminster, CA 92683
|
1,268 sq. feet
|
2 baths 4 beds |
show details | |

|
#36
Burgess Cir
Westminster, CA 92683
|
1,662 sq. feet
|
2 baths 4 beds |
show details | |

|
#37
England Ave
Westminster, CA 92683
|
2,268 sq. feet
|
3 baths 4 beds |
show details | |

|
#38
Summerwood St
Westminster, CA 92683
|
- sq. feet
|
1 baths 3 beds |
show details | |

|
#39
Del Ray Cir
Westminster, CA 92683
|
- sq. feet
|
- baths - beds |
show details | |

|
#40
Garden Grove Blvd Spc 249
Westminster, CA 92683
|
- sq. feet
|
- baths - beds |
show details |
| Photo | Address | Area | Beds / Baths | Price | Details |
|---|---|---|---|---|---|

|
#41
Hazard Ave Apt 3
Westminster, CA 92683
|
- sq. feet
|
- baths - beds |
show details | |

|
#42
Bolsa Ave Ste G19
Westminster, CA 92683
|
- sq. feet
|
- baths - beds |
show details | |

|
#43
Frances St # B
Westminster, CA 92683
|
- sq. feet
|
- baths - beds |
show details | |

|
#44
21st St Apt A
Westminster, CA 92683
|
- sq. feet
|
- baths - beds |
show details | |

|
#45
15th St Apt D
Westminster, CA 92683
|
- sq. feet
|
- baths - beds |
show details | |

|
#46
Magnolia St Ofc 86
Westminster, CA 92683
|
- sq. feet
|
- baths - beds |
show details | |

|
#47
Melanie Ln Spc 11
Westminster, CA 92683
|
- sq. feet
|
- baths - beds |
show details | |

|
#48
Springdale St Apt 11
Westminster, CA 92683
|
- sq. feet
|
- baths - beds |
show details | |

|
#49
Iowa St
Westminster, CA 92683
|
- sq. feet
|
- baths - beds |
show details | |

|
Check over 1 million property listings on Foreclosure.com!
|
browse all offers | |||

Latest news about housing in Westminster, CA collected exclusively by city-data.com from local newspapers, TV, and radio stations


Median year apartment built: 1973
Household type by relationship:
Households: 89,399- Male householders: 16,307 (3,456 living alone), Female householders: 12,170 (2,164 living alone)
15,893 spouses (15,845 opposite-sex spouses), 774 unmarried partners, (730 opposite-sex unmarried partners), 23,969 children (23,107 natural, 184 adopted, 678 stepchildren), 2,642 grandchildren, 3,339 brothers or sisters, 4,112 parents, 0 foster children, 3,956 other relatives, 5,809 non-relatives
- In group quarters: 428
Size of family households: 6,439 2-persons, 5,482 3-persons, 4,111 4-persons, 3,040 5-persons, 1,222 6-persons, 1,119 7-or-more-persons.
Size of nonfamily households: 5,620 1-person, 792 2-persons, 329 3-persons, 59 4-persons, 264 7-or-more-persons.
10,156 married couples with children.
2,180 single-parent households (525 men, 1,655 women).
34.7% of residents of Westminster speak English at home.
17.9% of residents speak Spanish at home (59% speak English very well, 18% speak English well, 16% speak English not well, 6% don't speak English at all).
1.0% of residents speak other Indo-European language at home (69% speak English very well, 27% speak English well, 4% speak English not well).
45.4% of residents speak Asian or Pacific Island language at home (35% speak English very well, 27% speak English well, 29% speak English not well, 9% don't speak English at all).
1.3% of residents speak other language at home (68% speak English very well, 30% speak English well, 2% speak English not well).
Foreign born population: 42,033 (47.0%)
(74.9% of them are naturalized citizens)
| Here: | 5.8 |
| State: | 6.0 |
| Here: | 4.1 |
| State: | 3.9 |

- Bedrooms in owner-occupied houses and condos in Westminster, California
- 193no bedroom
- 1551 bedroom
- 2,4452 bedrooms
- 6,8103 bedrooms
- 4,7704 bedrooms
- 1,1065+ bedrooms

- Bedrooms in renter-occupied apartments in Westminster, California
- 482no bedroom
- 2,8211 bedroom
- 5,0272 bedrooms
- 2,9183 bedrooms
- 1,6554 bedrooms
- 955+ bedrooms

- Cars and other vehicles available in Westminster in owner-occupied houses/condos
- 308no vehicle
- 3,3481 vehicle
- 5,5072 vehicles
- 3,0543 vehicles
- 2,3954 vehicles
- 8675+ vehicles

- Cars and other vehicles available in Westminster in renter-occupied apartments
- 1,430no vehicle
- 3,0581 vehicle
- 4,7462 vehicles
- 2,5133 vehicles
- 9894 vehicles
- 2625+ vehicles

- Rooms in owner-occupied houses in Westminster, California
- 01 room
- 452 rooms
- 7003 rooms
- 2,8794 rooms
- 3,3435 rooms
- 2,9266 rooms
- 2,4347 rooms
- 2,0968 rooms
- 1,0569+ rooms

- Rooms in renter-occupied apartments in Westminster, California
- 4821 room
- 9882 rooms
- 2,8533 rooms
- 3,6854 rooms
- 2,5705 rooms
- 1,3896 rooms
- 1947 rooms
- 7888 rooms
- 499+ rooms


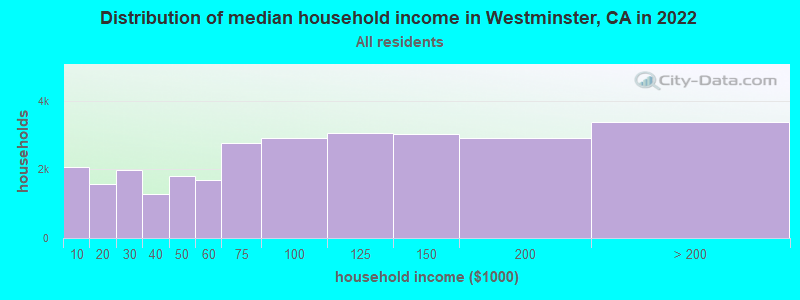
Westminster, CA household income distribution

- 2,071Less than $10,000
- 1,567$10,000 to $19,999
- 1,971$20,000 to $29,999
- 1,289$30,000 to $39,999
- 1,795$40,000 to $49,999
- 1,686$50,000 to $59,999
- 2,783$60,000 to $74,999
- 2,920$75,000 to $99,999
- 3,057$100,000 to $124,999
- 3,027$125,000 to $149,999
- 2,928$150,000 to $199,999
- 3,383$200,000 or more
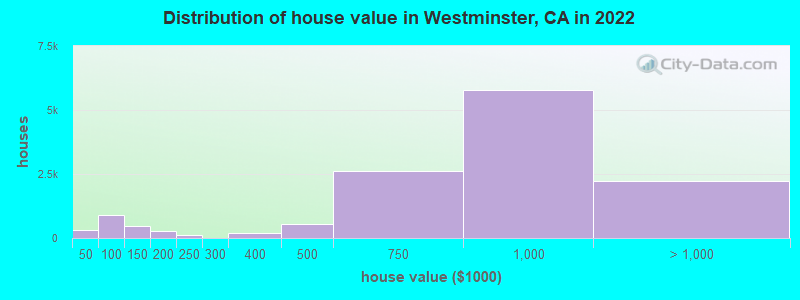
Home value of owner - occupied houses in 2022 in Westminster, CA
-
- 98Less than $10,000
- 26$10,000 to $14,999
- 20$15,000 to $19,999
- 21$25,000 to $29,999
- 76$30,000 to $34,999
- 30$35,000 to $39,999
- 36$40,000 to $49,999
- 187$50,000 to $59,999
- 50$60,000 to $69,999
- 137$70,000 to $79,999
- 333$80,000 to $89,999
- 167$90,000 to $99,999
- 353$100,000 to $124,999
- 110$125,000 to $149,999
- 249$150,000 to $174,999
- 18$175,000 to $199,999
- 105$200,000 to $249,999
- 15$250,000 to $299,999
- 213$300,000 to $399,999
- 551$400,000 to $499,999
- 2,611$500,000 to $749,999
- 5,777$750,000 to $999,999
- 2,007$1,000,000 to $1,499,999
- 137$1,500,000 to $1,999,999
- 99$2,000,000 or more
Rent paid by renters in 2022 in Westminster, CA
-
- 13Less than $100
- 53$100 to $149
- 162$200 to $249
- 110$250 to $299
- 227$300 to $349
- 31$350 to $399
- 108$400 to $449
- 100$450 to $499
- 170$500 to $549
- 67$550 to $599
- 166$600 to $649
- 98$650 to $699
- 45$700 to $749
- 55$750 to $799
- 262$800 to $899
- 296$900 to $999
- 893$1,000 to $1,249
- 770$1,250 to $1,499
- 4,046$1,500 to $1,999
- 2,729$2,000 to $2,499
- 1,518$2,500 to $2,999
- 740$3,000 to $3,499
- 259$3,500 or more
- 705No cash rent


Percentage of workers working in this county: 85.5%
Number of people working at home: 4,437 (11.0% of all workers)
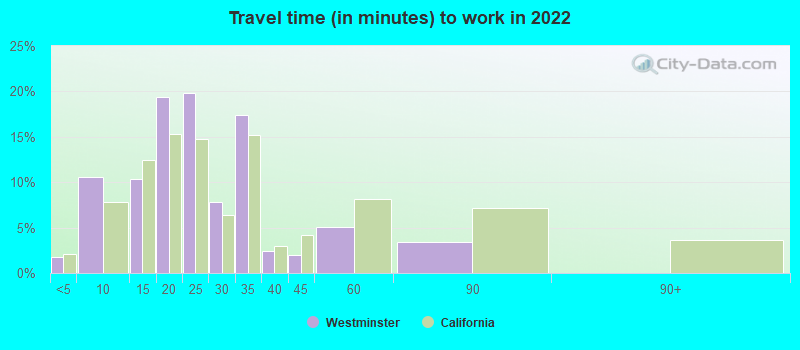
Travel time to work (commute)
- Less than 5 minutes: 321
- 5 to 9 minutes: 3,312
- 10 to 14 minutes: 4,833
- 15 to 19 minutes: 5,284
- 20 to 24 minutes: 6,010
- 25 to 29 minutes: 3,008
- 30 to 34 minutes: 6,716
- 35 to 39 minutes: 493
- 40 to 44 minutes: 1,421
- 45 to 59 minutes: 2,581
- 60 to 89 minutes: 1,703
- 90 or more minutes: 1,876
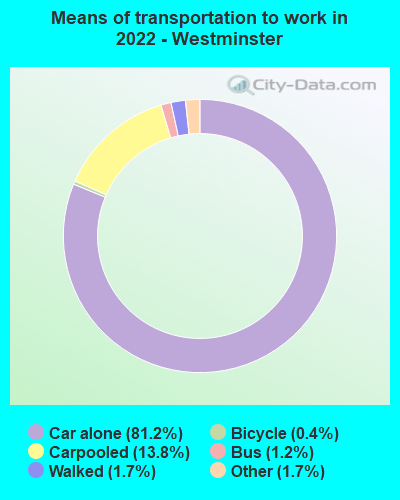
Means of transportation to work:
- Drove a car alone: 14,566 (65.0%)
- Carpooled: 2,692 (12.0%)
- Bus: 191 (0.9%)
- Long-distance train or commuter rail: 4 (0.0%)
- Taxi: 350 (1.6%)
- Bicycle: 75 (0.3%)
- Walked: 304 (1.4%)
- Worked at home: 4,437 (19.8%)

- Unemployment by race in 2022
- Unemployment rate for White non-Hispanic residents
- 6.8%Males
- 1.4%Females
- Unemployment rate for Black residents
- 7.7%Females
- Unemployment rate for American Indian and Alaska Native residents
- 25.2%Males
- 3.4%Females
- Unemployment rate for Asian residents
- 4.3%Males
- 1.9%Females
- Unemployment rate for other race residents
- 3.3%Males
- 7.2%Females
- Unemployment rate for two or more race residents
- 16.1%Males
- 9.2%Females
- Unemployment rate for Hispanic or Latino residents
- 6.4%Males
- 8.2%Females

- Year of entry for the foreign-born population in Westminster, California
- 8,3492010 or later
- 7,3612000 to 2009
- 10,9661990 to 1999
- 12,4771980 to 1989
- 6,2381970 to 1979
- 2,308Before 1970

First ancestries reported:
- English: 1,071 (1.8%)
- American: 1,030 (1.7%)
- German: 777 (1.3%)
- Egyptian: 692 (1.2%)
- Irish: 661 (1.1%)
- Italian: 648 (1.1%)
- European: 342 (0.6%)
- Scottish: 220 (0.4%)
- Norwegian: 180 (0.3%)
- Canadian: 111 (0.2%)
- Hungarian: 98 (0.2%)
- French: 97 (0.2%)
- Dutch: 96 (0.2%)
- Polish: 75 (0.1%)
- Romanian: 73 (0.1%)
- Turkish: 69 (0.1%)
- Swedish: 68 (0.1%)
- French Canadian: 62 (0.1%)
- Slovak: 58 (0.10%)
- Greek: 57 (0.10%)
- Danish: 56 (0.09%)
- Syrian: 53 (0.09%)
- Scandinavian: 51 (0.09%)
- British: 51 (0.09%)
- Welsh: 47 (0.08%)
- Yugoslavian: 44 (0.07%)
- Ukrainian: 43 (0.07%)
- Iranian: 42 (0.07%)
- Palestinian: 42 (0.07%)
- Eastern European: 41 (0.07%)
- Arab: 39 (0.07%)
- Lebanese: 36 (0.06%)
- Armenian: 35 (0.06%)
- Northern European: 30 (0.05%)
- Austrian: 29 (0.05%)
- Moroccan: 28 (0.05%)
- Finnish: 27 (0.05%)
- Czech: 25 (0.04%)
- Croatian: 24 (0.04%)
- Scotch-Irish: 21 (0.04%)
- African: 20 (0.03%)
- Russian: 19 (0.03%)
- Portuguese: 9 (0.02%)
- Afghan: 6 (0.01%)
- Ethiopian: 6 (0.01%)
- Pennsylvania German: 5 (0.01%)
- Swiss: 5 (0.01%)
- Nigerian: 4 (0.01%)
- Czechoslovakian: 3 (0.01%)
Most common places of birth for foreign-born residents (%):
| Westminster: | 69.3% (28,494) |
| California: | 4.9% (512,335) |
| Westminster: | 14.5% (5,983) |
| California: | 37.2% (3,881,193) |
| Westminster: | 2.2% (915) |
| California: | 7.8% (818,297) |
Place of birth for U.S.-born residents:
- This state: 39,259
- Other state: 7,293
- Northeast: 1,729
- Midwest: 2,780
- South: 1,598
- West: 1,186
92.2% of Westminster residents lived in the same house 1 years ago.
Out of people who lived in different houses, 43.2% lived in this county.
Out of people who lived in different counties, 64.6% lived in California.
| Westminster: | 92.2% |
| State average: | 88.9% |
Education attainment for males 25 years and older:
- No schooling: 1,506
- Nursery to 4th grade: 548
- 5th and 6th grade: 1,276
- 7th and 8th grade: 233
- 9th grade: 801
- 10th grade: 594
- 11th grade: 472
- 12th grade, no diploma: 1,954
- High school graduate (or equivalency): 6,831
- Less than 1 year of college: 2,386
- Some college more than 1 year, no degree: 4,892
- Associate degree: 4,224
- Bachelor's degree: 5,743
- Master's degree: 1,523
- Professional school degree: 1,512
- Doctorate degree: 356

Education attainment for females 25 years and older:
- No schooling: 1,818
- Nursery to 4th grade: 714
- 5th and 6th grade: 910
- 7th and 8th grade: 1,117
- 9th grade: 1,047
- 10th grade: 399
- 11th grade: 88
- 12th grade, no diploma: 1,339
- High school graduate (or equivalency): 8,882
- Less than 1 year of college: 1,479
- Some college more than 1 year, no degree: 3,183
- Associate degree: 1,999
- Bachelor's degree: 5,512
- Master's degree: 1,932
- Professional school degree: 847
- Doctorate degree: 148


Housing units in structures:
- One, detached: 15,979
- One, attached: 2,527
- Two: 434
- 3 or 4: 1,113
- 5 to 9: 827
- 10 to 19: 1,290
- 20 to 49: 2,053
- 50 or more: 2,139
- Mobile homes: 3,068
Median worth of mobile homes: $98,300
Housing units lacking complete kitchen facilities in 2022: 4.6%
House/condo owner moved in on average 20 years ago
Renter moved in on average 4 years ago

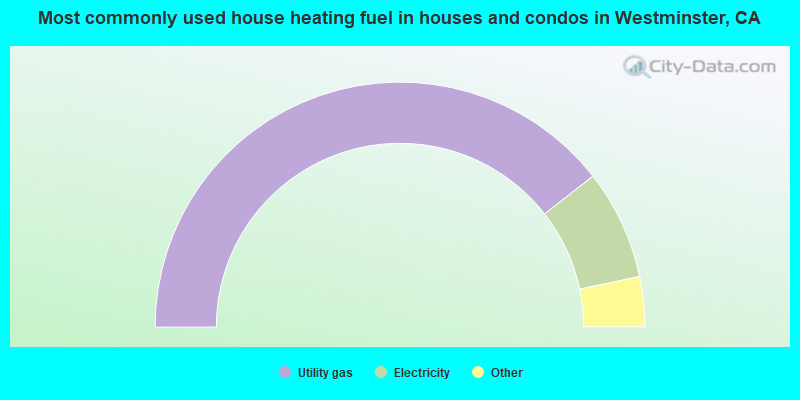
- 78.9%Utility gas
- 14.5%Electricity
- 2.6%No fuel used
- 2.2%Bottled, tank, or LP gas
- 1.4%Solar energy
- 0.2%Other fuel
- 0.1%Fuel oil, kerosene, etc.
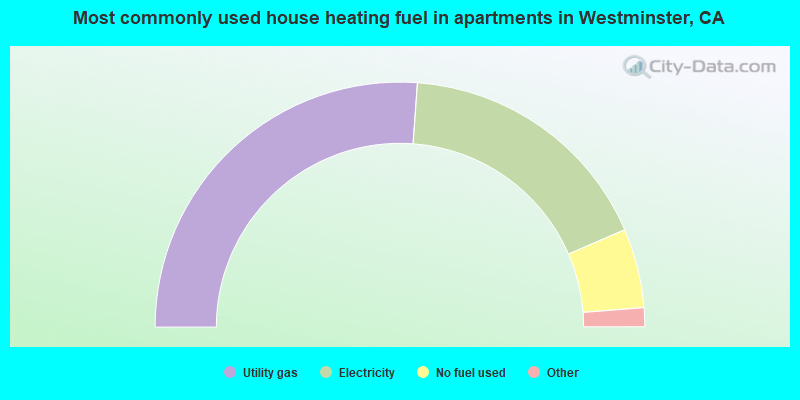
- 52.3%Utility gas
- 34.7%Electricity
- 10.5%No fuel used
- 2.2%Bottled, tank, or LP gas
- 0.3%Solar energy
Private vs. public school enrollment:
| Here: | 10.6% |
| California: | 10.5% |
| Here: | 4.4% |
| California: | 8.5% |
| Here: | 5.9% |
| California: | 15.9% |


