Housing density: 2,480 houses/condos per square mile
Median price asked for vacant for-sale houses and condos in 2022 in this county: $351,734.
Median contract rent in 2022: $1,069 (lower quartile is $767, upper quartile is $1,334)
Median rent asked for vacant for-rent units in 2022: $849
Median gross rent in West and East Lealman, FL in 2022: $1,217
Housing units in West and East Lealman with a mortgage: 3,084 (494 second mortgage, 183 home equity loan, 25 both second mortgage and home equity loan) Houses without a mortgage: 934
Compare current foreclosures near West and East Lealman, FL:
In family households: 674,511 (154,960 male householders, 79,308 female householders)
167,726 spouses, 203,909 children (188,786 natural, 5,247 adopted, 9,876 stepchildren), 16,681 grandchildren, 8,377 brothers or sisters, 8,245 parents, foster children, 9,430 other relatives, 21,333 non-relatives
In nonfamily households: 222,353 (81,253 male householders (62,041 living alone)), 100,355 female householders (85,270 living alone)), 40,745 nonrelatives
In group quarters: 19,678 (11,583 institutionalized population)
107,059 married couples with children.
51,422 single-parent households (10,537 men, 40,885 women).
87.2% of residents of West and East Lealman speak English at home.
5.4% of residents speak Spanish at home (58% speak English very well, 18% speak English well, 18% speak English not well, 5% don't speak English at all).
4.0% of residents speak other Indo-European language at home (62% speak English very well, 18% speak English well, 16% speak English not well, 4% don't speak English at all).
3.2% of residents speak Asian or Pacific Island language at home (31% speak English very well, 39% speak English well, 28% speak English not well, 1% don't speak English at all).
0.2% of residents speak other language at home (100% speak English very well).
Foreign born population: 2,353 (10.3%)
(47.0% of them are naturalized citizens)
Year of entry for the foreign-born population in West and East Lealman, Florida
3711995 to March 2000
3591990 to 1994
1511985 to 1989
2281980 to 1984
1001975 to 1979
371970 to 1974
801965 to 1969
402Before 1965
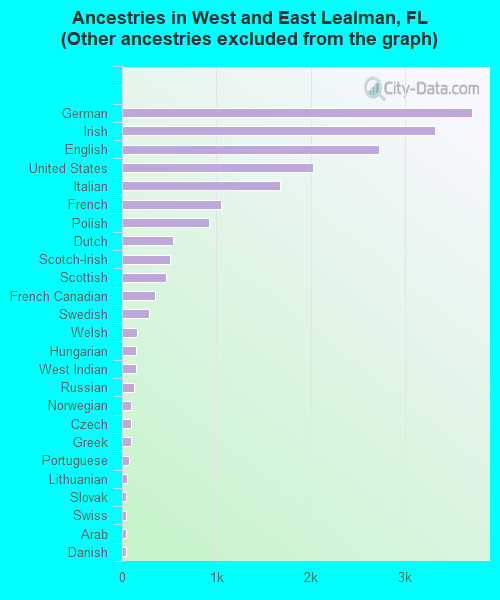
First ancestries reported:
Other: 4,547 (19.5%)
German: 3,706 (15.9%)
Irish: 3,318 (14.2%)
English: 2,726 (11.7%)
United States: 2,025 (8.7%)
Italian: 1,672 (7.2%)
French: 1,053 (4.5%)
Polish: 925 (4.0%)
Dutch: 542 (2.3%)
Scotch-Irish: 509 (2.2%)
Scottish: 468 (2.0%)
French Canadian: 353 (1.5%)
Swedish: 289 (1.2%)
Welsh: 156 (0.7%)
Hungarian: 147 (0.6%)
West Indian: 145 (0.6%)
Russian: 125 (0.5%)
Norwegian: 100 (0.4%)
Czech: 93 (0.4%)
Greek: 92 (0.4%)
Portuguese: 75 (0.3%)
Lithuanian: 54 (0.2%)
Slovak: 46 (0.2%)
Swiss: 41 (0.2%)
Arab: 38 (0.2%)
Danish: 38 (0.2%)
Ukrainian: 37 (0.2%)
Subsaharan African: 13 (0.06%)
Most common places of birth for foreign-born residents (%):
Vietnam
West and East Lealman:
23.8% (411)
Florida:
1.1% (28,790)
Canada
West and East Lealman:
12.0% (207)
Florida:
3.7% (99,139)
Dominican Republic
West and East Lealman:
5.7% (98)
Florida:
2.5% (66,690)
Cuba
West and East Lealman:
5.4% (94)
Florida:
24.1% (642,951)
Germany
West and East Lealman:
5.2% (90)
Florida:
2.4% (64,088)
Laos
West and East Lealman:
4.7% (81)
Florida:
0.1% (3,420)
Cambodia
West and East Lealman:
4.5% (77)
Florida:
0.1% (2,434)
United Kingdom
West and East Lealman:
4.1% (70)
Florida:
2.6% (70,384)
Yugoslavia
West and East Lealman:
4.0% (69)
Florida:
0.2% (5,735)
Bosnia and Herzegovina
West and East Lealman:
3.4% (58)
Florida:
0.2% (5,808)
Mexico
West and East Lealman:
3.2% (55)
Florida:
7.1% (189,119)
Philippines
West and East Lealman:
2.6% (45)
Florida:
1.6% (43,422)
Ecuador
West and East Lealman:
2.5% (44)
Florida:
1.1% (29,046)
Poland
West and East Lealman:
2.1% (37)
Florida:
0.9% (24,998)
Trinidad and Tobago
West and East Lealman:
1.9% (33)
Florida:
1.1% (28,788)
Thailand
West and East Lealman:
1.7% (29)
Florida:
0.3% (7,414)
Other Eastern Europe
West and East Lealman:
1.5% (26)
Florida:
0.6% (14,860)
Place of birth for U.S.-born residents:
This state: 6,588
Other state: 13,016
Northeast: 5,313
Midwest: 4,484
South: 2,714
West: 505
46% of West and East Lealman residents lived in the same house 5 years ago. Out of people who lived in different houses, 67% lived in this county. Out of people who lived in different counties, 31% lived in Florida.
Education attainment for males 25 years and older:
No schooling: 147
Nursery to 4th grade: 30
5th and 6th grade: 73
7th and 8th grade: 372
9th grade: 507
10th grade: 530
11th grade: 309
12th grade, no diploma: 647
High school graduate (or equivalency): 2,719
Less than 1 year of college: 424
Some college more than 1 year, no degree: 991
Associate degree: 373
Bachelor's degree: 461
Master's degree: 194
Professional school degree: 55
Doctorate degree: 36
Education attainment for females 25 years and older:
No schooling: 118
Nursery to 4th grade: 30
5th and 6th grade: 99
7th and 8th grade: 337
9th grade: 473
10th grade: 544
11th grade: 445
12th grade, no diploma: 511
High school graduate (or equivalency): 3,200
Less than 1 year of college: 412
Some college more than 1 year, no degree: 962
Associate degree: 367
Bachelor's degree: 418
Master's degree: 99
Professional school degree: 77
Doctorate degree: 20
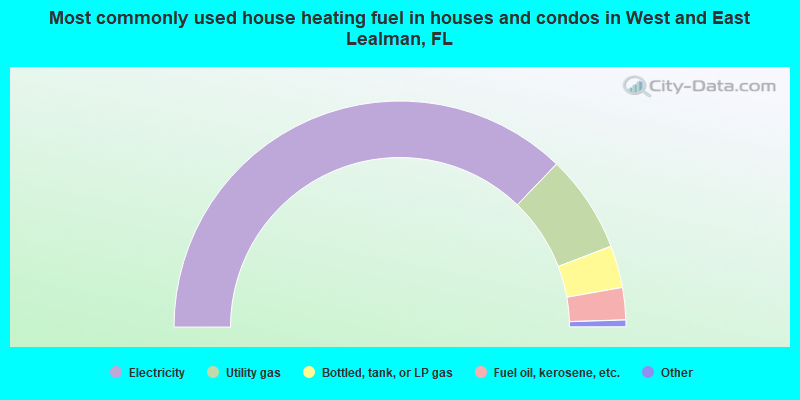
Housing units in structures:
One, detached: 5,535
One, attached: 267
Two: 614
3 or 4: 472
5 to 9: 269
10 to 19: 586
20 to 49: 497
50 or more: 358
Mobile homes: 3,131
Median worth of mobile homes: $32,274
Housing units lacking complete plumbing facilities: 0.9%
Housing units lacking complete kitchen facilities: 1.1%