West Valley, CA (California) Houses and Residents
| West Valley: | $611,775 |
| California: | $715,900 |
Total population: 29,595 (Urban population: 14,902 (4,890 inside urbanized areas, 10,012 inside urban clusters), Rural population: 7,506 (647 farm, 6,859 nonfarm))
Houses: 8,025 (7,606 occupied: 5,875 owner occupied, 1,731 renter occupied)
| % of renters here: | 23% |
| State: | 44% |
Housing density: 38 houses/condos per square mile
Median price asked for vacant for-sale houses and condos in 2022 in this county: $594,880.
Median contract rent in 2022: $1,513 (lower quartile is $1,005, upper quartile is over $2,000)
Median rent asked for vacant for-rent units in 2022: $1,323
Median gross rent in West Valley, CA in 2022: $1,635
Housing units in West Valley with a mortgage: 3,857 (690 second mortgage, 301 home equity loan, 0 both second mortgage and home equity loan)
Houses without a mortgage: 828
Compare current foreclosures near West Valley, CA:
| Photo | Address | Area | Beds / Baths | Price | Details |
|---|---|---|---|---|---|

|
#1
Main Ave
Orangevale, CA 95662
|
1,160 sq. feet
|
2 baths 3 beds |
$499,900
|
show details |

|
#2
Wild Canary Rd
Grass Valley, CA 95949
|
1,120 sq. feet
|
1 baths 3 beds |
$320,000
|
show details |

|
#3
Peppermill Ct Apt 3
Sacramento, CA 95841
|
1,105 sq. feet
|
2 baths 3 beds |
show details | |

|
#4
Westchester Way
Citrus Heights, CA 95621
|
1,464 sq. feet
|
2 baths 4 beds |
show details | |

|
#5
Arlene Dr
Roseville, CA 95678
|
1,061 sq. feet
|
1 baths 2 beds |
show details | |

|
#6
Campus Pkwy
Roseville, CA 95747
|
2,617 sq. feet
|
3 baths 5 beds |
show details | |

|
#7
N Haven Dr
North Highlands, CA 95660
|
1,001 sq. feet
|
1 baths 3 beds |
show details | |

|
#8
Walerga Rd Apt 3
Sacramento, CA 95842
|
840 sq. feet
|
1 baths 2 beds |
show details | |

|
#9
Stephen Dr
North Highlands, CA 95660
|
1,143 sq. feet
|
2 baths 4 beds |
show details | |

|
#10
Deanna Ave
Orangevale, CA 95662
|
1,271 sq. feet
|
2 baths 3 beds |
show details |
| Photo | Address | Area | Beds / Baths | Price | Details |
|---|---|---|---|---|---|

|
#11
El Sol Way
Citrus Heights, CA 95621
|
1,235 sq. feet
|
2 baths 3 beds |
show details | |

|
#12
Brett Dr
Sacramento, CA 95842
|
1,269 sq. feet
|
2 baths 3 beds |
show details | |

|
#13
Crestfield Cir
Roseville, CA 95678
|
1,388 sq. feet
|
2 baths 3 beds |
show details | |

|
#14
Arlingdale Cir
Rio Linda, CA 95673
|
1,475 sq. feet
|
2 baths 4 beds |
show details | |

|
#15
Larry Way
North Highlands, CA 95660
|
1,267 sq. feet
|
2 baths 5 beds |
show details | |

|
#16
Dewey Dr
Fair Oaks, CA 95628
|
1,849 sq. feet
|
2 baths 3 beds |
show details | |

|
#17
Calistoga Way
Sacramento, CA 95841
|
1,200 sq. feet
|
2 baths 3 beds |
show details | |

|
#18
Steven Ave
Orangevale, CA 95662
|
2,011 sq. feet
|
3 baths 4 beds |
show details | |

|
#19
Broken Top Ct
Folsom, CA 95630
|
4,963 sq. feet
|
4 baths 4 beds |
show details | |

|
#20
Alta Lorraine Way
North Highlands, CA 95660
|
1,288 sq. feet
|
2 baths 4 beds |
show details |
| Photo | Address | Area | Beds / Baths | Price | Details |
|---|---|---|---|---|---|

|
#21
Vista Dr
Olivehurst, CA 95961
|
1,825 sq. feet
|
2 baths 4 beds |
show details | |

|
#22
Sierravale Way
Citrus Heights, CA 95621
|
1,497 sq. feet
|
2 baths 3 beds |
show details | |

|
#23
Jack London Ct
Roseville, CA 95747
|
2,015 sq. feet
|
3 baths 4 beds |
show details | |

|
#24
Foxfire Dr
Orangevale, CA 95662
|
1,536 sq. feet
|
2 baths 4 beds |
show details | |

|
#25
Van Maren Ln
Citrus Heights, CA 95621
|
1,682 sq. feet
|
2 baths 4 beds |
show details | |

|
#26
Centurion Cir
Citrus Heights, CA 95621
|
1,958 sq. feet
|
2 baths 4 beds |
show details | |

|
#27
Via Casitas
Carmichael, CA 95608
|
1,380 sq. feet
|
2 baths 3 beds |
show details | |

|
#28
Fenton Way
Granite Bay, CA 95746
|
3,957 sq. feet
|
3 baths 5 beds |
show details | |

|
#29
Midas Ave
Rocklin, CA 95677
|
2,519 sq. feet
|
2 baths 3 beds |
show details | |

|
#30
Donlyn Pl
Antelope, CA 95843
|
1,734 sq. feet
|
2 baths 4 beds |
show details |
| Photo | Address | Area | Beds / Baths | Price | Details |
|---|---|---|---|---|---|

|
#31
Summit St
Auburn, CA 95603
|
532 sq. feet
|
1 baths 1 beds |
show details | |

|
#32
Markley Way
Carmichael, CA 95608
|
1,082 sq. feet
|
1 baths 3 beds |
show details | |

|
#33
Fortuna Way
Orangevale, CA 95662
|
1,029 sq. feet
|
1 baths 3 beds |
show details | |

|
#34
Rosario Blvd
North Highlands, CA 95660
|
1,061 sq. feet
|
2 baths 4 beds |
show details | |

|
#35
Ahrentzen Ct
Citrus Heights, CA 95610
|
1,408 sq. feet
|
2 baths 3 beds |
show details | |

|
#36
Shade Tree Way
Antelope, CA 95843
|
1,595 sq. feet
|
2 baths 3 beds |
show details | |

|
#37
Grand View Ct
Rocklin, CA 95765
|
1,900 sq. feet
|
3 baths 3 beds |
show details | |

|
#38
Cougar Hills Way
Antelope, CA 95843
|
1,468 sq. feet
|
2 baths 3 beds |
show details | |

|
#39
Mystic Way
Roseville, CA 95747
|
2,639 sq. feet
|
3 baths 5 beds |
show details | |

|
#40
San Marcos Way
North Highlands, CA 95660
|
980 sq. feet
|
1 baths 3 beds |
show details |
| Photo | Address | Area | Beds / Baths | Price | Details |
|---|---|---|---|---|---|

|
#41
Greenback Ln
Citrus Heights, CA 95621
|
1,323 sq. feet
|
1 baths 3 beds |
show details | |

|
#42
Tahama St
Sacramento, CA 95841
|
1,020 sq. feet
|
2 baths 3 beds |
show details | |

|
#43
Greenholme Dr Apt 1
Sacramento, CA 95842
|
795 sq. feet
|
1 baths 2 beds |
show details | |

|
#44
Old Orchard Way
Orangevale, CA 95662
|
2,078 sq. feet
|
2 baths 4 beds |
show details | |

|
#45
Greenholme Dr Apt 3
Sacramento, CA 95842
|
840 sq. feet
|
1 baths 2 beds |
show details | |

|
#46
Fairbairn Dr
North Highlands, CA 95660
|
1,216 sq. feet
|
1 baths 3 beds |
show details | |

|
#47
Revelstok Dr
Sacramento, CA 95842
|
1,269 sq. feet
|
2 baths 3 beds |
show details | |

|
#48
Fairbairn Dr
North Highlands, CA 95660
|
1,223 sq. feet
|
1 baths 2 beds |
show details | |

|
#49
Spicer Dr
Fair Oaks, CA 95628
|
1,494 sq. feet
|
1 baths 4 beds |
show details | |

|
Check over 1 million property listings on Foreclosure.com!
|
browse all offers | |||

Household type by relationship:
Households: 344,625- In family households: 294,327 (69,618 male householders, 23,918 female householders)
75,509 spouses, 101,961 children (94,970 natural, 2,425 adopted, 4,566 stepchildren), 4,913 grandchildren, 2,541 brothers or sisters, 3,123 parents, foster children, 3,121 other relatives, 7,227 non-relatives
- In nonfamily households: 50,298 (17,002 male householders (12,149 living alone)), 22,089 female householders (18,347 living alone)), 11,207 nonrelatives
- In group quarters: 3,807 (1,717 institutionalized population)
48,873 married couples with children.
12,146 single-parent households (3,480 men, 8,666 women).
84.6% of residents of West Valley speak English at home.
11.9% of residents speak Spanish at home (52% speak English very well, 24% speak English well, 18% speak English not well, 6% don't speak English at all).
2.4% of residents speak other Indo-European language at home (73% speak English very well, 22% speak English well, 3% speak English not well, 1% don't speak English at all).
1.1% of residents speak Asian or Pacific Island language at home (65% speak English very well, 30% speak English well, 5% don't speak English at all).
0.1% of residents speak other language at home (73% speak English very well, 27% speak English well).
Foreign born population: 5,776 (15.3%)
(62.3% of them are naturalized citizens)
| Here: | 6.7 |
| State: | 6.0 |
| Here: | 4.3 |
| State: | 3.9 |

- Bedrooms in owner-occupied houses and condos in West Valley, California
- 30no bedroom
- 2521 bedroom
- 1,0052 bedrooms
- 2,8413 bedrooms
- 1,4014 bedrooms
- 3465+ bedrooms

- Bedrooms in renter-occupied apartments in West Valley, California
- 51no bedroom
- 3221 bedroom
- 6792 bedrooms
- 5323 bedrooms
- 1204 bedrooms
- 275+ bedrooms

- Cars and other vehicles available in West Valley in owner-occupied houses/condos
- 241no vehicle
- 1,0711 vehicle
- 2,7462 vehicles
- 1,3133 vehicles
- 3574 vehicles
- 1475+ vehicles

- Cars and other vehicles available in West Valley in renter-occupied apartments
- 224no vehicle
- 6721 vehicle
- 6232 vehicles
- 1393 vehicles
- 424 vehicles
- 315+ vehicles

- Rooms in owner-occupied houses in West Valley, California
- 151 room
- 532 rooms
- 3173 rooms
- 4344 rooms
- 1,4075 rooms
- 1,4766 rooms
- 9897 rooms
- 6158 rooms
- 5699+ rooms

- Rooms in renter-occupied apartments in West Valley, California
- 381 room
- 1682 rooms
- 2273 rooms
- 4764 rooms
- 4025 rooms
- 2406 rooms
- 1137 rooms
- 498 rooms
- 189+ rooms


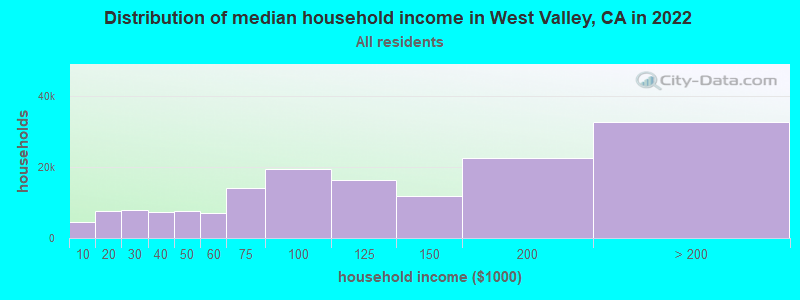
West Valley, CA household income distribution

- 4,589Less than $10,000
- 7,560$10,000 to $19,999
- 7,797$20,000 to $29,999
- 7,259$30,000 to $39,999
- 7,530$40,000 to $49,999
- 6,919$50,000 to $59,999
- 13,908$60,000 to $74,999
- 19,516$75,000 to $99,999
- 16,160$100,000 to $124,999
- 11,819$125,000 to $149,999
- 22,483$150,000 to $199,999
- 32,580$200,000 or more
Percentage of workers working in this county: 71.4%
Number of people working at home: 3,835 (22.2% of all workers)
Travel time to work (commute)
- Less than 5 minutes: 282
- 5 to 9 minutes: 811
- 10 to 14 minutes: 1,074
- 15 to 19 minutes: 1,066
- 20 to 24 minutes: 1,228
- 25 to 29 minutes: 540
- 30 to 34 minutes: 1,223
- 35 to 39 minutes: 434
- 40 to 44 minutes: 691
- 45 to 59 minutes: 1,154
- 60 to 89 minutes: 605
- 90 or more minutes: 347
Means of transportation to work:
- Drove a car alone: 7,789 (76.4%)
- Carpooled: 1,248 (12.2%)
- Bus or trolley bus: 11 (0.1%)
- Motorcycle: 91 (0.9%)
- Bicycle: 17 (0.2%)
- Walked: 239 (2.3%)
- Other means: 60 (0.6%)
- Worked at home: 741 (7.3%)


- Year of entry for the foreign-born population in West Valley, California
- 3001995 to March 2000
- 1631990 to 1994
- 3391985 to 1989
- 1941980 to 1984
- 2381975 to 1979
- 2751970 to 1974
- 1131965 to 1969
- 390Before 1965
Most common places of birth for foreign-born residents (%):
| West Valley: | 58.9% (1,186) |
| California: | 44.3% (3,928,701) |
| West Valley: | 6.7% (134) |
| California: | 1.6% (141,181) |
| West Valley: | 4.9% (98) |
| California: | 1.1% (98,160) |
| West Valley: | 4.3% (86) |
| California: | 7.5% (664,935) |
| West Valley: | 2.2% (45) |
| California: | 0.4% (32,049) |
| West Valley: | 2.0% (40) |
| California: | 0.4% (32,315) |
| West Valley: | 1.9% (39) |
| California: | 1.5% (133,090) |
| West Valley: | 1.7% (35) |
| California: | 0.7% (62,114) |
| West Valley: | 1.7% (34) |
| California: | 0.4% (38,450) |
Place of birth for U.S.-born residents:
- This state: 14,053
- Other state: 6,158
- Northeast: 997
- Midwest: 1,785
- South: 1,452
- West: 1,924
45% of West Valley residents lived in the same house 5 years ago.
Out of people who lived in different houses, 40% lived in this county.
Out of people who lived in different counties, 75% lived in California.
Education attainment for males 25 years and older:
- No schooling: 67
- Nursery to 4th grade: 64
- 5th and 6th grade: 162
- 7th and 8th grade: 109
- 9th grade: 92
- 10th grade: 141
- 11th grade: 209
- 12th grade, no diploma: 197
- High school graduate (or equivalency): 1,747
- Less than 1 year of college: 665
- Some college more than 1 year, no degree: 1,376
- Associate degree: 472
- Bachelor's degree: 1,095
- Master's degree: 380
- Professional school degree: 69
- Doctorate degree: 13

Education attainment for females 25 years and older:
- No schooling: 83
- Nursery to 4th grade: 47
- 5th and 6th grade: 150
- 7th and 8th grade: 187
- 9th grade: 107
- 10th grade: 114
- 11th grade: 164
- 12th grade, no diploma: 126
- High school graduate (or equivalency): 1,831
- Less than 1 year of college: 1,018
- Some college more than 1 year, no degree: 1,488
- Associate degree: 753
- Bachelor's degree: 935
- Master's degree: 245
- Professional school degree: 56
- Doctorate degree: 14


Housing units in structures:
- One, detached: 6,569
- One, attached: 221
- Two: 75
- 3 or 4: 105
- 5 to 9: 185
- 10 to 19: 58
- 20 to 49: 73
- 50 or more: 279
- Mobile homes: 444
- Boats, RVs, vans, etc.: 16
Median worth of mobile homes: $344,691
Housing units lacking complete kitchen facilities: 0.3%

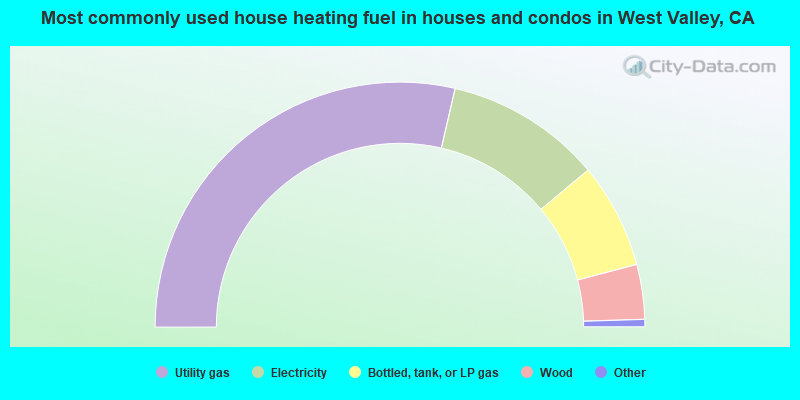
- 57.2%Utility gas
- 20.6%Electricity
- 13.9%Bottled, tank, or LP gas
- 7.2%Wood
- 0.5%Other fuel
- 0.5%Fuel oil, kerosene, etc.
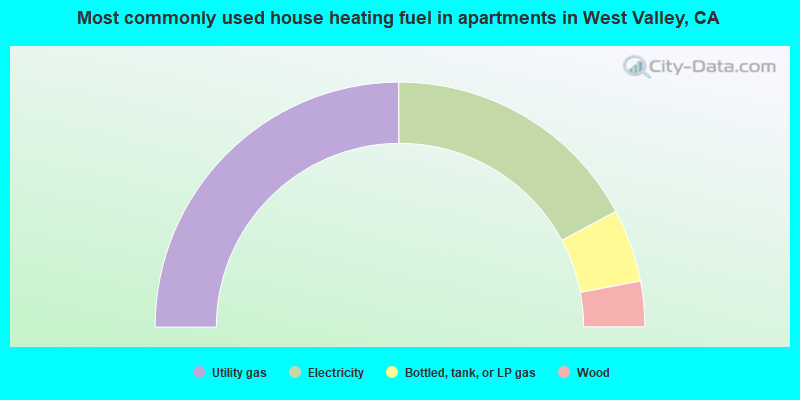
- 49.8%Utility gas
- 34.5%Electricity
- 9.6%Bottled, tank, or LP gas
- 6.0%Wood
Private vs. public school enrollment:
| Here: | 8.6% |
| California: | 9.9% |
| Here: | 5.7% |
| California: | 7.8% |
| Here: | 11.6% |
| California: | 15.4% |


