West Palm Beach, FL (Florida) Houses and Residents
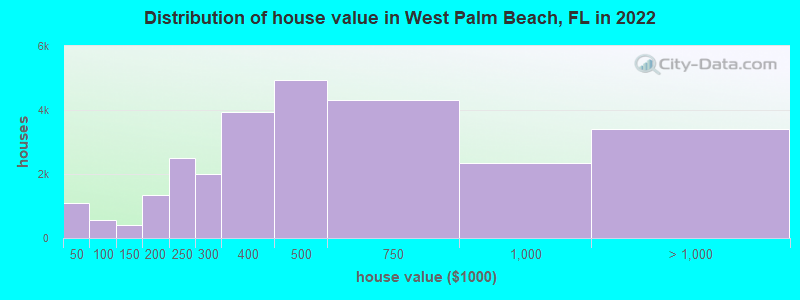
Estimated median house or condo value in 2022: $436,600 (it was $91,500 in 2000 )
West Palm Beach:
$436,600Florida:
$354,100
Lower value quartile - upper value quartile: $279,000 - $701,300Mean price in 2022: Detached houses: $540,295 Here:
$540,295State:
$500,941
Townhouses or other attached units: $324,143 Here:
$324,143State:
$370,869
In 2-unit structures: $354,093 Here:
$354,093State:
$423,188
In 3-to-4-unit structures: $224,695 Here:
$224,695State:
$309,944
In 5-or-more-unit structures: $389,992 Here:
$389,992State:
$447,145
Mobile homes: $198,642 Here:
$198,642State:
$113,202
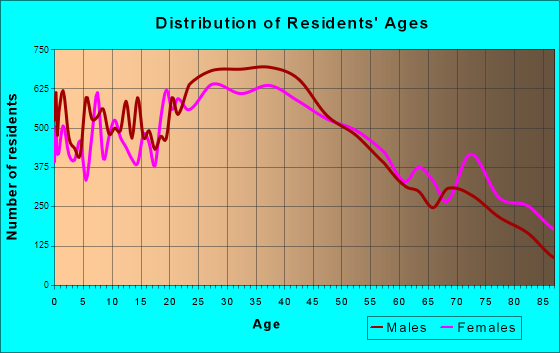
Total population: 104,031 (Urban population: 79,569, Rural population: 1,970 (all nonfarm) )
Houses: 61,130 (51,208 occupied: 26,371 owner occupied, 24,837 renter occupied )
% of renters here:
49%State:
33%
Housing density: 1,109 houses/condos per square mile
Median price asked for vacant for-sale houses and condos in 2022: $635,610.
Median contract rent in 2022: $1,483 (lower quartile is $1,051, upper quartile is $1,969)
Median rent asked for vacant for-rent units in 2022: $1,614
Median gross rent in West Palm Beach, FL in 2022: $1,599
Housing units in West Palm Beach with a mortgage: 15,325 (738 second mortgage, 0 home equity loan, 648 both second mortgage and home equity loan )Houses without a mortgage: 208
Median household income for houses/condos with a mortgage: $97,388
Median household income for apartments without a mortgage: $68,186
Median monthly housing costs: $1,599
Data:
Median house or condo value ($)
Median house or condo value ($ change since 2000)
Median house or condo value ($) - White
Median house or condo value ($) - Black or African American
Median house or condo value ($) - Asian
Median house or condo value ($) - Hispanic or Latino
Median house or condo value ($) - American Indian and Alaska Native
Median house or condo value ($) - Multirace
Median house or condo value ($) - Other Race
Median price asked for mobile homes ($)
Household density (households per square mile)
Mean house or condo value by units in structure - 1, detached ($)
Mean house or condo value by units in structure - 1, attached ($)
Mean house or condo value by units in structure - 2 ($)
Mean house or condo value by units in structure by units in structure - 3 or 4 ($)
Mean house or condo value by units in structure - 5 or more ($)
Mean house or condo value by units in structure - Boat, RV, van, etc. ($)
Mean house or condo value by units in structure - Mobile home ($)
Median contract rent ($)
Median contract rent - Lower quartile ($)
Median contract rent - Upper quartile ($)
Median gross rent ($)
Urban houses (%)
Rural houses (%)
Houses occupied (%)
Houses occupied (% change since 2000)
Houses owner occupied (%)
Houses owner occupied (% change since 2000)
Houses renter occupied (%)
Houses renter occupied (% change since 2000)
Vacant housing units - For rent (%)
Vacant housing units - For rent (% change since 2000)
Vacant housing units - For sale only (%)
Vacant housing units - For sale only (% change since 2000)
Vacant housing units - Rented or sold, not occupied (%)
Vacant housing units - Rented or sold, not occupied (% change since 2000)
Vacant housing units - For seasonal, recreational, or occasional use (%)
Vacant housing units - For seasonal, recreational, or occasional use (% change since 2000)
Vacant housing units - For migrant workers (%)
Vacant housing units - For migrant workers (% change since 2000)
Vacant housing units - Other vacant (%)
Vacant housing units - Other vacant (% change since 2000)
Median monthly housing costs ($)
Median household income for houses/condos with a mortgage ($)
Median household income for houses/condos without a mortgage ($)
Median household income ($)
Median household income ($) - White
Median household income ($) - Black or African American
Median household income ($) - Asian
Median household income ($) - Hispanic or Latino
Median household income ($) - American Indian and Alaska Native
Median household income ($) - Multirace
Median household income ($) - Other Race
Mortgage status - with mortgage (%)
Mortgage status - with second mortgage (%)
Mortgage status - with home equity loan (%)
Mortgage status - with both second mortgage and home equity loan (%)
Mortgage status - without a mortgage (%)
Median year house/condo built
Median year apartment built
Household type by relationship - Male householder living alone (%)
Household type by relationship - Male householder not living alone (%)
Household type by relationship - Female householder living alone (%)
Household type by relationship - Female householder not living alone (%)
Household type by relationship - Opposite-Sex spouse (%)
Household type by relationship - Same-Sex spouse (%)
Household type by relationship - Opposite-Sex unmarried partner (%)
Household type by relationship - Same-Sex unmarried partner (%)
Household type by relationship - In group quarters (%)
Size of family households - 2-person household (%)
Size of family households - 3-person household (%)
Size of family households - 4-person household (%)
Size of family households - 5-person household (%)
Size of family households - 6-person household (%)
Size of family households - 7-or-more-person household (%)
Size of nonfamily households - 1-person household (%)
Size of nonfamily households - 2-person household (%)
Size of nonfamily households - 3-person household (%)
Size of nonfamily households - 4-person household (%)
Size of nonfamily households - 5-person household (%)
Size of nonfamily households - 6-person household (%)
Size of nonfamily households - 7-or-moreperson household (%)
Year house built - Built 2010 or later (%)
Year house built - Built 2000 to 2009 (%)
Year house built - Built 1990 to 1999 (%)
Year house built - Built 1980 to 1989 (%)
Year house built - Built 1970 to 1979 (%)
Year house built - Built 1960 to 1969 (%)
Year house built - Built 1950 to 1959 (%)
Year house built - Built 1940 to 1949 (%)
Year house built - Built 1939 or earlier (%)
Median number of rooms in houses and condos
Median number of rooms in apartments
Median number of bedrooms in owner occupied houses
Mean number of bedrooms in owner occupied houses
Median number of bedrooms in renter occupied houses
Mean number of bedrooms in renter occupied houses
Median number of vehichles in owner occupied houses
Mean number of vehichles in owner occupied houses
Median number of vehichles in renter occupied houses
Mean number of vehichles in renter occupied houses
Rooms in owner-occupied houses - 1 room (%)
Rooms in owner-occupied houses - 2 rooms (%)
Rooms in owner-occupied houses - 3 rooms (%)
Rooms in owner-occupied houses - 4 rooms (%)
Rooms in owner-occupied houses - 5 rooms (%)
Rooms in owner-occupied houses - 6 rooms (%)
Rooms in owner-occupied houses - 7 rooms (%)
Rooms in owner-occupied houses - 8 rooms (%)
Rooms in owner-occupied houses - 9+ rooms (%)
Rooms in renter-occupied houses - 1 room (%)
Rooms in renter-occupied houses - 2 rooms (%)
Rooms in renter-occupied houses - 3 rooms (%)
Rooms in renter-occupied houses - 4 rooms (%)
Rooms in renter-occupied houses - 5 rooms (%)
Rooms in renter-occupied houses - 6 rooms (%)
Rooms in renter-occupied houses - 7 rooms (%)
Rooms in renter-occupied houses - 8 rooms (%)
Rooms in renter-occupied houses - 9+ rooms (%)
Bedrooms in owner-occupied houses - no bedrooms (%)
Bedrooms in owner-occupied houses - 1 bedroom (%)
Bedrooms in owner-occupied houses - 2 bedrooms (%)
Bedrooms in owner-occupied houses - 3 bedrooms (%)
Bedrooms in owner-occupied houses - 4 bedrooms (%)
Bedrooms in owner-occupied houses - 5+ bedrooms (%)
Bedrooms in renter-occupied houses - no bedrooms (%)
Bedrooms in renter-occupied houses - 1 bedroom (%)
Bedrooms in renter-occupied houses - 2 bedrooms (%)
Bedrooms in renter-occupied houses - 3 bedrooms (%)
Bedrooms in renter-occupied houses - 4 bedrooms (%)
Bedrooms in renter-occupied houses - 5+ bedrooms (%)
Vehicles available in owner-occupied houses - no vehicle available (%)
Vehicles available in owner-occupied houses - 1 vehicle available(%)
Vehicles available in owner-occupied houses - 2 Vehicles available (%)
Vehicles available in owner-occupied houses - 3 Vehicles available (%)
Vehicles available in owner-occupied houses - 4 Vehicles available (%)
Vehicles available in owner-occupied houses - 5+ Vehicles available (%)
Vehicles available in renter-occupied houses - no vehicle available (%)
Vehicles available in renter-occupied houses - 1 vehicle available (%)
Vehicles available in renter-occupied houses - 2 Vehicles available (%)
Vehicles available in renter-occupied houses - 3 Vehicles available (%)
Vehicles available in renter-occupied houses - 4 Vehicles available (%)
Vehicles available in renter-occupied houses - 5+ Vehicles available (%)
Housing units in structures - 1, detached (%)
Housing units in structures - 1, attached (%)
Housing units in structures - 2 (%)
Housing units in structures - 3 or 4 (%)
Housing units in structures - 5 to 9 (%)
Housing units in structures - 10 to 19 (%)
Housing units in structures - 20 to 49 (%)
Housing units in structures - 50 or more (%)
Housing units in structures - Mobile home (%)
Housing units in structures - Boat, RV, van, etc. (%)
Housing units in structures - Owners - 1, detached (%)
Housing units in structures - Owners - 1, attached (%)
Housing units in structures - Owners - 2 (%)
Housing units in structures - Owners - 3 or 4 (%)
Housing units in structures - Owners - 5 to 9 (%)
Housing units in structures - Owners - 10 to 19 (%)
Housing units in structures - Owners - 20 to 49 (%)
Housing units in structures - Owners - 50 or more (%)
Housing units in structures - Owners - Mobile home (%)
Housing units in structures - Owners - Boat, RV, van, etc. (%)
Housing units in structures - Renters - 1, detached (%)
Housing units in structures - Renters - 1, attached (%)
Housing units in structures - Renters - 2 (%)
Housing units in structures - Renters - 3 or 4 (%)
Housing units in structures - Renters - 5 to 9 (%)
Housing units in structures - Renters - 10 to 19 (%)
Housing units in structures - Renters - 20 to 49 (%)
Housing units in structures - Renters - 50 or more (%)
Housing units in structures - Renters - Mobile home (%)
Housing units in structures - Renters - Boat, RV, van, etc. (%)
House/condo owner moved in on average (years ago)
Renter moved in on average (years ago)
Year householder moved into unit - Moved in 1999 to March 2000 (%)
Year householder moved into unit - Moved in 1999 to March 2000 (%) - White
Year householder moved into unit - Moved in 1999 to March 2000 (%) - Black or African American
Year householder moved into unit - Moved in 1999 to March 2000 (%) - Asian
Year householder moved into unit - Moved in 1999 to March 2000 (%) - Hispanic or Latino
Year householder moved into unit - Moved in 1999 to March 2000 (%) - American Indian and Alaska Native
Year householder moved into unit - Moved in 1999 to March 2000 (%) - Multirace
Year householder moved into unit - Moved in 1999 to March 2000 (%) - Other Race
Year householder moved into unit - Moved in 1995 to 1998 (%)
Year householder moved into unit - Moved in 1995 to 1998 (%) - White
Year householder moved into unit - Moved in 1995 to 1998 (%) - Black or African American
Year householder moved into unit - Moved in 1995 to 1998 (%) - Asian
Year householder moved into unit - Moved in 1995 to 1998 (%) - Hispanic or Latino
Year householder moved into unit - Moved in 1995 to 1998 (%) - American Indian and Alaska Native
Year householder moved into unit - Moved in 1995 to 1998 (%) - Multirace
Year householder moved into unit - Moved in 1995 to 1998 (%) - Other Race
Year householder moved into unit - Moved in 1990 to 1994 (%)
Year householder moved into unit - Moved in 1990 to 1994 (%) - White
Year householder moved into unit - Moved in 1990 to 1994 (%) - Black or African American
Year householder moved into unit - Moved in 1990 to 1994 (%) - Asian
Year householder moved into unit - Moved in 1990 to 1994 (%) - Hispanic or Latino
Year householder moved into unit - Moved in 1990 to 1994 (%) - American Indian and Alaska Native
Year householder moved into unit - Moved in 1990 to 1994 (%) - Multirace
Year householder moved into unit - Moved in 1990 to 1994 (%) - Other Race
Year householder moved into unit - Moved in 1980 to 1989 (%)
Year householder moved into unit - Moved in 1980 to 1989 (%) - White
Year householder moved into unit - Moved in 1980 to 1989 (%) - Black or African American
Year householder moved into unit - Moved in 1980 to 1989 (%) - Asian
Year householder moved into unit - Moved in 1980 to 1989 (%) - Hispanic or Latino
Year householder moved into unit - Moved in 1980 to 1989 (%) - American Indian and Alaska Native
Year householder moved into unit - Moved in 1980 to 1989 (%) - Multirace
Year householder moved into unit - Moved in 1980 to 1989 (%) - Other Race
Year householder moved into unit - Moved in 1970 to 1979 (%)
Year householder moved into unit - Moved in 1970 to 1979 (%) - White
Year householder moved into unit - Moved in 1970 to 1979 (%) - Black or African American
Year householder moved into unit - Moved in 1970 to 1979 (%) - Asian
Year householder moved into unit - Moved in 1970 to 1979 (%) - Hispanic or Latino
Year householder moved into unit - Moved in 1970 to 1979 (%) - American Indian and Alaska Native
Year householder moved into unit - Moved in 1970 to 1979 (%) - Multirace
Year householder moved into unit - Moved in 1970 to 1979 (%) - Other Race
Year householder moved into unit - Moved in 1969 or earlier (%)
Year householder moved into unit - Moved in 1969 or earlier (%) - White
Year householder moved into unit - Moved in 1969 or earlier (%) - Black or African American
Year householder moved into unit - Moved in 1969 or earlier (%) - Asian
Year householder moved into unit - Moved in 1969 or earlier (%) - Hispanic or Latino
Year householder moved into unit - Moved in 1969 or earlier (%) - American Indian and Alaska Native
Year householder moved into unit - Moved in 1969 or earlier (%) - Multirace
Year householder moved into unit - Moved in 1969 or earlier (%) - Other Race
Housing units lacking complete plumbing facilities (%)
Housing units lacking complete kitchen facilities (%)
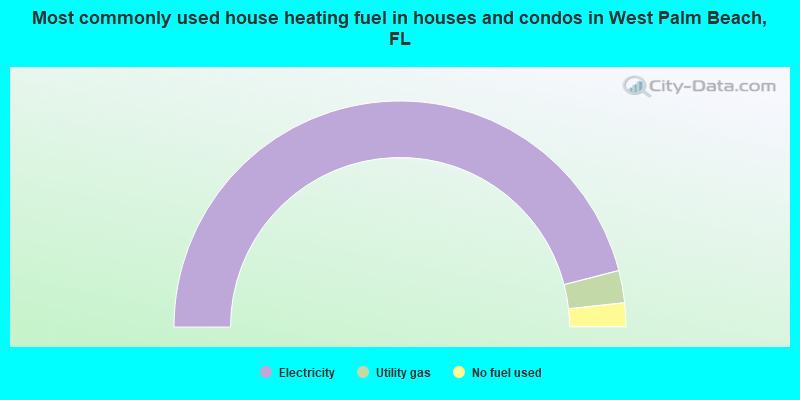
House heating fuel used in houses and condos - Utility gas (%)
House heating fuel used in houses and condos - Bottled, tank, or LP gas (%)
House heating fuel used in houses and condos - Electricity (%)
House heating fuel used in houses and condos - Fuel oil, kerosene, etc. (%)
House heating fuel used in houses and condos - Coal or coke (%)
House heating fuel used in houses and condos - Wood (%)
House heating fuel used in houses and condos - Solar energy (%)
House heating fuel used in houses and condos - Other fuel (%)
House heating fuel used in houses and condos - No fuel used (%)
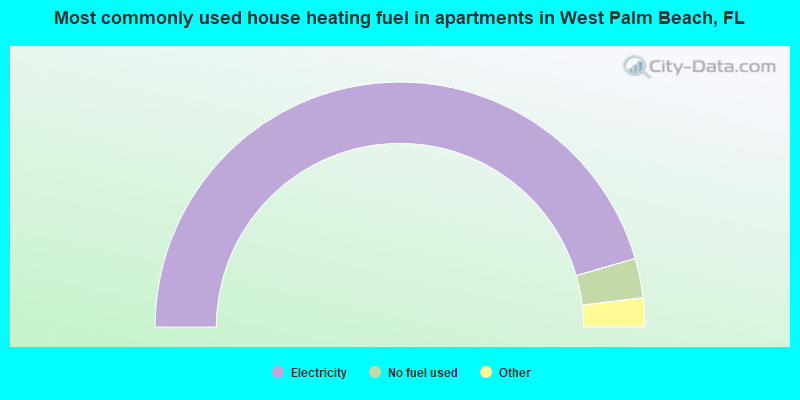
House heating fuel used in apartments - Utility gas (%)
House heating fuel used in apartments - Bottled, tank, or LP gas (%)
House heating fuel used in apartments - Electricity (%)
House heating fuel used in apartments - Fuel oil, kerosene, etc. (%)
House heating fuel used in apartments - Coal or coke (%)
House heating fuel used in apartments - Wood (%)
House heating fuel used in apartments - Solar energy (%)
House heating fuel used in apartments - Other fuel (%)
House heating fuel used in apartments - No fuel used (%)
Median year house/condo built: 1987Median year apartment built: 1988Household type by relationship:
Households: 120,922
Male householders: 23,987 (8,371 living alone ), Female householders: 27,221 (10,748 living alone )18,229 spouses (18,107 opposite-sex spouses ), 5,695 unmarried partners , (5,402 opposite-sex unmarried partners ), 30,005 children (27,944 natural , 424 adopted , 1,637 stepchildren ), 2,978 grandchildren , 2,040 brothers or sisters , 2,237 parents , 0 foster children , 2,000 other relatives , 3,080 non-relatives In group quarters: 3,450
Size of family households: 13,188 2-persons , 5,958 3-persons , 5,081 4-persons , 2,803 5-persons , 621 6-persons , 370 7-or-more-persons .
Size of nonfamily households: 19,119 1-person , 4,068 2-persons .
9,310 married couples with children. single-parent households (2,939 men , 6,288 women ).
67.3% of residents of West Palm Beach speak English at home. of residents speak Spanish at home (47% speak English very well , 22% speak English well , 17% speak English not well , 15% don't speak English at all ).of residents speak other Indo-European language at home (69% speak English very well , 20% speak English well , 10% speak English not well , 2% don't speak English at all ).of residents speak Asian or Pacific Island language at home (59% speak English very well , 26% speak English well , 13% speak English not well , 2% don't speak English at all ).of residents speak other language at home (58% speak English very well , 27% speak English well , 16% speak English not well ).
Foreign born population: 33,725 (27.9%)of them are naturalized citizens )
Median number of rooms in houses and condos:
Median number of rooms in apartments
Owner-occupied Renter-occupied
Bedrooms in owner-occupied houses and condos in West Palm Beach, Florida
0 no bedroom 1,327 1 bedroom 8,871 2 bedrooms 10,810 3 bedrooms 4,969 4 bedrooms 394 5+ bedrooms
Bedrooms in renter-occupied apartments in West Palm Beach, Florida
2,701 no bedroom 6,524 1 bedroom 11,265 2 bedrooms 4,175 3 bedrooms 113 4 bedrooms 59 5+ bedrooms
Owner-occupied Renter-occupied
Rooms in owner-occupied houses in West Palm Beach, Florida
0 1 room 505 2 rooms 1,824 3 rooms 4,759 4 rooms 4,303 5 rooms 6,186 6 rooms 3,985 7 rooms 2,155 8 rooms 2,654 9+ rooms
Rooms in renter-occupied apartments in West Palm Beach, Florida
2,636 1 room 2,134 2 rooms 5,188 3 rooms 7,687 4 rooms 3,220 5 rooms 2,984 6 rooms 276 7 rooms 653 8 rooms 59 9+ rooms
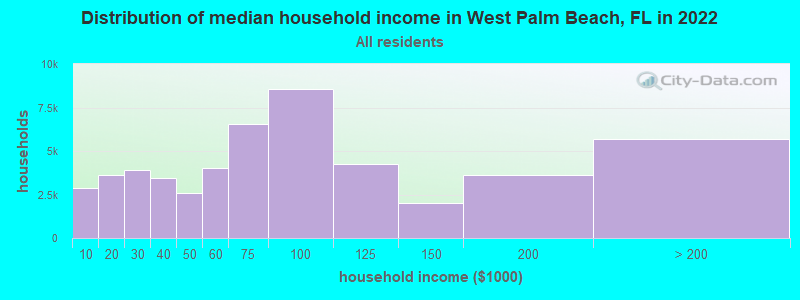
West Palm Beach, FL household income distribution 2,870 Less than $10,0003,637 $10,000 to $19,9993,935 $20,000 to $29,9993,440 $30,000 to $39,9992,578 $40,000 to $49,9994,035 $50,000 to $59,9996,551 $60,000 to $74,9998,556 $75,000 to $99,9994,263 $100,000 to $124,9992,009 $125,000 to $149,9993,635 $150,000 to $199,9995,699 $200,000 or more
Home value of owner - occupied houses in 2022 in West Palm Beach, FL 426 Less than $10,00098 $10,000 to $14,99950 $20,000 to $24,99996 $25,000 to $29,999424 $40,000 to $49,99933 $50,000 to $59,99990 $90,000 to $99,999338 $100,000 to $124,99957 $125,000 to $149,999402 $150,000 to $174,999929 $175,000 to $199,9992,495 $200,000 to $249,9991,994 $250,000 to $299,9993,948 $300,000 to $399,9994,927 $400,000 to $499,9994,310 $500,000 to $749,9992,346 $750,000 to $999,9991,303 $1,000,000 to $1,499,999740 $1,500,000 to $1,999,9991,365 $2,000,000 or moreRent paid by renters in 2022 in West Palm Beach, FL 174 Less than $100140 $100 to $149309 $150 to $199550 $200 to $249134 $250 to $29978 $300 to $34955 $350 to $399287 $400 to $449112 $450 to $49987 $500 to $54952 $550 to $599250 $600 to $649170 $650 to $699253 $700 to $749549 $750 to $7991,129 $800 to $899960 $900 to $9993,441 $1,000 to $1,2493,653 $1,250 to $1,4996,845 $1,500 to $1,9992,753 $2,000 to $2,4991,390 $2,500 to $2,999140 $3,000 to $3,499636 $3,500 or more557 No cash rent
Percentage of workers working in this county: 93.0%Number of people working at home: 8,553 (14.5% of all workers )
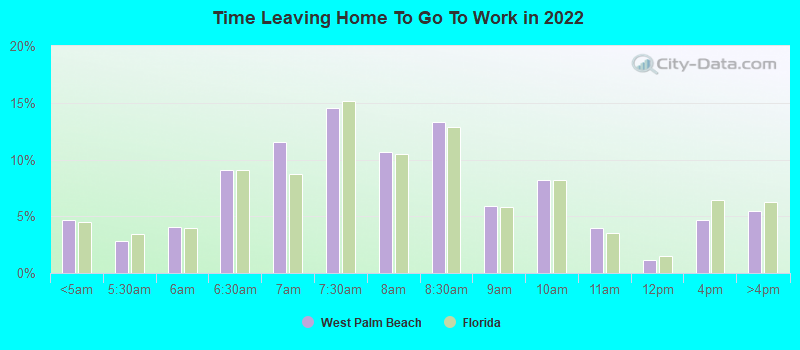
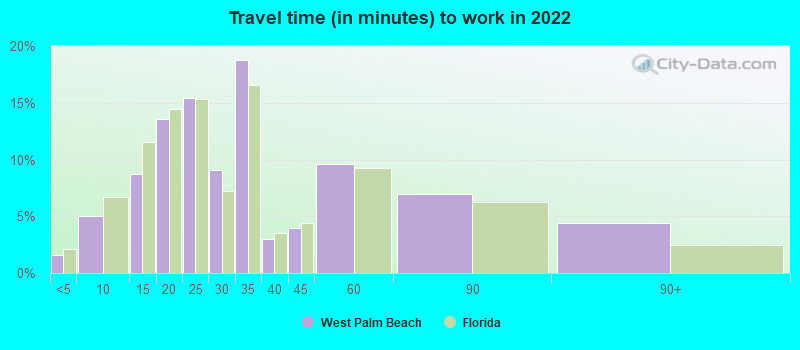
Travel time to work (commute)
Less than 5 minutes: 8605 to 9 minutes: 4,11810 to 14 minutes: 7,72215 to 19 minutes: 8,14420 to 24 minutes: 8,05825 to 29 minutes: 3,02330 to 34 minutes: 8,97435 to 39 minutes: 1,67940 to 44 minutes: 2,23645 to 59 minutes: 3,70960 to 89 minutes: 1,61690 or more minutes: 1,909
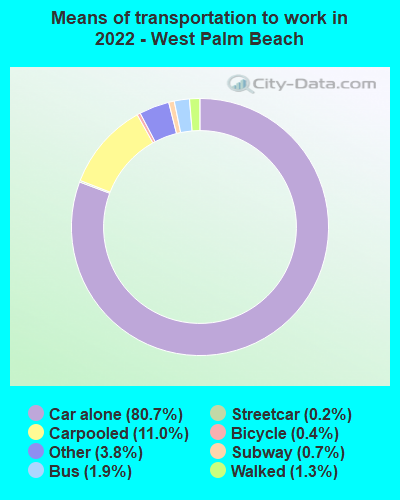
Means of transportation to work:
Drove a car alone: 79,734 (73.5%)Carpooled: 10,834 (10.0%)Bus : 1,911 (1.8%)Subway or elevated rail : 200 (0.2%)Long-distance train or commuter rail : 646 (0.6%)Taxi: 3,718 (3.4%)Bicycle: 421 (0.4%)Walked: 1,319 (1.2%)Worked at home: 9,729 (9.0%)
Unemployment by race in 2022
Unemployment rate for White non-Hispanic residents 4.8% Males3.1% FemalesUnemployment rate for Black residents 1.9% Males8.7% FemalesUnemployment rate for American Indian and Alaska Native residents 21.5% MalesUnemployment rate for Asian residents 4.5% Males6.9% FemalesUnemployment rate for other race residents 14.0% MalesUnemployment rate for two or more race residents 13.3% Males4.2% FemalesUnemployment rate for Hispanic or Latino residents 12.1% Males3.1% Females
Year of entry for the foreign-born population in West Palm Beach, Florida
12,536 2010 or later 7,580 2000 to 2009 5,916 1990 to 1999 5,301 1980 to 1989 2,207 1970 to 1979 3,184 Before 1970
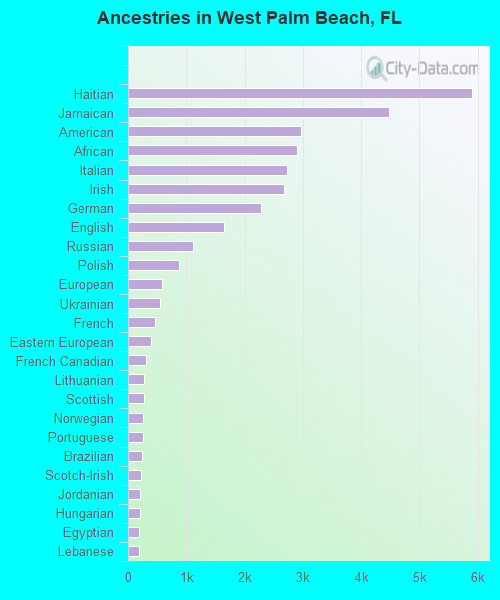
First ancestries reported:
Haitian: 5,898 (8.2%)
Jamaican: 4,476 (6.2%)
American: 2,972 (4.1%)
African: 2,899 (4.0%)
Italian: 2,728 (3.8%)
Irish: 2,672 (3.7%)
German: 2,277 (3.2%)
English: 1,650 (2.3%)
Russian: 1,115 (1.5%)
Polish: 870 (1.2%)
European: 575 (0.8%)
Ukrainian: 549 (0.8%)
French: 456 (0.6%)
Eastern European: 389 (0.5%)
French Canadian: 310 (0.4%)
Lithuanian: 276 (0.4%)
Scottish: 268 (0.4%)
Norwegian: 265 (0.4%)
Portuguese: 261 (0.4%)
Brazilian: 248 (0.3%)
Scotch-Irish: 217 (0.3%)
Jordanian: 208 (0.3%)
Hungarian: 199 (0.3%)
Egyptian: 185 (0.3%)
Lebanese: 181 (0.3%)
Austrian: 165 (0.2%)
Canadian: 155 (0.2%)
Dutch: 139 (0.2%)
Ghanaian: 136 (0.2%)
Greek: 132 (0.2%)
Danish: 129 (0.2%)
West Indian: 103 (0.1%)
Barbadian: 102 (0.1%)
British: 101 (0.1%)
Romanian: 94 (0.1%)
Swedish: 82 (0.1%)
Trinidadian and Tobagonian: 82 (0.1%)
Nigerian: 79 (0.1%)
Iranian: 77 (0.1%)
Yugoslavian: 73 (0.1%)
Croatian: 68 (0.09%)
Bahamian: 66 (0.09%)
Latvian: 60 (0.08%)
Bulgarian: 59 (0.08%)
Moroccan: 58 (0.08%)
Albanian: 55 (0.08%)
South African: 53 (0.07%)
Israeli: 52 (0.07%)
Macedonian: 51 (0.07%)
Slovak: 50 (0.07%)
Serbian: 43 (0.06%)
U.S. Virgin Islander: 42 (0.06%)
Welsh: 40 (0.06%)
Czechoslovakian: 40 (0.06%)
Northern European: 37 (0.05%)
Czech: 33 (0.05%)
Guyanese: 31 (0.04%)
Belgian: 28 (0.04%)
British West Indian: 27 (0.04%)
Bermudan: 16 (0.02%)
Finnish: 12 (0.02%)
Turkish: 10 (0.01%)
Belizean: 9 (0.01%)
Slovene: 8 (0.01%)
New Zealander: 8 (0.01%)
Maltese: 6 (0.01%)
Estonian: 6 (0.01%)
Scandinavian: 6 (0.01%)
Armenian: 5 (0.01%)
Arab: 4 (0.01%)
Australian: 4 (0.01%)
Most common places of birth for foreign-born residents (%): Haiti West Palm Beach:
15.5% (5,296)Florida:
7.5% (342,375)
Guatemala West Palm Beach:
15.2% (5,198)Florida:
2.1% (97,632)
Jamaica West Palm Beach:
12.1% (4,126)Florida:
5.0% (227,319)
Cuba West Palm Beach:
10.0% (3,433)Florida:
22.0% (1,006,576)
Colombia West Palm Beach:
3.4% (1,147)Florida:
6.5% (298,669)
Nicaragua West Palm Beach:
3.2% (1,082)Florida:
2.3% (105,066)
Mexico West Palm Beach:
3.1% (1,064)Florida:
5.6% (257,152)
Peru West Palm Beach:
2.5% (863)Florida:
2.1% (96,693)
Dominican Republic West Palm Beach:
1.7% (597)Florida:
3.0% (137,727)
Philippines West Palm Beach:
1.7% (568)Florida:
1.8% (84,403)
Canada West Palm Beach:
1.6% (563)Florida:
2.4% (109,132)
Ukraine West Palm Beach:
1.6% (563)Florida:
0.5% (21,886)
Ecuador West Palm Beach:
1.6% (545)Florida:
1.2% (54,585)
Place of birth for U.S.-born residents:
This state: 45,771Other state: 38,343Northeast: 21,545Midwest: 7,794South: 7,350West: 1,654 85.0% of West Palm Beach residents lived in the same house 1 years ago.
Out of people who lived in different houses, 30.0% lived in this county.
Out of people who lived in different counties, 22.5% lived in Florida.
West Palm Beach:
85.0%State average:
86.3%
Education attainment for males 25 years and older:
No schooling: 1,009Nursery to 4th grade: 3515th and 6th grade: 7467th and 8th grade: 1739th grade: 87510th grade: 56811th grade: 54112th grade, no diploma: 513High school graduate (or equivalency): 10,172Less than 1 year of college: 2,601Some college more than 1 year, no degree: 4,432Associate degree: 4,430Bachelor's degree: 9,125Master's degree: 4,532Professional school degree: 1,769Doctorate degree: 504
Education attainment for females 25 years and older:
No schooling: 2,122Nursery to 4th grade: 1275th and 6th grade: 7947th and 8th grade: 3569th grade: 60410th grade: 44811th grade: 60912th grade, no diploma: 1,000High school graduate (or equivalency): 9,407Less than 1 year of college: 1,721Some college more than 1 year, no degree: 5,471Associate degree: 4,811Bachelor's degree: 11,590Master's degree: 4,272Professional school degree: 1,143Doctorate degree: 326
Housing units in structures:
One, detached: 25,479One, attached: 5,400Two: 1,5373 or 4: 4,0775 to 9: 3,36410 to 19: 3,14920 to 49: 5,12450 or more: 12,365Mobile homes: 528Boats, RVs, vans, etc.: 107Median worth of mobile homes: $9,999
Housing units lacking complete plumbing facilities in 2022: 1.0%Housing units lacking complete kitchen facilities in 2022: 2.3%House/condo owner moved in on average 9 years ago
Renter moved in on average 2 years ago
Private vs. public school enrollment:
Students in private schools in grades 1 to 8 (elementary and middle school): 2,847 Students in private schools in grades 9 to 12 (high school): 367 Students in private undergraduate colleges: 1,346