West Imperial, CA (California) Houses and Residents
| West Imperial: | $170,669 |
| California: | $715,900 |
Total population: 8,265 (Urban population: 4,417 (all inside urban clusters), Rural population: 2,907 (all nonfarm))
Houses: 2,109 (1,222 occupied: 996 owner occupied, 226 renter occupied)
| % of renters here: | 18% |
| State: | 44% |
Housing density: 2 houses/condos per square mile
Median price asked for vacant for-sale houses and condos in 2022 in this county: $232,391.
Median contract rent in 2022: $717 (lower quartile is $533, upper quartile is $838)
Median rent asked for vacant for-rent units in 2022: $1,037
Median gross rent in West Imperial, CA in 2022: $829
Housing units in West Imperial with a mortgage: 167 (16 second mortgage, 0 home equity loan, 0 both second mortgage and home equity loan)
Houses without a mortgage: 243


Household type by relationship:
Households: 163,844- In family households: 151,578 (25,244 male householders, 13,926 female householders)
26,413 spouses, 60,696 children (57,222 natural, 929 adopted, 2,545 stepchildren), 8,134 grandchildren, 2,608 brothers or sisters, 3,190 parents, foster children, 4,421 other relatives, 4,322 non-relatives
- In nonfamily households: 12,266 (5,076 male householders (4,091 living alone)), 4,880 female householders (4,277 living alone)), 2,310 nonrelatives
- In group quarters: 10,684 (9,983 institutionalized population)
27,205 married couples with children.
10,216 single-parent households (1,994 men, 8,222 women).
62.9% of residents of West Imperial speak English at home.
31.4% of residents speak Spanish at home (50% speak English very well, 12% speak English well, 23% speak English not well, 15% don't speak English at all).
0.6% of residents speak other Indo-European language at home (90% speak English very well, 10% speak English well).
5.0% of residents speak Asian or Pacific Island language at home (67% speak English very well, 27% speak English well, 5% speak English not well).
0.1% of residents speak other language at home (100% speak English very well).
Foreign born population: 769 (8.4%)
(25.4% of them are naturalized citizens)
| Here: | 4.6 |
| State: | 6.0 |
| Here: | 4.4 |
| State: | 3.9 |

- Bedrooms in owner-occupied houses and condos in West Imperial, California
- 36no bedroom
- 1991 bedroom
- 4892 bedrooms
- 2513 bedrooms
- 214 bedrooms
- 05+ bedrooms

- Bedrooms in renter-occupied apartments in West Imperial, California
- 7no bedroom
- 701 bedroom
- 942 bedrooms
- 463 bedrooms
- 94 bedrooms
- 05+ bedrooms

- Cars and other vehicles available in West Imperial in owner-occupied houses/condos
- 78no vehicle
- 3071 vehicle
- 3772 vehicles
- 1703 vehicles
- 644 vehicles
- 05+ vehicles

- Cars and other vehicles available in West Imperial in renter-occupied apartments
- 58no vehicle
- 781 vehicle
- 732 vehicles
- 173 vehicles
- 04 vehicles
- 05+ vehicles

- Rooms in owner-occupied houses in West Imperial, California
- 361 room
- 612 rooms
- 1313 rooms
- 2824 rooms
- 3045 rooms
- 1596 rooms
- 187 rooms
- 58 rooms
- 09+ rooms

- Rooms in renter-occupied apartments in West Imperial, California
- 71 room
- 442 rooms
- 233 rooms
- 934 rooms
- 255 rooms
- 346 rooms
- 07 rooms
- 08 rooms
- 09+ rooms


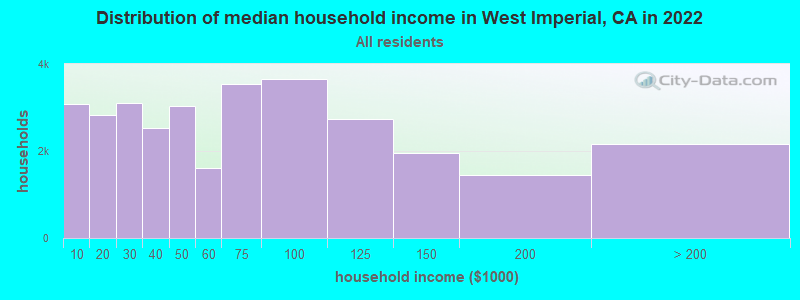
West Imperial, CA household income distribution

- 3,082Less than $10,000
- 2,838$10,000 to $19,999
- 3,110$20,000 to $29,999
- 2,524$30,000 to $39,999
- 3,043$40,000 to $49,999
- 1,606$50,000 to $59,999
- 3,543$60,000 to $74,999
- 3,658$75,000 to $99,999
- 2,738$100,000 to $124,999
- 1,962$125,000 to $149,999
- 1,446$150,000 to $199,999
- 2,164$200,000 or more
Percentage of workers working in this county: 36.2%
Number of people working at home: 48 (4.4% of all workers)
Travel time to work (commute)
- Less than 5 minutes: 55
- 5 to 9 minutes: 133
- 10 to 14 minutes: 71
- 15 to 19 minutes: 81
- 20 to 24 minutes: 36
- 25 to 29 minutes: 35
- 30 to 34 minutes: 84
- 35 to 39 minutes: 7
- 40 to 44 minutes: 23
- 45 to 59 minutes: 115
- 60 to 89 minutes: 33
- 90 or more minutes: 59
Means of transportation to work:
- Drove a car alone: 454 (60.6%)
- Carpooled: 202 (27.0%)
- Bus or trolley bus: 13 (1.7%)
- Motorcycle: 10 (1.3%)
- Walked: 27 (3.6%)
- Other means: 26 (3.5%)
- Worked at home: 17 (2.3%)


- Year of entry for the foreign-born population in West Imperial, California
- 1291995 to March 2000
- 951990 to 1994
- 1071985 to 1989
- 971980 to 1984
- 501975 to 1979
- 621970 to 1974
- 241965 to 1969
- 59Before 1965
Most common places of birth for foreign-born residents (%):
| West Imperial: | 94.4% (588) |
| California: | 44.3% (3,928,701) |
| West Imperial: | 3.4% (21) |
| California: | 0.1% (12,476) |
Place of birth for U.S.-born residents:
- This state: 4,440
- Other state: 1,229
- Northeast: 183
- Midwest: 401
- South: 366
- West: 279
22% of West Imperial residents lived in the same house 5 years ago.
Out of people who lived in different houses, 8% lived in this county.
Out of people who lived in different counties, 98% lived in California.
Education attainment for males 25 years and older:
- No schooling: 60
- Nursery to 4th grade: 56
- 5th and 6th grade: 123
- 7th and 8th grade: 352
- 9th grade: 197
- 10th grade: 181
- 11th grade: 214
- 12th grade, no diploma: 439
- High school graduate (or equivalency): 1,849
- Less than 1 year of college: 209
- Some college more than 1 year, no degree: 562
- Associate degree: 209
- Bachelor's degree: 122
- Master's degree: 22
- Professional school degree: 0
- Doctorate degree: 0

Education attainment for females 25 years and older:
- No schooling: 34
- Nursery to 4th grade: 56
- 5th and 6th grade: 69
- 7th and 8th grade: 26
- 9th grade: 58
- 10th grade: 67
- 11th grade: 69
- 12th grade, no diploma: 88
- High school graduate (or equivalency): 293
- Less than 1 year of college: 60
- Some college more than 1 year, no degree: 124
- Associate degree: 23
- Bachelor's degree: 70
- Master's degree: 6
- Professional school degree: 5
- Doctorate degree: 7


Housing units in structures:
- One, detached: 851
- One, attached: 25
- Two: 127
- 5 to 9: 7
- 10 to 19: 6
- Mobile homes: 1,032
- Boats, RVs, vans, etc.: 61
Median worth of mobile homes: $62,923
Housing units lacking complete kitchen facilities: 3.3%

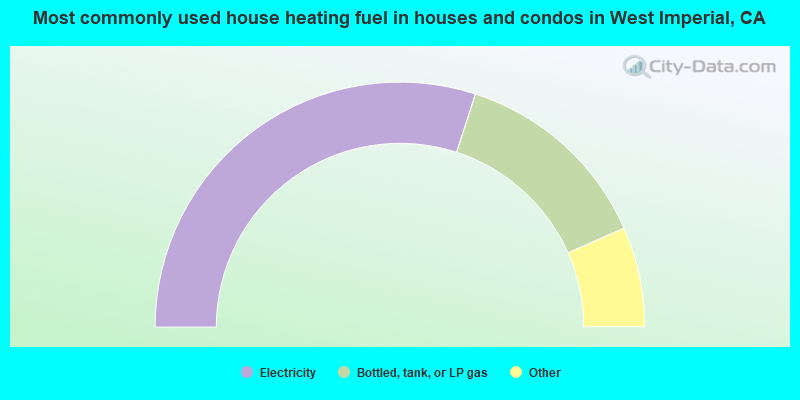
- 60.0%Electricity
- 26.8%Bottled, tank, or LP gas
- 3.4%No fuel used
- 3.3%Wood
- 3.2%Utility gas
- 3.2%Other fuel
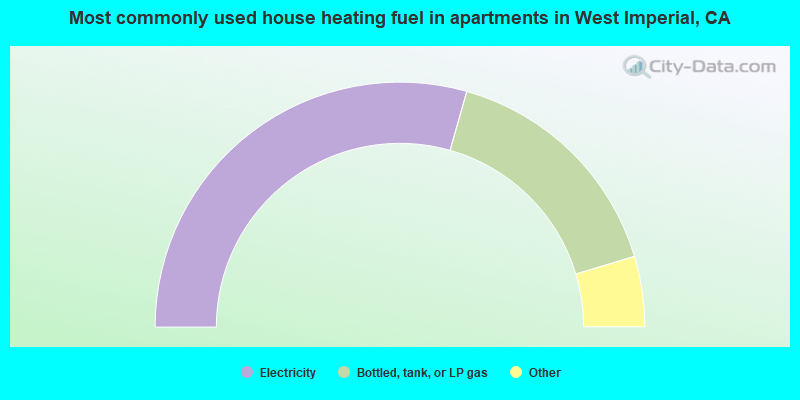
- 58.8%Electricity
- 31.9%Bottled, tank, or LP gas
- 4.0%Wood
- 3.1%Other fuel
- 2.2%No fuel used
Private vs. public school enrollment:
| Here: | 0.0% |
| California: | 9.9% |
| Here: | 15.3% |
| California: | 7.8% |
| Here: | 45.5% |
| California: | 15.4% |


