West Freehold, NJ (New Jersey) Houses and Residents
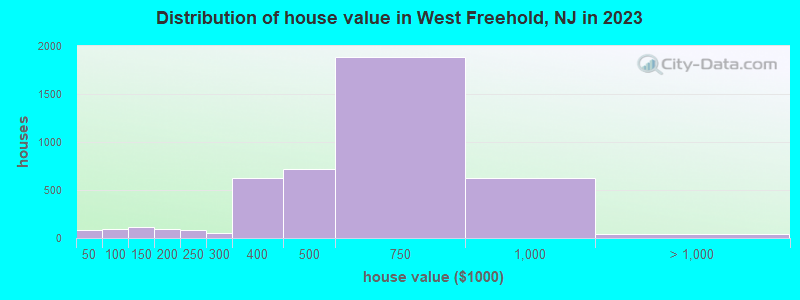
Estimated median house or condo value in 2022: $528,594 (it was $202,400 in 2000 )
West Freehold:
$528,594New Jersey:
$428,900
Lower value quartile - upper value quartile: $352,083 - $704,881Total population: 13,613 (Urban population: 12,490, Rural population: 44 (all nonfarm) )
Houses: 5,679 (5,538 occupied: 4,891 owner occupied, 742 renter occupied )
% of renters here:
13%State:
35%
Housing density: 968 houses/condos per square mile
Median price asked for vacant for-sale houses and condos in 2022 in this county: $430,351.
Median contract rent in 2022: $1,741 (lower quartile is $1,355, upper quartile is over $2,000)
Median rent asked for vacant for-rent units in 2022: $3,595
Median gross rent in West Freehold, NJ in 2022: over $2,000
Housing units in West Freehold with a mortgage: 3,184 (490 second mortgage, 0 home equity loan, 482 both second mortgage and home equity loan )Houses without a mortgage: 134
Median household income for houses/condos with a mortgage: $173,005
Median household income for apartments without a mortgage: $70,410
Median monthly housing costs: $1,996
Data:
Median house or condo value ($)
Median house or condo value ($ change since 2000)
Median house or condo value ($) - White
Median house or condo value ($) - Black or African American
Median house or condo value ($) - Asian
Median house or condo value ($) - Hispanic or Latino
Median house or condo value ($) - American Indian and Alaska Native
Median house or condo value ($) - Multirace
Median house or condo value ($) - Other Race
Median price asked for mobile homes ($)
Household density (households per square mile)
Mean house or condo value by units in structure - 1, detached ($)
Mean house or condo value by units in structure - 1, attached ($)
Mean house or condo value by units in structure - 2 ($)
Mean house or condo value by units in structure by units in structure - 3 or 4 ($)
Mean house or condo value by units in structure - 5 or more ($)
Mean house or condo value by units in structure - Boat, RV, van, etc. ($)
Mean house or condo value by units in structure - Mobile home ($)
Median contract rent ($)
Median contract rent - Lower quartile ($)
Median contract rent - Upper quartile ($)
Median gross rent ($)
Urban houses (%)
Rural houses (%)
Houses occupied (%)
Houses occupied (% change since 2000)
Houses owner occupied (%)
Houses owner occupied (% change since 2000)
Houses renter occupied (%)
Houses renter occupied (% change since 2000)
Vacant housing units - For rent (%)
Vacant housing units - For rent (% change since 2000)
Vacant housing units - For sale only (%)
Vacant housing units - For sale only (% change since 2000)
Vacant housing units - Rented or sold, not occupied (%)
Vacant housing units - Rented or sold, not occupied (% change since 2000)
Vacant housing units - For seasonal, recreational, or occasional use (%)
Vacant housing units - For seasonal, recreational, or occasional use (% change since 2000)
Vacant housing units - For migrant workers (%)
Vacant housing units - For migrant workers (% change since 2000)
Vacant housing units - Other vacant (%)
Vacant housing units - Other vacant (% change since 2000)
Median monthly housing costs ($)
Median household income for houses/condos with a mortgage ($)
Median household income for houses/condos without a mortgage ($)
Median household income ($)
Median household income ($) - White
Median household income ($) - Black or African American
Median household income ($) - Asian
Median household income ($) - Hispanic or Latino
Median household income ($) - American Indian and Alaska Native
Median household income ($) - Multirace
Median household income ($) - Other Race
Mortgage status - with mortgage (%)
Mortgage status - with second mortgage (%)
Mortgage status - with home equity loan (%)
Mortgage status - with both second mortgage and home equity loan (%)
Mortgage status - without a mortgage (%)
Median year house/condo built
Median year apartment built
Household type by relationship - Male householder living alone (%)
Household type by relationship - Male householder not living alone (%)
Household type by relationship - Female householder living alone (%)
Household type by relationship - Female householder not living alone (%)
Household type by relationship - Opposite-Sex spouse (%)
Household type by relationship - Same-Sex spouse (%)
Household type by relationship - Opposite-Sex unmarried partner (%)
Household type by relationship - Same-Sex unmarried partner (%)
Household type by relationship - In group quarters (%)
Size of family households - 2-person household (%)
Size of family households - 3-person household (%)
Size of family households - 4-person household (%)
Size of family households - 5-person household (%)
Size of family households - 6-person household (%)
Size of family households - 7-or-more-person household (%)
Size of nonfamily households - 1-person household (%)
Size of nonfamily households - 2-person household (%)
Size of nonfamily households - 3-person household (%)
Size of nonfamily households - 4-person household (%)
Size of nonfamily households - 5-person household (%)
Size of nonfamily households - 6-person household (%)
Size of nonfamily households - 7-or-moreperson household (%)
Year house built - Built 2010 or later (%)
Year house built - Built 2000 to 2009 (%)
Year house built - Built 1990 to 1999 (%)
Year house built - Built 1980 to 1989 (%)
Year house built - Built 1970 to 1979 (%)
Year house built - Built 1960 to 1969 (%)
Year house built - Built 1950 to 1959 (%)
Year house built - Built 1940 to 1949 (%)
Year house built - Built 1939 or earlier (%)
Median number of rooms in houses and condos
Median number of rooms in apartments
Median number of bedrooms in owner occupied houses
Mean number of bedrooms in owner occupied houses
Median number of bedrooms in renter occupied houses
Mean number of bedrooms in renter occupied houses
Median number of vehichles in owner occupied houses
Mean number of vehichles in owner occupied houses
Median number of vehichles in renter occupied houses
Mean number of vehichles in renter occupied houses
Rooms in owner-occupied houses - 1 room (%)
Rooms in owner-occupied houses - 2 rooms (%)
Rooms in owner-occupied houses - 3 rooms (%)
Rooms in owner-occupied houses - 4 rooms (%)
Rooms in owner-occupied houses - 5 rooms (%)
Rooms in owner-occupied houses - 6 rooms (%)
Rooms in owner-occupied houses - 7 rooms (%)
Rooms in owner-occupied houses - 8 rooms (%)
Rooms in owner-occupied houses - 9+ rooms (%)
Rooms in renter-occupied houses - 1 room (%)
Rooms in renter-occupied houses - 2 rooms (%)
Rooms in renter-occupied houses - 3 rooms (%)
Rooms in renter-occupied houses - 4 rooms (%)
Rooms in renter-occupied houses - 5 rooms (%)
Rooms in renter-occupied houses - 6 rooms (%)
Rooms in renter-occupied houses - 7 rooms (%)
Rooms in renter-occupied houses - 8 rooms (%)
Rooms in renter-occupied houses - 9+ rooms (%)
Bedrooms in owner-occupied houses - no bedrooms (%)
Bedrooms in owner-occupied houses - 1 bedroom (%)
Bedrooms in owner-occupied houses - 2 bedrooms (%)
Bedrooms in owner-occupied houses - 3 bedrooms (%)
Bedrooms in owner-occupied houses - 4 bedrooms (%)
Bedrooms in owner-occupied houses - 5+ bedrooms (%)
Bedrooms in renter-occupied houses - no bedrooms (%)
Bedrooms in renter-occupied houses - 1 bedroom (%)
Bedrooms in renter-occupied houses - 2 bedrooms (%)
Bedrooms in renter-occupied houses - 3 bedrooms (%)
Bedrooms in renter-occupied houses - 4 bedrooms (%)
Bedrooms in renter-occupied houses - 5+ bedrooms (%)
Vehicles available in owner-occupied houses - no vehicle available (%)
Vehicles available in owner-occupied houses - 1 vehicle available(%)
Vehicles available in owner-occupied houses - 2 Vehicles available (%)
Vehicles available in owner-occupied houses - 3 Vehicles available (%)
Vehicles available in owner-occupied houses - 4 Vehicles available (%)
Vehicles available in owner-occupied houses - 5+ Vehicles available (%)
Vehicles available in renter-occupied houses - no vehicle available (%)
Vehicles available in renter-occupied houses - 1 vehicle available (%)
Vehicles available in renter-occupied houses - 2 Vehicles available (%)
Vehicles available in renter-occupied houses - 3 Vehicles available (%)
Vehicles available in renter-occupied houses - 4 Vehicles available (%)
Vehicles available in renter-occupied houses - 5+ Vehicles available (%)
Housing units in structures - 1, detached (%)
Housing units in structures - 1, attached (%)
Housing units in structures - 2 (%)
Housing units in structures - 3 or 4 (%)
Housing units in structures - 5 to 9 (%)
Housing units in structures - 10 to 19 (%)
Housing units in structures - 20 to 49 (%)
Housing units in structures - 50 or more (%)
Housing units in structures - Mobile home (%)
Housing units in structures - Boat, RV, van, etc. (%)
Housing units in structures - Owners - 1, detached (%)
Housing units in structures - Owners - 1, attached (%)
Housing units in structures - Owners - 2 (%)
Housing units in structures - Owners - 3 or 4 (%)
Housing units in structures - Owners - 5 to 9 (%)
Housing units in structures - Owners - 10 to 19 (%)
Housing units in structures - Owners - 20 to 49 (%)
Housing units in structures - Owners - 50 or more (%)
Housing units in structures - Owners - Mobile home (%)
Housing units in structures - Owners - Boat, RV, van, etc. (%)
Housing units in structures - Renters - 1, detached (%)
Housing units in structures - Renters - 1, attached (%)
Housing units in structures - Renters - 2 (%)
Housing units in structures - Renters - 3 or 4 (%)
Housing units in structures - Renters - 5 to 9 (%)
Housing units in structures - Renters - 10 to 19 (%)
Housing units in structures - Renters - 20 to 49 (%)
Housing units in structures - Renters - 50 or more (%)
Housing units in structures - Renters - Mobile home (%)
Housing units in structures - Renters - Boat, RV, van, etc. (%)
House/condo owner moved in on average (years ago)
Renter moved in on average (years ago)
Year householder moved into unit - Moved in 1999 to March 2000 (%)
Year householder moved into unit - Moved in 1999 to March 2000 (%) - White
Year householder moved into unit - Moved in 1999 to March 2000 (%) - Black or African American
Year householder moved into unit - Moved in 1999 to March 2000 (%) - Asian
Year householder moved into unit - Moved in 1999 to March 2000 (%) - Hispanic or Latino
Year householder moved into unit - Moved in 1999 to March 2000 (%) - American Indian and Alaska Native
Year householder moved into unit - Moved in 1999 to March 2000 (%) - Multirace
Year householder moved into unit - Moved in 1999 to March 2000 (%) - Other Race
Year householder moved into unit - Moved in 1995 to 1998 (%)
Year householder moved into unit - Moved in 1995 to 1998 (%) - White
Year householder moved into unit - Moved in 1995 to 1998 (%) - Black or African American
Year householder moved into unit - Moved in 1995 to 1998 (%) - Asian
Year householder moved into unit - Moved in 1995 to 1998 (%) - Hispanic or Latino
Year householder moved into unit - Moved in 1995 to 1998 (%) - American Indian and Alaska Native
Year householder moved into unit - Moved in 1995 to 1998 (%) - Multirace
Year householder moved into unit - Moved in 1995 to 1998 (%) - Other Race
Year householder moved into unit - Moved in 1990 to 1994 (%)
Year householder moved into unit - Moved in 1990 to 1994 (%) - White
Year householder moved into unit - Moved in 1990 to 1994 (%) - Black or African American
Year householder moved into unit - Moved in 1990 to 1994 (%) - Asian
Year householder moved into unit - Moved in 1990 to 1994 (%) - Hispanic or Latino
Year householder moved into unit - Moved in 1990 to 1994 (%) - American Indian and Alaska Native
Year householder moved into unit - Moved in 1990 to 1994 (%) - Multirace
Year householder moved into unit - Moved in 1990 to 1994 (%) - Other Race
Year householder moved into unit - Moved in 1980 to 1989 (%)
Year householder moved into unit - Moved in 1980 to 1989 (%) - White
Year householder moved into unit - Moved in 1980 to 1989 (%) - Black or African American
Year householder moved into unit - Moved in 1980 to 1989 (%) - Asian
Year householder moved into unit - Moved in 1980 to 1989 (%) - Hispanic or Latino
Year householder moved into unit - Moved in 1980 to 1989 (%) - American Indian and Alaska Native
Year householder moved into unit - Moved in 1980 to 1989 (%) - Multirace
Year householder moved into unit - Moved in 1980 to 1989 (%) - Other Race
Year householder moved into unit - Moved in 1970 to 1979 (%)
Year householder moved into unit - Moved in 1970 to 1979 (%) - White
Year householder moved into unit - Moved in 1970 to 1979 (%) - Black or African American
Year householder moved into unit - Moved in 1970 to 1979 (%) - Asian
Year householder moved into unit - Moved in 1970 to 1979 (%) - Hispanic or Latino
Year householder moved into unit - Moved in 1970 to 1979 (%) - American Indian and Alaska Native
Year householder moved into unit - Moved in 1970 to 1979 (%) - Multirace
Year householder moved into unit - Moved in 1970 to 1979 (%) - Other Race
Year householder moved into unit - Moved in 1969 or earlier (%)
Year householder moved into unit - Moved in 1969 or earlier (%) - White
Year householder moved into unit - Moved in 1969 or earlier (%) - Black or African American
Year householder moved into unit - Moved in 1969 or earlier (%) - Asian
Year householder moved into unit - Moved in 1969 or earlier (%) - Hispanic or Latino
Year householder moved into unit - Moved in 1969 or earlier (%) - American Indian and Alaska Native
Year householder moved into unit - Moved in 1969 or earlier (%) - Multirace
Year householder moved into unit - Moved in 1969 or earlier (%) - Other Race
Housing units lacking complete plumbing facilities (%)
Housing units lacking complete kitchen facilities (%)
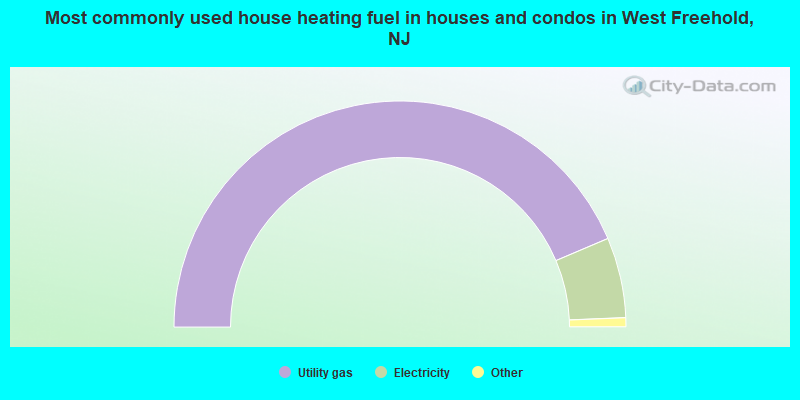
House heating fuel used in houses and condos - Utility gas (%)
House heating fuel used in houses and condos - Bottled, tank, or LP gas (%)
House heating fuel used in houses and condos - Electricity (%)
House heating fuel used in houses and condos - Fuel oil, kerosene, etc. (%)
House heating fuel used in houses and condos - Coal or coke (%)
House heating fuel used in houses and condos - Wood (%)
House heating fuel used in houses and condos - Solar energy (%)
House heating fuel used in houses and condos - Other fuel (%)
House heating fuel used in houses and condos - No fuel used (%)
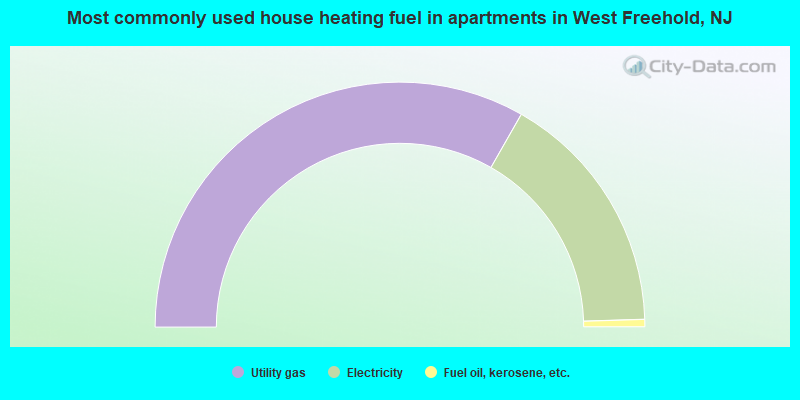
House heating fuel used in apartments - Utility gas (%)
House heating fuel used in apartments - Bottled, tank, or LP gas (%)
House heating fuel used in apartments - Electricity (%)
House heating fuel used in apartments - Fuel oil, kerosene, etc. (%)
House heating fuel used in apartments - Coal or coke (%)
House heating fuel used in apartments - Wood (%)
House heating fuel used in apartments - Solar energy (%)
House heating fuel used in apartments - Other fuel (%)
House heating fuel used in apartments - No fuel used (%)
Median year house/condo built: 1978Median year apartment built: 1980Household type by relationship:
Households: 14,471
Male householders: 3,054 (630 living alone ), Female householders: 2,462 (1,003 living alone )3,209 spouses (3,209 opposite-sex spouses ), 87 unmarried partners , (87 opposite-sex unmarried partners ), 4,918 children (4,895 natural , 12 adopted , 11 stepchildren ), 159 grandchildren , 60 brothers or sisters , 238 parents , 0 foster children , 89 other relatives , 60 non-relatives In group quarters: 131
Size of family households: 1,498 2-persons , 879 3-persons , 1,073 4-persons , 400 5-persons , 83 6-persons , 15 7-or-more-persons .
Size of nonfamily households: 1,628 1-person , 79 2-persons .
2,939 married couples with children. single-parent households (135 men , 189 women ).
82.0% of residents of West Freehold speak English at home. of residents speak Spanish at home (61% speak English very well , 27% speak English well , 12% speak English not well ).of residents speak other Indo-European language at home (66% speak English very well , 23% speak English well , 9% speak English not well , 2% don't speak English at all ).of residents speak Asian or Pacific Island language at home (54% speak English very well , 18% speak English well , 25% speak English not well , 3% don't speak English at all ).of residents speak other language at home (72% speak English very well , 18% speak English well , 10% speak English not well ).
Foreign born population: 1,913 (13.2%)of them are naturalized citizens )
Median number of rooms in houses and condos:
Median number of rooms in apartments
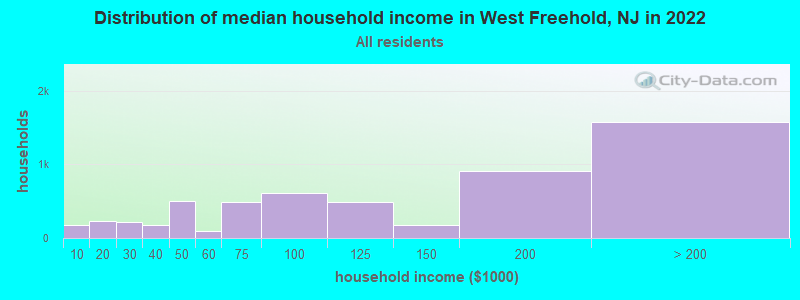
West Freehold, NJ household income distribution 172 Less than $10,000229 $10,000 to $19,999222 $20,000 to $29,999180 $30,000 to $39,999503 $40,000 to $49,99989 $50,000 to $59,999483 $60,000 to $74,999609 $75,000 to $99,999487 $100,000 to $124,999172 $125,000 to $149,999910 $150,000 to $199,9991,574 $200,000 or more
Home value of owner - occupied houses in 2022 in West Freehold, NJ 6 $20,000 to $24,99941 $30,000 to $34,99929 $40,000 to $49,999100 $50,000 to $59,99911 $80,000 to $89,99992 $90,000 to $99,99933 $100,000 to $124,99991 $125,000 to $149,99936 $150,000 to $174,999154 $200,000 to $249,999184 $250,000 to $299,999947 $300,000 to $399,999574 $400,000 to $499,9991,936 $500,000 to $749,999561 $750,000 to $999,999Rent paid by renters in 2022 in West Freehold, NJ 12 $200 to $24911 $650 to $69958 $1,000 to $1,249169 $1,250 to $1,499161 $1,500 to $1,999186 $2,000 to $2,49969 $3,000 to $3,49932 $3,500 or more24 No cash rent
Percentage of workers working in this county: 69.3%Number of people working at home: 2,146 (28.6% of all workers )
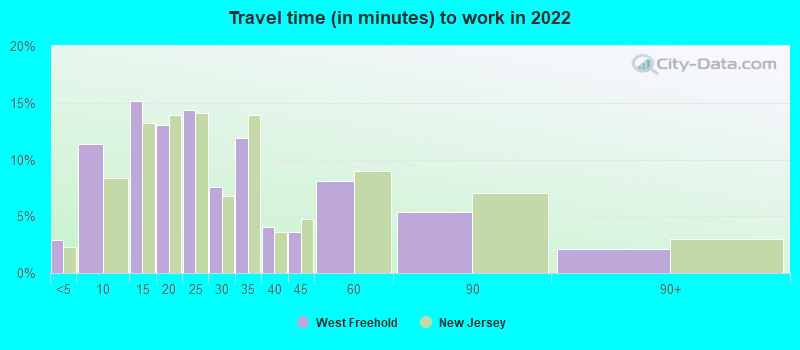
Travel time to work (commute)
Less than 5 minutes: 1945 to 9 minutes: 87510 to 14 minutes: 60315 to 19 minutes: 85720 to 24 minutes: 49725 to 29 minutes: 21830 to 34 minutes: 37935 to 39 minutes: 17440 to 44 minutes: 33345 to 59 minutes: 43460 to 89 minutes: 48590 or more minutes: 476
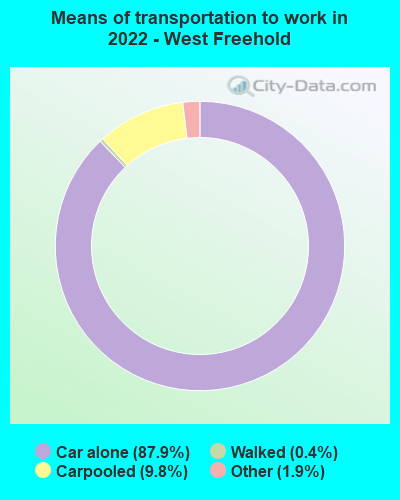
Means of transportation to work:
Drove a car alone: 6,476 (66.0%)Carpooled: 855 (8.7%)Bus : 4 (0.0%)Taxi: 209 (2.1%)Walked: 44 (0.4%)Worked at home: 2,146 (21.9%)
Unemployment by race in 2022
Unemployment rate for White non-Hispanic residents 3.0% Males1.5% FemalesUnemployment rate for Black residents 19.0% MalesUnemployment rate for Asian residents 2.0% FemalesUnemployment rate for Hispanic or Latino residents 2.2% Females
Year of entry for the foreign-born population in West Freehold, New Jersey
476 2010 or later 221 2000 to 2009 599 1990 to 1999 265 1980 to 1989 196 1970 to 1979 534 Before 1970
First ancestries reported:
Italian: 1,373 (22.0%)
American: 710 (11.4%)
Irish: 679 (10.9%)
Russian: 326 (5.2%)
English: 262 (4.2%)
Turkish: 187 (3.0%)
European: 181 (2.9%)
Polish: 172 (2.7%)
Moroccan: 141 (2.3%)
Eastern European: 141 (2.3%)
Jamaican: 116 (1.9%)
German: 101 (1.6%)
Brazilian: 69 (1.1%)
Egyptian: 46 (0.7%)
Scotch-Irish: 41 (0.7%)
Ukrainian: 38 (0.6%)
Iraqi: 26 (0.4%)
Norwegian: 23 (0.4%)
Portuguese: 21 (0.3%)
Trinidadian and Tobagonian: 21 (0.3%)
Czechoslovakian: 18 (0.3%)
Slovak: 17 (0.3%)
Hungarian: 12 (0.2%)
Syrian: 11 (0.2%)
Scottish: 11 (0.2%)
French Canadian: 9 (0.1%)
British: 3 (0.05%) Most common places of birth for foreign-born residents (%): Turkey West Freehold:
10.5% (200)New Jersey:
0.8% (16,778)
Mexico West Freehold:
9.8% (187)New Jersey:
4.8% (102,527)
Russia West Freehold:
9.5% (181)New Jersey:
0.9% (20,371)
India West Freehold:
6.9% (132)New Jersey:
12.8% (274,609)
Nepal West Freehold:
6.6% (126)New Jersey:
0.1% (2,890)
Colombia West Freehold:
6.1% (116)New Jersey:
4.2% (90,817)
Egypt West Freehold:
6.0% (114)New Jersey:
1.6% (33,678)
China, excluding Hong Kong and Taiwan West Freehold:
5.8% (110)New Jersey:
3.7% (78,969)
Honduras West Freehold:
4.6% (88)New Jersey:
1.7% (37,335)
Brazil West Freehold:
4.5% (86)New Jersey:
2.1% (46,020)
Morocco West Freehold:
4.0% (77)New Jersey:
0.3% (5,621)
Jamaica West Freehold:
3.0% (58)New Jersey:
2.2% (47,365)
Italy West Freehold:
3.0% (57)New Jersey:
1.5% (33,198)
Malaysia West Freehold:
2.9% (55)New Jersey:
0.1% (2,031)
Iraq West Freehold:
2.2% (42)New Jersey:
0.1% (1,815)
Cuba West Freehold:
2.1% (40)New Jersey:
2.1% (45,435)
Romania West Freehold:
1.9% (36)New Jersey:
0.3% (6,033)
Spain West Freehold:
1.9% (36)New Jersey:
0.5% (10,246)
Place of birth for U.S.-born residents:
This state: 6,766Other state: 5,481Northeast: 4,548Midwest: 318South: 409West: 180 97.4% of West Freehold residents lived in the same house 1 years ago.
Out of people who lived in different houses, 24.3% lived in this county.
Out of people who lived in different counties, 68.6% lived in New Jersey.
West Freehold:
97.4%State average:
90.4%
Education attainment for males 25 years and older:
No schooling: 65Nursery to 4th grade: 85th and 6th grade: 07th and 8th grade: 219th grade: 2710th grade: 011th grade: 2512th grade, no diploma: 114High school graduate (or equivalency): 870Less than 1 year of college: 212Some college more than 1 year, no degree: 416Associate degree: 236Bachelor's degree: 1,938Master's degree: 768Professional school degree: 50Doctorate degree: 84
Education attainment for females 25 years and older:
No schooling: 16Nursery to 4th grade: 325th and 6th grade: 57th and 8th grade: 359th grade: 1210th grade: 4211th grade: 2212th grade, no diploma: 62High school graduate (or equivalency): 917Less than 1 year of college: 219Some college more than 1 year, no degree: 385Associate degree: 587Bachelor's degree: 1,619Master's degree: 1,066Professional school degree: 87Doctorate degree: 82
Housing units in structures:
One, detached: 3,497One, attached: 1,131Two: 1203 or 4: 1655 to 9: 55810 to 19: 9820 to 49: 6950 or more: 31Mobile homes: 6Housing units lacking complete plumbing facilities in 2022: 0.1%Housing units lacking complete kitchen facilities in 2022: 1.6%House/condo owner moved in on average 11 years ago
Renter moved in on average 5 years ago
Private vs. public school enrollment:
Students in private schools in grades 1 to 8 (elementary and middle school): 170 Here:
8.0%New Jersey:
12.3%
Students in private schools in grades 9 to 12 (high school): 81 Here:
11.3%New Jersey:
13.1%
Students in private undergraduate colleges: 25 Here:
7.6%New Jersey:
33.2%