Welby, CO (Colorado) Houses and Residents
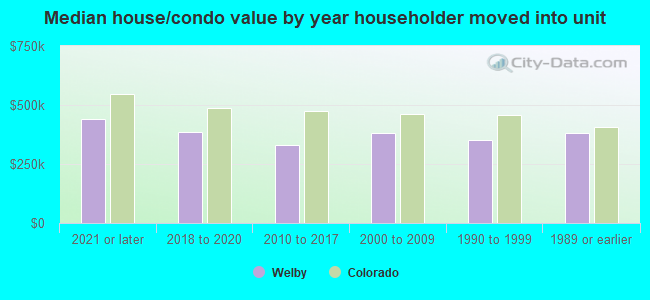
| Welby: | $365,868 |
| Colorado: | $531,100 |
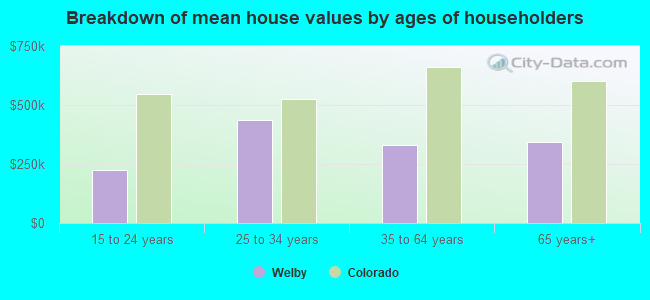
Mean price in 2022:
Detached houses: $414,180
Here: $414,180 State: $676,667 Townhouses or other attached units: $271,505
Here: $271,505 State: $526,340 In 3-to-4-unit structures: $299,391
Here: $299,391 State: $385,502 In 5-or-more-unit structures: $204,530
Here: $204,530 State: $417,586 Mobile homes: $145,281
Here: $145,281 State: $115,510
Total population: 14,846 (Urban population: 13,010, Rural population: 0)
Houses: 6,275 (6,045 occupied: 4,457 owner occupied, 1,618 renter occupied)
| % of renters here: | 27% |
| State: | 34% |
Housing density: 1,635 houses/condos per square mile
Median price asked for vacant for-sale houses and condos in 2022: $1,721,149.
Median contract rent in 2022: $1,426 (lower quartile is $1,155, upper quartile is $1,803)
Median rent asked for vacant for-rent units in 2022: $580
Median gross rent in Welby, CO in 2022: $1,508
Housing units in Welby with a mortgage: 3,201 (431 second mortgage, 0 home equity loan, 243 both second mortgage and home equity loan)
Houses without a mortgage: 384
Median household income for houses/condos with a mortgage: $85,724
Median household income for apartments without a mortgage: $62,210
Median monthly housing costs: $1,498
Compare current foreclosures near Welby, CO:
| Photo | Address | Area | Beds / Baths | Price | Details |
|---|---|---|---|---|---|

|
#1
Curtis St
Denver, CO 80205
|
822 sq. feet
|
3 baths 4 beds |
$499,900
|
show details |

|
#2
E Exposition Ave Apartme
Aurora, CO 80012
|
444 sq. feet
|
1 baths 1 beds |
show details | |

|
#3
S Memphis Way Apt K
Aurora, CO 80017
|
706 sq. feet
|
1 baths 1 beds |
show details | |

|
#4
Hudson Ct
Denver, CO 80241
|
- sq. feet
|
2 baths 4 beds |
show details | |

|
#5
Nome St
Aurora, CO 80010
|
736 sq. feet
|
1 baths 2 beds |
show details | |

|
#6
W 100th Ave
Denver, CO 80260
|
1,694 sq. feet
|
2 baths 3 beds |
show details | |

|
#7
Lafayette St
Denver, CO 80233
|
1,700 sq. feet
|
2 baths 3 beds |
show details | |

|
#8
E 58th Ave
Denver, CO 80238
|
1,315 sq. feet
|
2 baths 3 beds |
show details | |

|
#9
E Columbia Dr
Aurora, CO 80014
|
1,008 sq. feet
|
1 baths 3 beds |
show details | |

|
#10
Emerson St
Denver, CO 80233
|
1,410 sq. feet
|
2 baths 3 beds |
show details |
| Photo | Address | Area | Beds / Baths | Price | Details |
|---|---|---|---|---|---|

|
#11
E Asbury Pl
Aurora, CO 80013
|
1,880 sq. feet
|
2 baths 3 beds |
show details | |

|
#12
Leyden Ln
Commerce City, CO 80022
|
720 sq. feet
|
1 baths 2 beds |
show details | |

|
#13
S Blackhawk Way
Aurora, CO 80014
|
3,021 sq. feet
|
2 baths 3 beds |
show details | |

|
#14
W Dartmouth Ave
Denver, CO 80227
|
1,351 sq. feet
|
3 baths 3 beds |
show details | |

|
#15
Ingalls St
Denver, CO 80226
|
1,083 sq. feet
|
1 baths 3 beds |
show details | |

|
#16
E 128th Pl
Denver, CO 80241
|
2,137 sq. feet
|
2 baths 3 beds |
show details | |

|
#17
S Ivory Ct
Aurora, CO 80013
|
816 sq. feet
|
1 baths 2 beds |
show details | |

|
#18
S Newark Ct
Aurora, CO 80012
|
1,296 sq. feet
|
2 baths 2 beds |
show details | |

|
#19
Zenobia Pl
Westminster, CO 80030
|
1,472 sq. feet
|
1 baths 4 beds |
show details | |

|
#20
Central Park Blvd
Denver, CO 80238
|
1,295 sq. feet
|
2 baths 3 beds |
show details |
| Photo | Address | Area | Beds / Baths | Price | Details |
|---|---|---|---|---|---|

|
#21
E Kansas Cir Apt 44
Denver, CO 80247
|
1,240 sq. feet
|
2 baths 2 beds |
show details | |

|
#22
Sedalia St
Commerce City, CO 80022
|
2,138 sq. feet
|
2 baths 3 beds |
show details | |

|
#23
March Dr
Denver, CO 80249
|
1,252 sq. feet
|
1 baths 2 beds |
show details | |

|
#24
E 113th Ave
Commerce City, CO 80022
|
1,820 sq. feet
|
2 baths 2 beds |
show details | |

|
#25
S Fox St
Englewood, CO 80110
|
1,584 sq. feet
|
2 baths 4 beds |
show details | |

|
#26
Magnolia St
Commerce City, CO 80022
|
1,032 sq. feet
|
1 baths 3 beds |
show details | |

|
#27
Jasmine St
Brighton, CO 80602
|
2,422 sq. feet
|
3 baths 3 beds |
show details | |

|
#28
Wyandot St
Denver, CO 80221
|
816 sq. feet
|
2 baths 4 beds |
show details | |

|
#29
E 107th Pl
Commerce City, CO 80022
|
2,780 sq. feet
|
4 baths 6 beds |
show details | |

|
#30
E Harvard Ave
Aurora, CO 80013
|
1,279 sq. feet
|
2 baths 3 beds |
show details |
| Photo | Address | Area | Beds / Baths | Price | Details |
|---|---|---|---|---|---|

|
#31
W 112th Ave Apt B
Denver, CO 80234
|
- sq. feet
|
1 baths 2 beds |
show details | |

|
#32
Fenton St
Arvada, CO 80003
|
1,306 sq. feet
|
2 baths 3 beds |
show details | |

|
#33
E Ohio Pl
Aurora, CO 80012
|
1,390 sq. feet
|
2 baths 3 beds |
show details | |

|
#34
Lafayette St
Brighton, CO 80602
|
2,640 sq. feet
|
3 baths 6 beds |
show details | |

|
#35
E Warren Dr Unit 101
Aurora, CO 80013
|
1,013 sq. feet
|
2 baths 2 beds |
show details | |

|
#36
E Batavia Dr
Aurora, CO 80011
|
842 sq. feet
|
1 baths 4 beds |
show details | |

|
#37
E Mississippi Ave
Denver, CO 80247
|
1,194 sq. feet
|
2 baths 2 beds |
show details | |

|
#38
E Kentucky Ave Apt 101
Aurora, CO 80017
|
1,177 sq. feet
|
1 baths 3 beds |
show details | |

|
#39
Everett St
Arvada, CO 80005
|
1,484 sq. feet
|
2 baths 3 beds |
show details | |

|
#40
Albion Cir
Denver, CO 80241
|
2,013 sq. feet
|
2 baths 4 beds |
show details |
| Photo | Address | Area | Beds / Baths | Price | Details |
|---|---|---|---|---|---|

|
#41
W 71st Pl
Westminster, CO 80030
|
1,738 sq. feet
|
2 baths 3 beds |
show details | |

|
#42
S Granby St
Aurora, CO 80014
|
1,160 sq. feet
|
2 baths 2 beds |
show details | |

|
#43
King Ct
Westminster, CO 80031
|
1,542 sq. feet
|
4 baths 3 beds |
show details | |

|
#44
E Alaska Ave
Aurora, CO 80012
|
1,118 sq. feet
|
1 baths 2 beds |
show details | |

|
#45
E 54th Ave
Denver, CO 80249
|
3,192 sq. feet
|
2 baths 4 beds |
show details | |

|
#46
Eagle St
Denver, CO 80239
|
1,380 sq. feet
|
2 baths 3 beds |
show details | |

|
#47
W Woodard Cir
Denver, CO 80227
|
3,221 sq. feet
|
3 baths 3 beds |
show details | |

|
#48
S Fairplay St
Aurora, CO 80014
|
1,888 sq. feet
|
2 baths 4 beds |
show details | |

|
#49
E 39th Ave
Denver, CO 80249
|
1,625 sq. feet
|
3 baths 3 beds |
show details | |

|
Check over 1 million property listings on Foreclosure.com!
|
browse all offers | |||

Latest news about housing in Welby, CO collected exclusively by city-data.com from local newspapers, TV, and radio stations

 | 20's age couple looking to buy a house outside of Denver. (31 replies) |
| Top 3 Suburbs (24 replies) |
| Trying to choose a town to buy a house in -- help! (9 replies) |
| Ranking Denver suburbs, best to worst (31 replies) |
| Castlewood Area of Centennial - Any info? (29 replies) |
| Anyone from Atlanta know a replacement for Your Dekalb Farmer's Market? (8 replies) |

Median year apartment built: 1980
Household type by relationship:
Households: 16,519- Male householders: 2,720 (750 living alone), Female householders: 3,137 (689 living alone)
2,302 spouses (2,240 opposite-sex spouses), 483 unmarried partners, (466 opposite-sex unmarried partners), 4,957 children (4,624 natural, 26 adopted, 307 stepchildren), 635 grandchildren, 317 brothers or sisters, 344 parents, 22 foster children, 663 other relatives, 932 non-relatives
- In group quarters: 2
Size of family households: 1,325 2-persons, 891 3-persons, 856 4-persons, 488 5-persons, 298 6-persons, 153 7-or-more-persons.
Size of nonfamily households: 1,493 1-person, 389 2-persons, 82 3-persons, 51 4-persons.
2,024 married couples with children.
739 single-parent households (386 men, 353 women).
62.1% of residents of Welby speak English at home.
35.2% of residents speak Spanish at home (54% speak English very well, 25% speak English well, 16% speak English not well, 6% don't speak English at all).
0.7% of residents speak other Indo-European language at home (40% speak English very well, 53% speak English well, 7% speak English not well).
2.0% of residents speak Asian or Pacific Island language at home (23% speak English very well, 28% speak English well, 40% speak English not well, 8% don't speak English at all).
0.3% of residents speak other language at home (100% speak English very well).
Foreign born population: 3,760 (22.8%)
(40.6% of them are naturalized citizens)
| Here: | 5.9 |
| State: | 6.8 |
| Here: | 4.8 |
| State: | 4.0 |
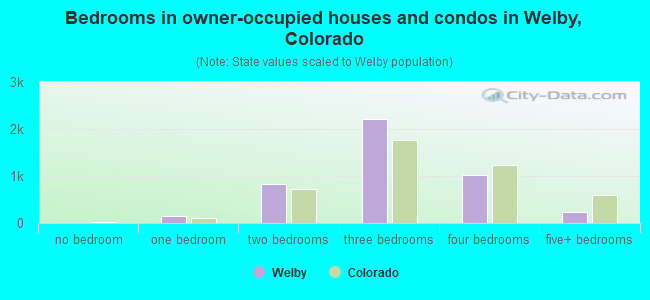
- Bedrooms in owner-occupied houses and condos in Welby, Colorado
- 7no bedroom
- 1481 bedroom
- 8302 bedrooms
- 2,2173 bedrooms
- 1,0134 bedrooms
- 2425+ bedrooms
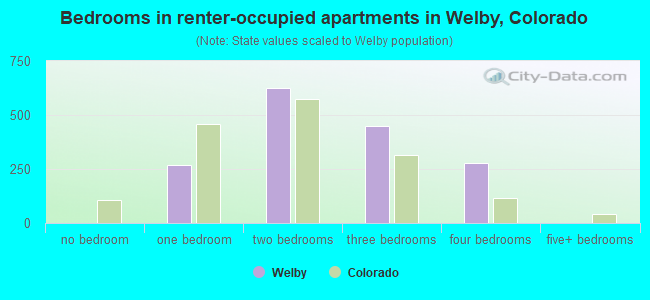
- Bedrooms in renter-occupied apartments in Welby, Colorado
- 0no bedroom
- 2671 bedroom
- 6232 bedrooms
- 4483 bedrooms
- 2804 bedrooms
- 05+ bedrooms
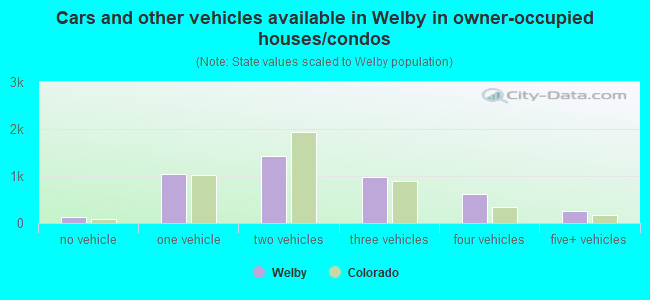
- Cars and other vehicles available in Welby in owner-occupied houses/condos
- 123no vehicle
- 1,0511 vehicle
- 1,4222 vehicles
- 9773 vehicles
- 6214 vehicles
- 2635+ vehicles
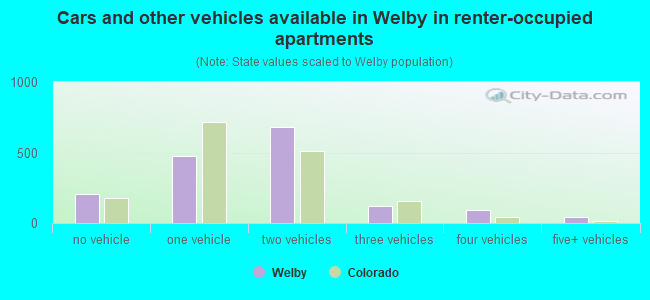
- Cars and other vehicles available in Welby in renter-occupied apartments
- 207no vehicle
- 4731 vehicle
- 6802 vehicles
- 1213 vehicles
- 954 vehicles
- 425+ vehicles
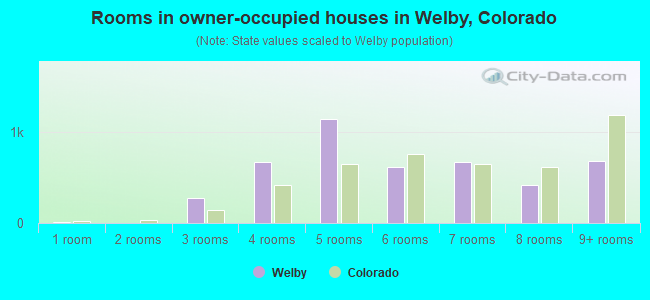
- Rooms in owner-occupied houses in Welby, Colorado
- 71 room
- 02 rooms
- 2703 rooms
- 6694 rooms
- 1,1435 rooms
- 6116 rooms
- 6667 rooms
- 4138 rooms
- 6789+ rooms
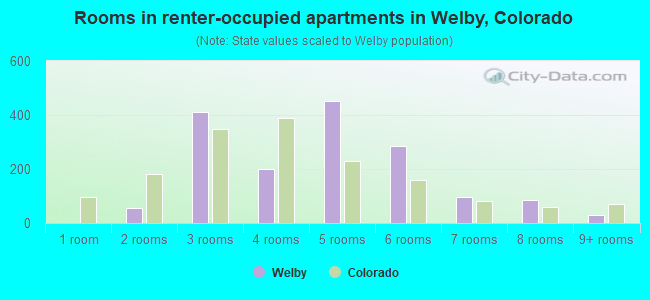
- Rooms in renter-occupied apartments in Welby, Colorado
- 01 room
- 562 rooms
- 4123 rooms
- 1994 rooms
- 4535 rooms
- 2876 rooms
- 967 rooms
- 868 rooms
- 289+ rooms
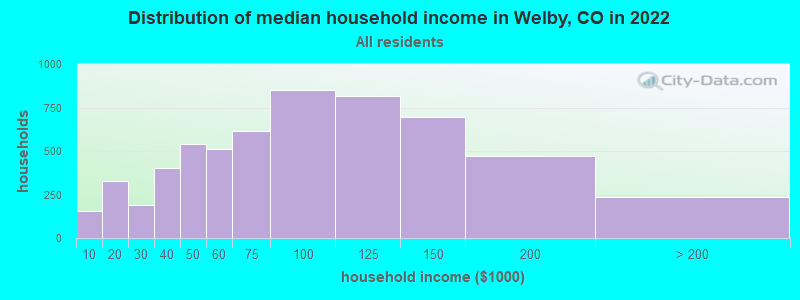
Welby, CO household income distribution

- 157Less than $10,000
- 329$10,000 to $19,999
- 188$20,000 to $29,999
- 404$30,000 to $39,999
- 541$40,000 to $49,999
- 513$50,000 to $59,999
- 616$60,000 to $74,999
- 848$75,000 to $99,999
- 817$100,000 to $124,999
- 694$125,000 to $149,999
- 470$150,000 to $199,999
- 238$200,000 or more
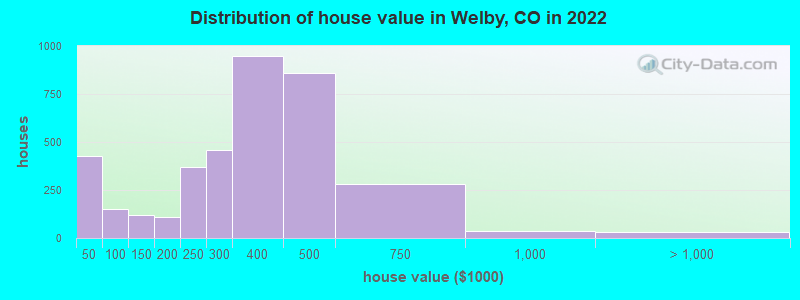
Home value of owner - occupied houses in 2022 in Welby, CO
-
- 71Less than $10,000
- 11$10,000 to $14,999
- 42$15,000 to $19,999
- 265$25,000 to $29,999
- 34$40,000 to $49,999
- 35$50,000 to $59,999
- 40$60,000 to $69,999
- 43$90,000 to $99,999
- 92$100,000 to $124,999
- 29$125,000 to $149,999
- 93$150,000 to $174,999
- 17$175,000 to $199,999
- 368$200,000 to $249,999
- 460$250,000 to $299,999
- 946$300,000 to $399,999
- 858$400,000 to $499,999
- 282$500,000 to $749,999
- 34$750,000 to $999,999
- 33$1,000,000 to $1,499,999
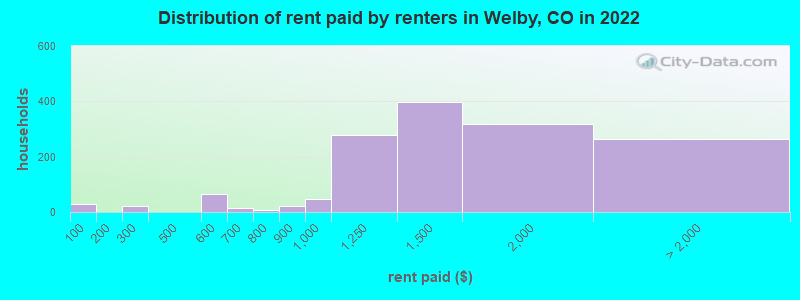
Rent paid by renters in 2022 in Welby, CO
-
- 28Less than $100
- 23$250 to $299
- 64$500 to $549
- 15$600 to $649
- 5$700 to $749
- 21$800 to $899
- 48$900 to $999
- 277$1,000 to $1,249
- 397$1,250 to $1,499
- 317$1,500 to $1,999
- 244$2,000 to $2,499
- 18No cash rent
Percentage of workers working in this county: 45.2%
Number of people working at home: 1,173 (12.7% of all workers)
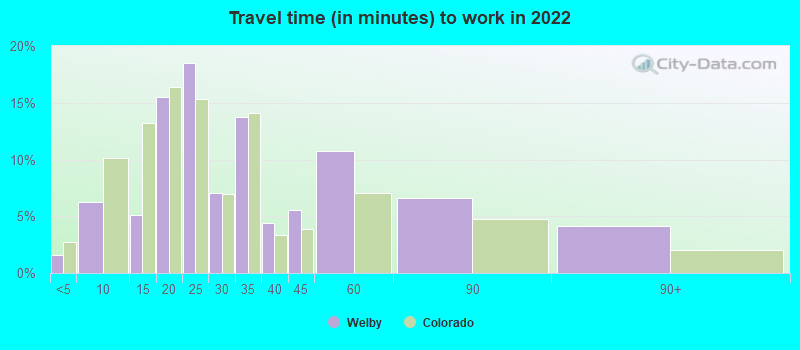
Travel time to work (commute)
- Less than 5 minutes: 6
- 5 to 9 minutes: 68
- 10 to 14 minutes: 868
- 15 to 19 minutes: 1,213
- 20 to 24 minutes: 1,510
- 25 to 29 minutes: 497
- 30 to 34 minutes: 1,639
- 35 to 39 minutes: 300
- 40 to 44 minutes: 489
- 45 to 59 minutes: 584
- 60 to 89 minutes: 650
- 90 or more minutes: 173
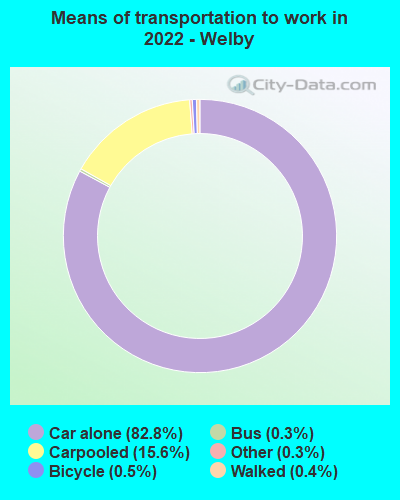
Means of transportation to work:
- Drove a car alone: 2,921 (63.3%)
- Carpooled: 585 (12.7%)
- Bus: 8 (0.2%)
- Taxi: 11 (0.2%)
- Bicycle: 13 (0.3%)
- Walked: 12 (0.3%)
- Worked at home: 1,173 (25.4%)
- Unemployment by race in 2022
- Unemployment rate for White non-Hispanic residents
- 6.9%Males
- 0.9%Females
- Unemployment rate for Black residents
- 6.6%Females
- Unemployment rate for Asian residents
- 8.2%Females
- Unemployment rate for other race residents
- 5.7%Males
- Unemployment rate for two or more race residents
- 5.9%Males
- 0.8%Females
- Unemployment rate for Hispanic or Latino residents
- 3.7%Males
- 1.7%Females
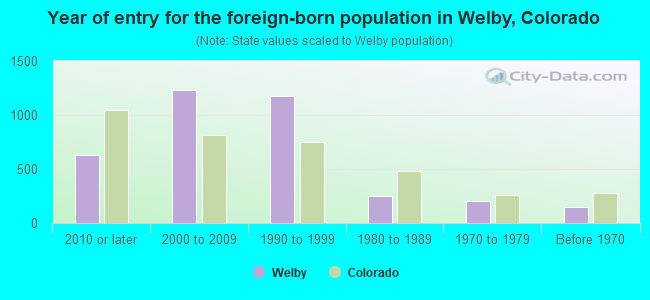
- Year of entry for the foreign-born population in Welby, Colorado
- 6302010 or later
- 1,2332000 to 2009
- 1,1791990 to 1999
- 2501980 to 1989
- 2031970 to 1979
- 144Before 1970
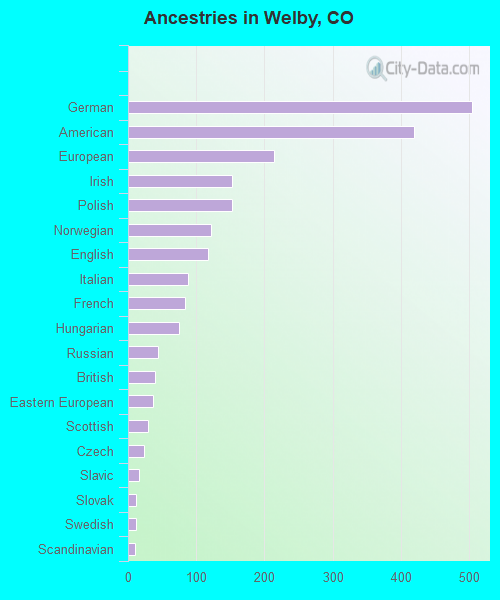
First ancestries reported:
- German: 504 (7.1%)
- American: 419 (5.9%)
- European: 214 (3.0%)
- Irish: 153 (2.2%)
- Polish: 152 (2.1%)
- Norwegian: 122 (1.7%)
- English: 117 (1.6%)
- Italian: 88 (1.2%)
- French: 84 (1.2%)
- Hungarian: 75 (1.1%)
- Russian: 44 (0.6%)
- British: 40 (0.6%)
- Eastern European: 37 (0.5%)
- Scottish: 29 (0.4%)
- Czech: 23 (0.3%)
- Slavic: 16 (0.2%)
- Slovak: 12 (0.2%)
- Swedish: 11 (0.2%)
- Scandinavian: 10 (0.1%)
Most common places of birth for foreign-born residents (%):
| Welby: | 69.4% (2,625) |
| Colorado: | 38.3% (209,491) |
| Welby: | 11.9% (451) |
| Colorado: | 1.4% (7,898) |
| Welby: | 3.3% (123) |
| Colorado: | 2.9% (15,981) |
| Welby: | 1.7% (64) |
| Colorado: | 0.5% (2,507) |
| Welby: | 1.6% (59) |
| Colorado: | 2.2% (12,150) |
| Welby: | 1.5% (57) |
| Colorado: | 0.1% (315) |
Place of birth for U.S.-born residents:
- This state: 7,842
- Other state: 4,554
- Northeast: 329
- Midwest: 1,177
- South: 899
- West: 2,165
85.0% of Welby residents lived in the same house 1 years ago.
Out of people who lived in different houses, 23.9% lived in this county.
Out of people who lived in different counties, 79.9% lived in Colorado.
| Welby: | 85.0% |
| State average: | 83.6% |
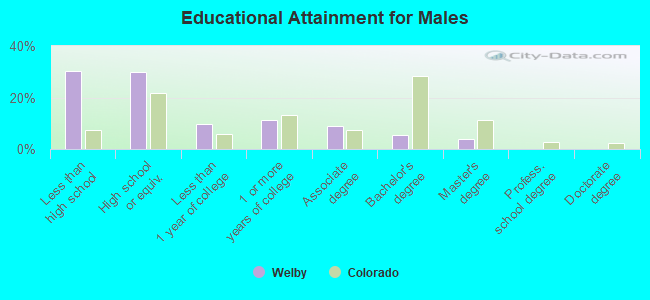
Education attainment for males 25 years and older:
- No schooling: 261
- Nursery to 4th grade: 268
- 5th and 6th grade: 135
- 7th and 8th grade: 167
- 9th grade: 261
- 10th grade: 156
- 11th grade: 174
- 12th grade, no diploma: 316
- High school graduate (or equivalency): 1,699
- Less than 1 year of college: 565
- Some college more than 1 year, no degree: 640
- Associate degree: 515
- Bachelor's degree: 319
- Master's degree: 232
- Professional school degree: 0
- Doctorate degree: 0
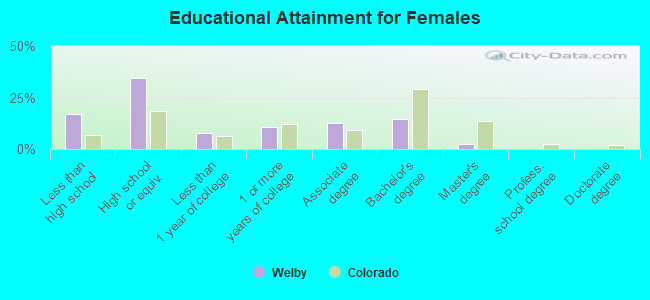
Education attainment for females 25 years and older:
- No schooling: 311
- Nursery to 4th grade: 17
- 5th and 6th grade: 148
- 7th and 8th grade: 69
- 9th grade: 109
- 10th grade: 44
- 11th grade: 13
- 12th grade, no diploma: 189
- High school graduate (or equivalency): 1,823
- Less than 1 year of college: 409
- Some college more than 1 year, no degree: 560
- Associate degree: 676
- Bachelor's degree: 775
- Master's degree: 116
- Professional school degree: 4
- Doctorate degree: 0


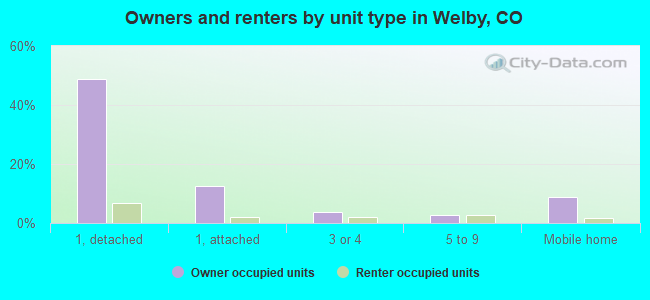
Housing units in structures:
- One, detached: 3,431
- One, attached: 736
- 3 or 4: 345
- 5 to 9: 345
- 10 to 19: 304
- 20 to 49: 462
- 50 or more: 17
- Mobile homes: 631
Median worth of mobile homes: $128,266
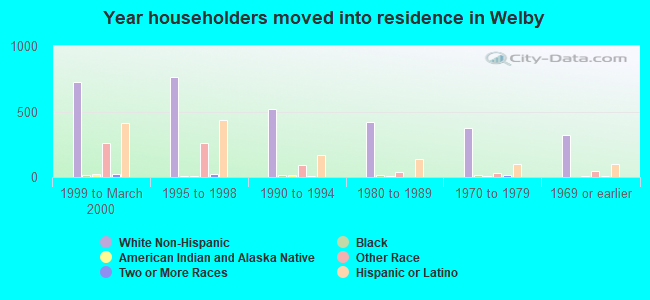
House/condo owner moved in on average 7 years ago
Renter moved in on average 3 years ago
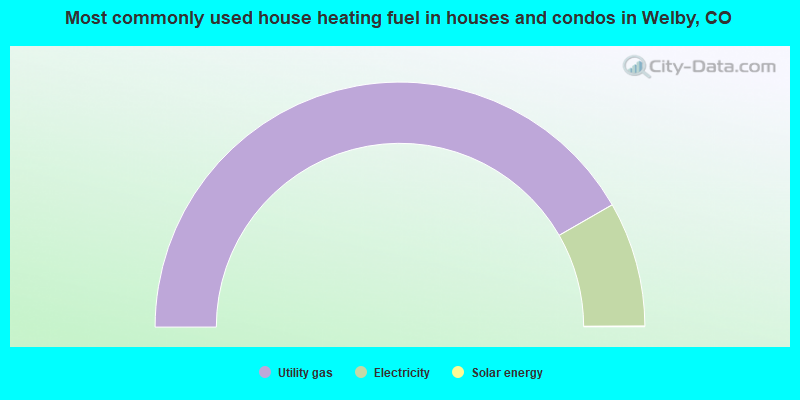
- 83.3%Utility gas
- 16.5%Electricity
- 0.1%Solar energy
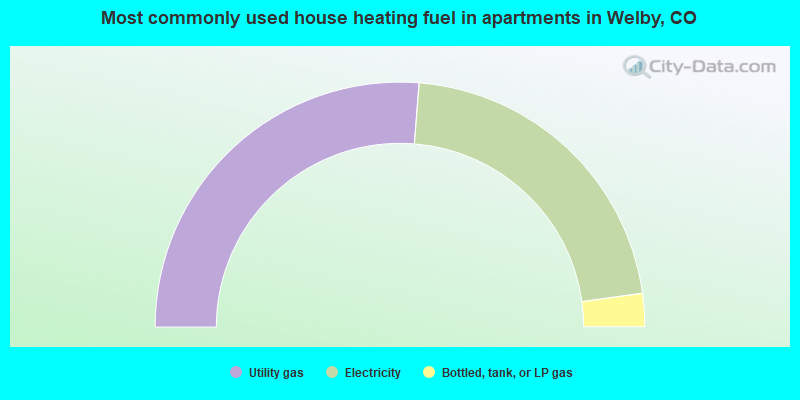
- 52.5%Utility gas
- 43.1%Electricity
- 4.4%Bottled, tank, or LP gas
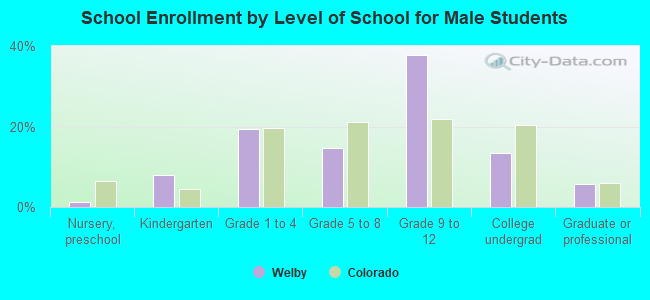
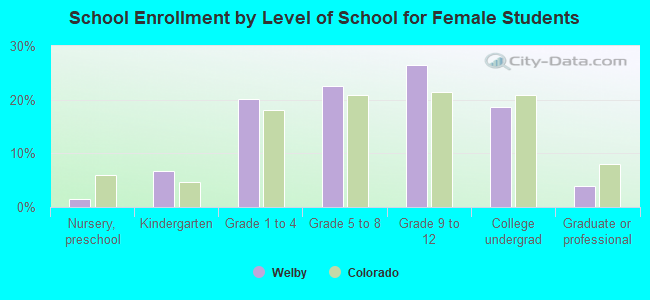
Private vs. public school enrollment:
| Here: | 9.2% |
| Colorado: | 11.4% |
| Here: | 4.3% |
| Colorado: | 8.5% |
| Here: | 20.2% |
| Colorado: | 14.0% |