Housing density: 807 houses/condos per square mile
Median price asked for vacant for-sale houses and condos in 2022 in this county: $113,595.
Median contract rent in 2022: $1,779 (lower quartile is $1,384, upper quartile is over $2,000)
Median rent asked for vacant for-rent units in 2022: $2,220
Median gross rent in Wayne, NJ in 2022: $1,825
Housing units in Wayne with a mortgage: 10,072 (1,048 second mortgage, 1,771 home equity loan, 66 both second mortgage and home equity loan) Houses without a mortgage: 3,876
In family households: 433,190 (75,969 male householders, 44,871 female householders)
81,287 spouses, 163,062 children (155,233 natural, 2,777 adopted, 5,052 stepchildren), 12,822 grandchildren, 9,893 brothers or sisters, 9,550 parents, foster children, 13,805 other relatives, 16,122 non-relatives
In nonfamily households: 57,017 (20,561 male householders (15,848 living alone)), 25,384 female householders (21,858 living alone)), 11,072 nonrelatives
In group quarters: 11,019 (3,291 institutionalized population)
79,516 married couples with children.
30,640 single-parent households (6,238 men, 24,402 women).
77.5% of residents of Wayne speak English at home.
4.5% of residents speak Spanish at home (66% speak English very well, 20% speak English well, 11% speak English not well, 2% don't speak English at all).
11.3% of residents speak other Indo-European language at home (72% speak English very well, 20% speak English well, 7% speak English not well, 1% don't speak English at all).
4.4% of residents speak Asian or Pacific Island language at home (63% speak English very well, 23% speak English well, 12% speak English not well, 2% don't speak English at all).
2.2% of residents speak other language at home (73% speak English very well, 17% speak English well, 9% speak English not well, 1% don't speak English at all).
Foreign born population: 11,030 (19.4%)
(78.8% of them are naturalized citizens)
Year of entry for the foreign-born population in Wayne, New Jersey
1,2711995 to March 2000
1,2581990 to 1994
1,0691985 to 1989
1,1061980 to 1984
6711975 to 1979
8151970 to 1974
7181965 to 1969
1,916Before 1965
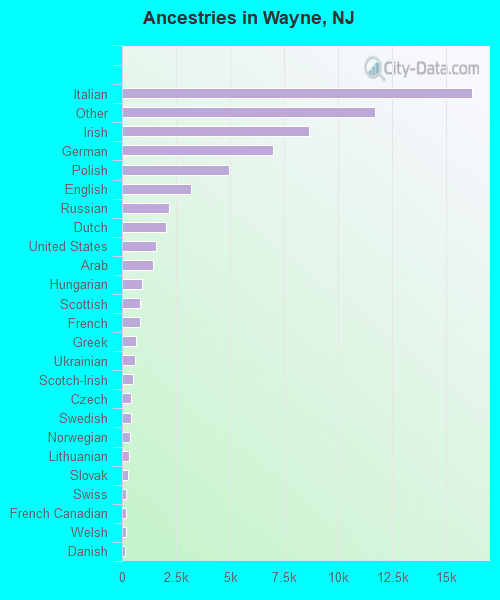
First ancestries reported:
Italian: 16,166 (24.5%)
Other: 11,720 (17.7%)
Irish: 8,632 (13.1%)
German: 6,964 (10.5%)
Polish: 4,930 (7.5%)
English: 3,177 (4.8%)
Russian: 2,185 (3.3%)
Dutch: 2,035 (3.1%)
United States: 1,588 (2.4%)
Arab: 1,448 (2.2%)
Hungarian: 932 (1.4%)
Scottish: 845 (1.3%)
French: 819 (1.2%)
Greek: 652 (1.0%)
Ukrainian: 620 (0.9%)
Scotch-Irish: 499 (0.8%)
Czech: 435 (0.7%)
Swedish: 405 (0.6%)
Norwegian: 389 (0.6%)
Lithuanian: 302 (0.5%)
Slovak: 274 (0.4%)
Swiss: 206 (0.3%)
French Canadian: 183 (0.3%)
Welsh: 179 (0.3%)
Danish: 159 (0.2%)
Portuguese: 136 (0.2%)
West Indian: 122 (0.2%)
Subsaharan African: 77 (0.1%)
Most common places of birth for foreign-born residents (%):
Italy
Wayne:
12.0% (1,060)
New Jersey:
4.0% (58,395)
India
Wayne:
8.6% (760)
New Jersey:
8.1% (119,497)
Korea
Wayne:
8.0% (710)
New Jersey:
3.5% (51,970)
Poland
Wayne:
4.5% (396)
New Jersey:
3.8% (55,466)
Other Eastern Europe
Wayne:
4.0% (349)
New Jersey:
1.2% (17,647)
Philippines
Wayne:
3.9% (343)
New Jersey:
4.7% (69,773)
Colombia
Wayne:
3.8% (336)
New Jersey:
4.7% (69,754)
Russia
Wayne:
3.4% (298)
New Jersey:
1.4% (20,243)
Germany
Wayne:
3.4% (296)
New Jersey:
2.3% (33,531)
China, excluding Hong Kong and Taiwan
Wayne:
3.0% (269)
New Jersey:
2.7% (40,092)
Syria
Wayne:
3.0% (264)
New Jersey:
0.3% (4,530)
United Kingdom
Wayne:
3.0% (262)
New Jersey:
2.1% (30,355)
Egypt
Wayne:
2.3% (203)
New Jersey:
1.4% (20,079)
Yugoslavia
Wayne:
2.0% (178)
New Jersey:
0.4% (5,697)
Romania
Wayne:
2.0% (173)
New Jersey:
0.4% (6,115)
Cuba
Wayne:
1.6% (140)
New Jersey:
3.7% (55,241)
Canada
Wayne:
1.5% (135)
New Jersey:
1.1% (16,333)
Turkey
Wayne:
1.5% (134)
New Jersey:
0.7% (9,606)
Hungary
Wayne:
1.5% (134)
New Jersey:
0.5% (7,426)
Place of birth for U.S.-born residents:
This state: 33,383
Other state: 11,497
Northeast: 9,242
Midwest: 936
South: 1,071
West: 248
66% of Wayne residents lived in the same house 5 years ago. Out of people who lived in different houses, 52% lived in this county. Out of people who lived in different counties, 67% lived in New Jersey.
Education attainment for males 25 years and older:
No schooling: 54
Nursery to 4th grade: 50
5th and 6th grade: 120
7th and 8th grade: 391
9th grade: 124
10th grade: 271
11th grade: 143
12th grade, no diploma: 347
High school graduate (or equivalency): 3,958
Less than 1 year of college: 886
Some college more than 1 year, no degree: 2,175
Associate degree: 665
Bachelor's degree: 4,818
Master's degree: 1,941
Professional school degree: 984
Doctorate degree: 284
Education attainment for females 25 years and older:
No schooling: 90
Nursery to 4th grade: 88
5th and 6th grade: 277
7th and 8th grade: 586
9th grade: 249
10th grade: 356
11th grade: 302
12th grade, no diploma: 578
High school graduate (or equivalency): 5,858
Less than 1 year of college: 1,122
Some college more than 1 year, no degree: 2,111
Associate degree: 1,000
Bachelor's degree: 4,943
Master's degree: 2,028
Professional school degree: 383
Doctorate degree: 116
Housing units in structures:
One, detached: 13,727
One, attached: 1,609
Two: 347
3 or 4: 354
5 to 9: 599
10 to 19: 658
20 to 49: 380
50 or more: 1,376
Mobile homes: 178
Median worth of mobile homes: $380,248
Housing units lacking complete plumbing facilities: 0.2%
Housing units lacking complete kitchen facilities: 0.2%