Warwick, RI (Rhode Island) Houses and Residents
| Warwick: | $317,500 |
| Rhode Island: | $383,900 |
Mean price in 2022:
Detached houses: $368,601
Here: $368,601 State: $445,354 Townhouses or other attached units: $386,389
Here: $386,389 State: $371,092 In 2-unit structures: $328,857
Here: $328,857 State: $317,098 In 3-to-4-unit structures: $209,890
Here: $209,890 State: $315,052 In 5-or-more-unit structures: $264,994
Here: $264,994 State: $291,252 Mobile homes: $110,280
Here: $110,280 State: $105,454
Total population: 81,963 (All urban)
Houses: 38,480 (37,175 occupied: 28,789 owner occupied, 8,386 renter occupied)
| % of renters here: | 23% |
| State: | 37% |
Housing density: 1,084 houses/condos per square mile
Median price asked for vacant for-sale houses and condos in 2022: $182,671.
Median contract rent in 2022: $1,049 (lower quartile is $579, upper quartile is $1,416)
Median rent asked for vacant for-rent units in 2022: $1,289
Median gross rent in Warwick, RI in 2022: $1,156
Housing units in Warwick with a mortgage: 19,818 (2,736 second mortgage, 0 home equity loan, 2,543 both second mortgage and home equity loan)
Houses without a mortgage: 867
Median household income for houses/condos with a mortgage: $99,138
Median household income for apartments without a mortgage: $71,797
Median monthly housing costs: $1,427
Compare current foreclosures in Warwick, RI:
| Photo | Address | Area | Beds / Baths | Price | Details |
|---|---|---|---|---|---|

|
#1
Pequot Ave
Warwick, RI 02889
|
1,858 sq. feet
|
2 baths 3 beds |
$290,000
|
show details |

|
#2
Scranton Ave
Warwick, RI 02888
|
1,524 sq. feet
|
2 baths 3 beds |
show details | |

|
#3
Spooner Ave
Warwick, RI 02886
|
1,777 sq. feet
|
2 baths 4 beds |
show details | |

|
#4
Pinnery Ave
Warwick, RI 02886
|
1,299 sq. feet
|
1 baths 3 beds |
show details | |

|
#5
Post Rd
Warwick, RI 02888
|
6,746 sq. feet
|
3 baths 7 beds |
show details | |

|
#6
Cove Ave
Warwick, RI 02889
|
1,314 sq. feet
|
1 baths 3 beds |
show details | |

|
#7
Park View Ave
Warwick, RI 02888
|
1,536 sq. feet
|
2 baths 4 beds |
show details | |

|
#8
Archdale Dr
Warwick, RI 02889
|
1,380 sq. feet
|
1 baths 3 beds |
show details | |

|
#9
Madison St
Warwick, RI 02888
|
1,053 sq. feet
|
1 baths 2 beds |
show details | |

|
#10
New London Ave Unit 505
Warwick, RI 02886
|
1,024 sq. feet
|
1 baths 2 beds |
show details |
| Photo | Address | Area | Beds / Baths | Price | Details |
|---|---|---|---|---|---|

|
#11
Anton Ct
Warwick, RI 02889
|
1,104 sq. feet
|
1 baths 3 beds |
show details | |

|
#12
Massachusetts Ave
Warwick, RI 02888
|
924 sq. feet
|
2 baths 2 beds |
show details | |

|
#13
Cushing Rd
Warwick, RI 02888
|
1,476 sq. feet
|
1 baths 3 beds |
show details | |

|
#14
Michigan Ave
Warwick, RI 02888
|
960 sq. feet
|
1 baths 3 beds |
show details | |

|
#15
Hull St
Warwick, RI 02888
|
1,964 sq. feet
|
2 baths 6 beds |
show details | |

|
#16
Sefton Ave
Warwick, RI 02889
|
1,008 sq. feet
|
1 baths 3 beds |
show details | |

|
#17
Tanner Ave
Warwick, RI 02886
|
1,032 sq. feet
|
1 baths 3 beds |
show details | |

|
#18
Cedar Swamp Rd
Warwick, RI 02889
|
804 sq. feet
|
2 baths 3 beds |
show details | |

|
#19
Glen Farm Ct
Warwick, RI 02889
|
1,068 sq. feet
|
2 baths 4 beds |
show details | |

|
#20
Hoxsie Ave
Warwick, RI 02889
|
1,128 sq. feet
|
2 baths 3 beds |
show details |
| Photo | Address | Area | Beds / Baths | Price | Details |
|---|---|---|---|---|---|

|
#21
Cumberland Rd
Warwick, RI 02886
|
2,200 sq. feet
|
2 baths 4 beds |
show details | |

|
#22
Cooke Pl
Warwick, RI 02888
|
1,344 sq. feet
|
1 baths 3 beds |
show details | |

|
#23
Church Ave
Warwick, RI 02889
|
1,008 sq. feet
|
1 baths 3 beds |
show details | |

|
#24
Elmbrook Dr
Warwick, RI 02889
|
1,008 sq. feet
|
1 baths 3 beds |
show details | |

|
#25
Van Zandt Ave
Warwick, RI 02889
|
800 sq. feet
|
1 baths 4 beds |
show details | |

|
#26
Troy Ave
Warwick, RI 02889
|
1,560 sq. feet
|
1 baths 3 beds |
show details | |

|
#27
Marine Ave
Warwick, RI 02888
|
1,080 sq. feet
|
2 baths 3 beds |
show details | |

|
#28
Naushon Ave
Warwick, RI 02888
|
940 sq. feet
|
1 baths 2 beds |
show details | |

|
#29
Archdale Dr
Warwick, RI 02889
|
1,032 sq. feet
|
1 baths 3 beds |
show details | |

|
#30
Hazard Ave
Warwick, RI 02889
|
1,317 sq. feet
|
1 baths 3 beds |
show details |
| Photo | Address | Area | Beds / Baths | Price | Details |
|---|---|---|---|---|---|

|
#31
N Country Club Dr
Warwick, RI 02888
|
1,000 sq. feet
|
1 baths 3 beds |
show details | |

|
#32
Oniska St
Warwick, RI 02889
|
780 sq. feet
|
1 baths 2 beds |
show details | |

|
#33
Ithica St
Warwick, RI 02889
|
1,056 sq. feet
|
1 baths 3 beds |
show details | |

|
#34
Winter Ave
Warwick, RI 02889
|
748 sq. feet
|
2 baths 3 beds |
show details | |

|
#35
Ridgeway Ave
Warwick, RI 02889
|
1,134 sq. feet
|
1 baths 3 beds |
show details | |

|
#36
Fern St
Warwick, RI 02889
|
1,645 sq. feet
|
2 baths 4 beds |
show details | |

|
#37
Killey Ave
Warwick, RI 02889
|
1,209 sq. feet
|
1 baths 3 beds |
show details | |

|
#38
Hardwick St
Warwick, RI 02889
|
1,044 sq. feet
|
1 baths 3 beds |
show details | |

|
#39
Plantation St
Warwick, RI 02886
|
1,296 sq. feet
|
1 baths 3 beds |
show details | |

|
#40
Stanmore Rd
Warwick, RI 02889
|
720 sq. feet
|
1 baths 2 beds |
show details |
| Photo | Address | Area | Beds / Baths | Price | Details |
|---|---|---|---|---|---|

|
#41
Grand Ave
Warwick, RI 02889
|
1,120 sq. feet
|
1 baths 3 beds |
show details | |

|
#42
Easton Ave
Warwick, RI 02888
|
1,066 sq. feet
|
1 baths 3 beds |
show details | |

|
#43
Shawomet Ave
Warwick, RI 02889
|
2,315 sq. feet
|
2 baths 5 beds |
show details | |

|
#44
Haswill St
Warwick, RI 02889
|
988 sq. feet
|
1 baths 3 beds |
show details | |

|
#45
Mckinley St
Warwick, RI 02886
|
- sq. feet
|
- baths - beds |
show details | |

|
#46
Quaker Ln Unit 5
Warwick, RI 02886
|
- sq. feet
|
- baths - beds |
show details | |

|
#47
Arnolds Neck Dr
Warwick, RI 02886
|
- sq. feet
|
- baths - beds |
show details | |

|
#48
Post Rd Apt 22304
Warwick, RI 02886
|
- sq. feet
|
- baths - beds |
show details | |

|
#49
Walton Ave
Warwick, RI 02886
|
- sq. feet
|
- baths - beds |
show details | |

|
Check over 1 million property listings on Foreclosure.com!
|
browse all offers | |||

Latest news about housing in Warwick, RI collected exclusively by city-data.com from local newspapers, TV, and radio stations


Median year apartment built: 1972
Household type by relationship:
Households: 83,024- Male householders: 16,759 (5,666 living alone), Female householders: 20,416 (6,986 living alone)
14,612 spouses (14,340 opposite-sex spouses), 4,989 unmarried partners, (4,528 opposite-sex unmarried partners), 19,141 children (16,973 natural, 364 adopted, 1,804 stepchildren), 2,467 grandchildren, 797 brothers or sisters, 1,228 parents, 80 foster children, 684 other relatives, 944 non-relatives
- In group quarters: 907
Size of family households: 8,709 2-persons, 5,264 3-persons, 4,117 4-persons, 2,159 5-persons, 287 6-persons, 402 7-or-more-persons.
Size of nonfamily households: 12,652 1-person, 3,505 2-persons, 80 3-persons.
8,887 married couples with children.
3,503 single-parent households (840 men, 2,663 women).
91.9% of residents of Warwick speak English at home.
2.7% of residents speak Spanish at home (58% speak English very well, 19% speak English well, 22% speak English not well, 2% don't speak English at all).
3.4% of residents speak other Indo-European language at home (66% speak English very well, 30% speak English well, 3% speak English not well, 1% don't speak English at all).
1.8% of residents speak Asian or Pacific Island language at home (73% speak English very well, 22% speak English well, 5% speak English not well).
0.4% of residents speak other language at home (87% speak English very well, 13% speak English well).
Foreign born population: 5,640 (6.8%)
(65.7% of them are naturalized citizens)
| Here: | 5.9 |
| State: | 6.2 |
| Here: | 3.4 |
| State: | 4.1 |

- Bedrooms in owner-occupied houses and condos in Warwick, Rhode Island
- 567no bedroom
- 1,0701 bedroom
- 7,8232 bedrooms
- 13,7423 bedrooms
- 5,0764 bedrooms
- 5115+ bedrooms

- Bedrooms in renter-occupied apartments in Warwick, Rhode Island
- 697no bedroom
- 4,2951 bedroom
- 2,8682 bedrooms
- 4603 bedrooms
- 264 bedrooms
- 405+ bedrooms

- Cars and other vehicles available in Warwick in owner-occupied houses/condos
- 523no vehicle
- 9,7231 vehicle
- 11,2462 vehicles
- 5,5273 vehicles
- 1,4544 vehicles
- 3165+ vehicles

- Cars and other vehicles available in Warwick in renter-occupied apartments
- 1,355no vehicle
- 5,2741 vehicle
- 1,5222 vehicles
- 1173 vehicles
- 1184 vehicles
- 05+ vehicles

- Rooms in owner-occupied houses in Warwick, Rhode Island
- 5671 room
- 02 rooms
- 8853 rooms
- 3,8944 rooms
- 6,3145 rooms
- 6,8776 rooms
- 4,1177 rooms
- 4,0188 rooms
- 2,1179+ rooms

- Rooms in renter-occupied apartments in Warwick, Rhode Island
- 4691 room
- 7162 rooms
- 3,2933 rooms
- 1,9264 rooms
- 1,3275 rooms
- 5896 rooms
- 07 rooms
- 08 rooms
- 669+ rooms


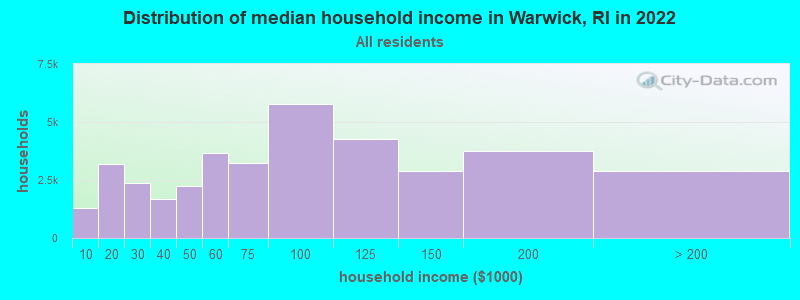
Warwick, RI household income distribution

- 1,277Less than $10,000
- 3,179$10,000 to $19,999
- 2,383$20,000 to $29,999
- 1,696$30,000 to $39,999
- 2,245$40,000 to $49,999
- 3,658$50,000 to $59,999
- 3,217$60,000 to $74,999
- 5,760$75,000 to $99,999
- 4,253$100,000 to $124,999
- 2,877$125,000 to $149,999
- 3,754$150,000 to $199,999
- 2,876$200,000 or more
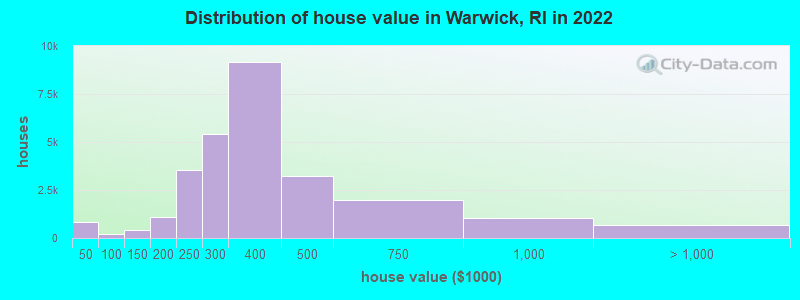
Home value of owner - occupied houses in 2022 in Warwick, RI
-
- 161Less than $10,000
- 76$10,000 to $14,999
- 84$15,000 to $19,999
- 161$20,000 to $24,999
- 155$25,000 to $29,999
- 58$30,000 to $34,999
- 11$35,000 to $39,999
- 110$40,000 to $49,999
- 12$50,000 to $59,999
- 9$60,000 to $69,999
- 21$70,000 to $79,999
- 24$80,000 to $89,999
- 23$90,000 to $99,999
- 172$100,000 to $124,999
- 240$125,000 to $149,999
- 474$150,000 to $174,999
- 645$175,000 to $199,999
- 3,532$200,000 to $249,999
- 5,415$250,000 to $299,999
- 9,192$300,000 to $399,999
- 3,205$400,000 to $499,999
- 1,995$500,000 to $749,999
- 1,052$750,000 to $999,999
- 520$1,000,000 to $1,499,999
- 31$1,500,000 to $1,999,999
- 101$2,000,000 or more
Rent paid by renters in 2022 in Warwick, RI
-
- 118$100 to $149
- 58$150 to $199
- 309$200 to $249
- 535$250 to $299
- 268$300 to $349
- 284$350 to $399
- 223$400 to $449
- 185$450 to $499
- 19$500 to $549
- 197$550 to $599
- 94$600 to $649
- 40$650 to $699
- 134$700 to $749
- 184$750 to $799
- 343$800 to $899
- 484$900 to $999
- 1,872$1,000 to $1,249
- 1,496$1,250 to $1,499
- 1,841$1,500 to $1,999
- 153$2,000 to $2,499
- 21$2,500 to $2,999
- 31$3,500 or more
- 229No cash rent


Percentage of workers working in this county: 48.6%
Number of people working at home: 5,401 (12.7% of all workers)
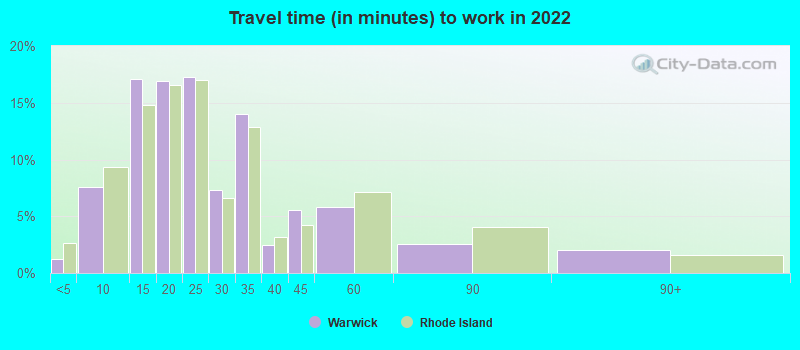
Travel time to work (commute)
- Less than 5 minutes: 639
- 5 to 9 minutes: 2,177
- 10 to 14 minutes: 6,510
- 15 to 19 minutes: 5,185
- 20 to 24 minutes: 7,035
- 25 to 29 minutes: 2,193
- 30 to 34 minutes: 4,262
- 35 to 39 minutes: 1,024
- 40 to 44 minutes: 1,645
- 45 to 59 minutes: 2,453
- 60 to 89 minutes: 1,754
- 90 or more minutes: 1,376

Means of transportation to work:
- Drove a car alone: 38,943 (77.0%)
- Carpooled: 4,010 (7.9%)
- Bus: 260 (0.5%)
- Taxi: 806 (1.6%)
- Bicycle: 62 (0.1%)
- Walked: 621 (1.2%)
- Worked at home: 5,401 (10.7%)

- Unemployment by race in 2022
- Unemployment rate for White non-Hispanic residents
- 2.5%Males
- 6.9%Females
- Unemployment rate for Black residents
- 4.3%Males
- 16.4%Females
- Unemployment rate for Asian residents
- 1.5%Females
- Unemployment rate for other race residents
- 9.5%Females
- Unemployment rate for two or more race residents
- 7.3%Males
- 8.4%Females
- Unemployment rate for Hispanic or Latino residents
- 1.5%Males
- 6.2%Females

- Year of entry for the foreign-born population in Warwick, Rhode Island
- 1,8822010 or later
- 1,0342000 to 2009
- 8491990 to 1999
- 7251980 to 1989
- 9751970 to 1979
- 1,503Before 1970
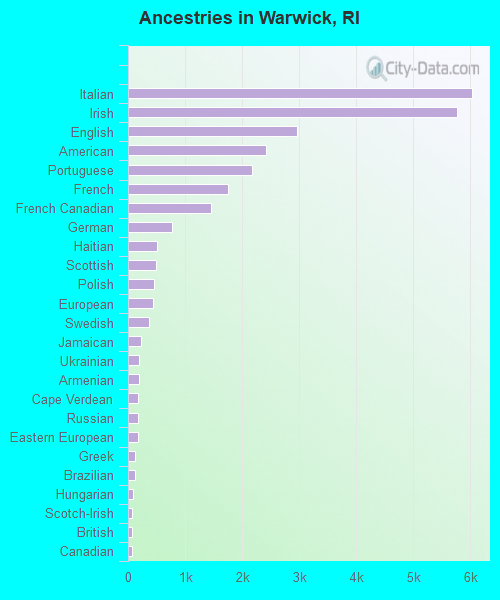
First ancestries reported:
- Italian: 6,028 (17.5%)
- Irish: 5,765 (16.7%)
- English: 2,965 (8.6%)
- American: 2,422 (7.0%)
- Portuguese: 2,167 (6.3%)
- French: 1,752 (5.1%)
- French Canadian: 1,463 (4.2%)
- German: 766 (2.2%)
- Haitian: 506 (1.5%)
- Scottish: 498 (1.4%)
- Polish: 451 (1.3%)
- European: 446 (1.3%)
- Swedish: 373 (1.1%)
- Jamaican: 230 (0.7%)
- Ukrainian: 195 (0.6%)
- Armenian: 185 (0.5%)
- Cape Verdean: 178 (0.5%)
- Russian: 177 (0.5%)
- Eastern European: 170 (0.5%)
- Greek: 129 (0.4%)
- Brazilian: 114 (0.3%)
- Hungarian: 79 (0.2%)
- Scotch-Irish: 74 (0.2%)
- British: 69 (0.2%)
- Canadian: 64 (0.2%)
- Nigerian: 62 (0.2%)
- Moroccan: 58 (0.2%)
- Liberian: 50 (0.1%)
- Senegalese: 49 (0.1%)
- Syrian: 44 (0.1%)
- Scandinavian: 40 (0.1%)
- Lebanese: 38 (0.1%)
- Croatian: 35 (0.1%)
- Lithuanian: 33 (0.10%)
- Albanian: 28 (0.08%)
- Romanian: 28 (0.08%)
- Swiss: 28 (0.08%)
- Egyptian: 27 (0.08%)
- Norwegian: 26 (0.08%)
- Cypriot: 24 (0.07%)
- Czech: 22 (0.06%)
- Dutch: 20 (0.06%)
- Icelander: 18 (0.05%)
- Slovak: 17 (0.05%)
- Northern European: 16 (0.05%)
- Iranian: 14 (0.04%)
- Bahamian: 13 (0.04%)
- Celtic: 11 (0.03%)
- Palestinian: 11 (0.03%)
- African: 9 (0.03%)
- South African: 7 (0.02%)
- Austrian: 5 (0.01%)
- Belgian: 3 (0.01%)
Most common places of birth for foreign-born residents (%):
| Warwick: | 15.7% (865) |
| Rhode Island: | 4.1% (6,461) |
| Warwick: | 9.4% (521) |
| Rhode Island: | 10.0% (15,766) |
| Warwick: | 8.3% (456) |
| Rhode Island: | 1.9% (3,057) |
| Warwick: | 5.3% (291) |
| Rhode Island: | 21.0% (33,163) |
| Warwick: | 5.1% (280) |
| Rhode Island: | 1.7% (2,625) |
| Warwick: | 4.8% (267) |
| Rhode Island: | 10.4% (16,385) |
| Warwick: | 3.2% (175) |
| Rhode Island: | 2.4% (3,836) |
| Warwick: | 3.0% (164) |
| Rhode Island: | 1.3% (2,091) |
| Warwick: | 2.3% (127) |
| Rhode Island: | 0.7% (1,165) |
| Warwick: | 2.2% (119) |
| Rhode Island: | 2.4% (3,822) |
| Warwick: | 2.1% (117) |
| Rhode Island: | 1.2% (1,902) |
| Warwick: | 2.1% (114) |
| Rhode Island: | 0.6% (895) |
| Warwick: | 2.0% (112) |
| Rhode Island: | 0.4% (637) |
| Warwick: | 1.9% (107) |
| Rhode Island: | 1.7% (2,654) |
| Warwick: | 1.9% (105) |
| Rhode Island: | 0.5% (769) |
| Warwick: | 1.8% (100) |
| Rhode Island: | 1.8% (2,826) |
| Warwick: | 1.8% (100) |
| Rhode Island: | 0.7% (1,051) |
| Warwick: | 1.8% (99) |
| Rhode Island: | 1.4% (2,155) |
| Warwick: | 1.6% (90) |
| Rhode Island: | 1.5% (2,304) |
| Warwick: | 1.6% (88) |
| Rhode Island: | 0.6% (954) |
| Warwick: | 1.6% (87) |
| Rhode Island: | 4.1% (6,520) |
Place of birth for U.S.-born residents:
- This state: 55,663
- Other state: 21,271
- Northeast: 12,526
- Midwest: 1,673
- South: 4,275
- West: 2,797
91.0% of Warwick residents lived in the same house 1 years ago.
Out of people who lived in different houses, 20.7% lived in this county.
Out of people who lived in different counties, 61.3% lived in Rhode Island.
| Warwick: | 91.0% |
| State average: | 89.3% |
Education attainment for males 25 years and older:
- No schooling: 270
- Nursery to 4th grade: 0
- 5th and 6th grade: 178
- 7th and 8th grade: 415
- 9th grade: 234
- 10th grade: 345
- 11th grade: 389
- 12th grade, no diploma: 632
- High school graduate (or equivalency): 8,087
- Less than 1 year of college: 3,405
- Some college more than 1 year, no degree: 4,417
- Associate degree: 3,631
- Bachelor's degree: 7,113
- Master's degree: 1,606
- Professional school degree: 531
- Doctorate degree: 201

Education attainment for females 25 years and older:
- No schooling: 248
- Nursery to 4th grade: 0
- 5th and 6th grade: 27
- 7th and 8th grade: 385
- 9th grade: 88
- 10th grade: 355
- 11th grade: 346
- 12th grade, no diploma: 149
- High school graduate (or equivalency): 7,981
- Less than 1 year of college: 3,052
- Some college more than 1 year, no degree: 5,638
- Associate degree: 3,270
- Bachelor's degree: 6,430
- Master's degree: 3,401
- Professional school degree: 486
- Doctorate degree: 416


Housing units in structures:
- One, detached: 27,073
- One, attached: 835
- Two: 915
- 3 or 4: 2,289
- 5 to 9: 711
- 10 to 19: 2,023
- 20 to 49: 1,258
- 50 or more: 3,028
- Mobile homes: 348
Housing units lacking complete kitchen facilities in 2022: 1.1%
House/condo owner moved in on average 14 years ago
Renter moved in on average 3 years ago


- 67.9%Utility gas
- 24.0%Fuel oil, kerosene, etc.
- 5.1%Electricity
- 1.5%Bottled, tank, or LP gas
- 0.8%Wood
- 0.4%Other fuel
- 0.2%Solar energy
- 0.2%No fuel used
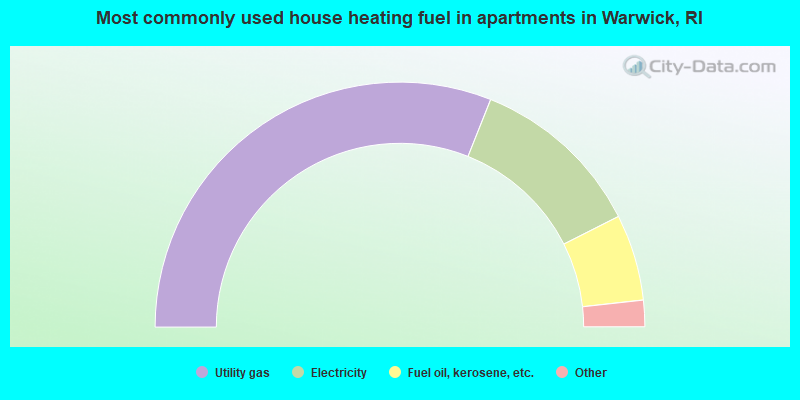
- 62.1%Utility gas
- 23.0%Electricity
- 11.4%Fuel oil, kerosene, etc.
- 1.9%Bottled, tank, or LP gas
- 0.6%No fuel used
- 0.5%Wood
- 0.3%Other fuel
- 0.2%Solar energy
Private vs. public school enrollment:
| Here: | 19.8% |
| Rhode Island: | 12.2% |
| Here: | 10.6% |
| Rhode Island: | 11.6% |
| Here: | 18.0% |
| Rhode Island: | 41.1% |


