Walnut Grove, WA (Washington) Houses and Residents
| Walnut Grove: | $507,362 |
| Washington: | $569,500 |
Mean price in 2022:
Detached houses: $354,079
Here: $354,079 State: $734,307 Townhouses or other attached units: $344,368
Here: $344,368 State: $657,697 Mobile homes: $72,456
Here: $72,456 State: $218,362
Total population: 9,790 (Urban population: 7,261, Rural population: 0)
Houses: 4,549 (4,351 occupied: 3,134 owner occupied, 1,293 renter occupied)
| % of renters here: | 29% |
| State: | 36% |
Housing density: 1,201 houses/condos per square mile
Median price asked for vacant for-sale houses and condos in 2022 in this county: $858,483.
Median contract rent in 2022: $1,771 (lower quartile is $1,419, upper quartile is over $2,000)
Median rent asked for vacant for-rent units in 2022: $1,516
Median gross rent in Walnut Grove, WA in 2022: $1,892
Housing units in Walnut Grove with a mortgage: 2,032 (23 second mortgage, 124 home equity loan, 0 both second mortgage and home equity loan)
Houses without a mortgage: 1,047
Median household income for houses/condos with a mortgage: $106,186
Median household income for apartments without a mortgage: $63,319
Median monthly housing costs: $1,857
Compare current foreclosures near Walnut Grove, WA:
| Photo | Address | Area | Beds / Baths | Price | Details |
|---|---|---|---|---|---|

|
#1
SE 116th Ave
Portland, OR 97266
|
1,678 sq. feet
|
1 baths 4 beds |
$485,000
|
show details |

|
#2
SW 1st Ave Apt 2125
Portland, OR 97201
|
1,950 sq. feet
|
2 baths 3 beds |
$695,000
|
show details |

|
#3
NE 121st Ave Apt E27
Vancouver, WA 98682
|
1,078 sq. feet
|
2 baths 2 beds |
show details | |

|
#4
Bird Rd
Scappoose, OR 97056
|
11 sq. feet
|
- baths - beds |
$105,000
|
show details |

|
#5
W Burnside Rd Unit 527
Portland, OR 97210
|
1,288 sq. feet
|
2 baths 2 beds |
show details | |

|
#6
SE Stephens St
Portland, OR 97233
|
2,200 sq. feet
|
1 baths 3 beds |
show details | |

|
#7
NW Brooks Rd
Portland, OR 97231
|
2,058 sq. feet
|
4 baths 4 beds |
show details | |

|
#8
NE 149th Pl
Portland, OR 97230
|
1,524 sq. feet
|
3 baths 3 beds |
show details | |

|
#9
Carlson Rd
Vancouver, WA 98661
|
1,032 sq. feet
|
1 baths 3 beds |
show details | |

|
#10
SE Rainbow Ln
Portland, OR 97222
|
1,496 sq. feet
|
2 baths 4 beds |
show details |
| Photo | Address | Area | Beds / Baths | Price | Details |
|---|---|---|---|---|---|

|
#11
NE 130th Pl
Portland, OR 97230
|
- sq. feet
|
3 baths 4 beds |
show details | |

|
#12
NE 109th St
Vancouver, WA 98686
|
1,432 sq. feet
|
2 baths 3 beds |
show details | |

|
#13
SE 17th Way
Vancouver, WA 98683
|
1,446 sq. feet
|
3 baths 3 beds |
show details | |

|
#14
NE Liberty Ct
Portland, OR 97211
|
2,257 sq. feet
|
3 baths 3 beds |
show details | |

|
#15
Norris Rd
Vancouver, WA 98661
|
1,116 sq. feet
|
1 baths 3 beds |
show details | |

|
#16
E 24th St
Vancouver, WA 98661
|
720 sq. feet
|
1 baths 2 beds |
show details | |

|
#17
SE Sunset View Rd
Washougal, WA 98671
|
1,448 sq. feet
|
1 baths 4 beds |
show details | |

|
#18
NE Mallory Ave
Portland, OR 97211
|
2,118 sq. feet
|
2 baths 5 beds |
show details | |

|
#19
Ne22nd St
Vancouver, WA 98664
|
1,295 sq. feet
|
2 baths 2 beds |
show details | |

|
#20
NE Sitka Dr
Camas, WA 98607
|
2,312 sq. feet
|
2 baths 4 beds |
show details |
| Photo | Address | Area | Beds / Baths | Price | Details |
|---|---|---|---|---|---|

|
#21
SE 86th Ave
Portland, OR 97266
|
1,033 sq. feet
|
1 baths 2 beds |
show details | |

|
#22
NE Flanders St
Portland, OR 97230
|
1,166 sq. feet
|
2 baths 3 beds |
show details | |

|
#23
NE Holman St
Portland, OR 97218
|
1,272 sq. feet
|
2 baths 2 beds |
show details | |

|
#24
NE 111th St
Vancouver, WA 98686
|
2,015 sq. feet
|
2 baths 4 beds |
show details | |

|
#25
NE Morrow Rd
Vancouver, WA 98682
|
1,808 sq. feet
|
2 baths 5 beds |
show details | |

|
#26
SE 40th St
Troutdale, OR 97060
|
2,174 sq. feet
|
3 baths 4 beds |
show details | |

|
#27
NE 23rd Ave
Vancouver, WA 98663
|
1,280 sq. feet
|
1 baths 3 beds |
show details | |

|
#28
SW Charity Ct
Troutdale, OR 97060
|
1,493 sq. feet
|
2 baths 2 beds |
show details | |

|
#29
NE 77th Ave
Vancouver, WA 98664
|
1,094 sq. feet
|
2 baths 2 beds |
show details | |

|
#30
NE 22nd Ct
Vancouver, WA 98665
|
3,073 sq. feet
|
4 baths 5 beds |
show details |
| Photo | Address | Area | Beds / Baths | Price | Details |
|---|---|---|---|---|---|

|
#31
NE 18th St
Gresham, OR 97030
|
943 sq. feet
|
1 baths 3 beds |
show details | |

|
#32
Parkwood Dr
Saint Helens, OR 97051
|
2,372 sq. feet
|
2 baths 5 beds |
show details | |

|
#33
NW 5th Ave
Battle Ground, WA 98604
|
1,547 sq. feet
|
1 baths 3 beds |
show details | |

|
#34
7th St
Washougal, WA 98671
|
1,644 sq. feet
|
1 baths 4 beds |
show details | |

|
#35
SE 76th Ave
Portland, OR 97206
|
1,504 sq. feet
|
1 baths 2 beds |
show details | |

|
#36
NE 16th St
Vancouver, WA 98664
|
- sq. feet
|
2 baths 3 beds |
show details | |

|
#37
NE River Point Cir
Portland, OR 97211
|
2,946 sq. feet
|
2 baths 4 beds |
show details | |

|
#38
SE Flavel Dr
Portland, OR 97236
|
2,218 sq. feet
|
2 baths 3 beds |
show details | |

|
#39
NE 162nd Ave
Portland, OR 97230
|
1,073 sq. feet
|
2 baths 3 beds |
show details | |

|
#40
SE James St
Camas, WA 98607
|
840 sq. feet
|
1 baths 2 beds |
show details |
| Photo | Address | Area | Beds / Baths | Price | Details |
|---|---|---|---|---|---|

|
#41
NW Galaxy St
Camas, WA 98607
|
1,950 sq. feet
|
1 baths 3 beds |
show details | |

|
#42
NE 32nd St
Vancouver, WA 98682
|
1,094 sq. feet
|
2 baths 3 beds |
show details | |

|
#43
NE 113th Ave
Portland, OR 97220
|
1,118 sq. feet
|
2 baths 3 beds |
show details | |

|
#44
NE Klickitat St
Portland, OR 97230
|
1,693 sq. feet
|
1 baths 3 beds |
show details | |

|
#45
SE 33rd St
Troutdale, OR 97060
|
1,464 sq. feet
|
2 baths 3 beds |
show details | |

|
#46
NE 141st Ave
Portland, OR 97230
|
1,700 sq. feet
|
2 baths 3 beds |
show details | |

|
#47
SE Yamhill St
Portland, OR 97233
|
- sq. feet
|
2 baths 2 beds |
show details | |

|
#48
SE Winworth Ct
Portland, OR 97222
|
918 sq. feet
|
1 baths 2 beds |
show details | |

|
#49
SE Franklin St
Portland, OR 97236
|
1,618 sq. feet
|
2 baths 3 beds |
show details | |

|
Check over 1 million property listings on Foreclosure.com!
|
browse all offers | |||

 | I got sticker shock by Vancouver housing price (28 replies) |
| What do you think about Orchards area? (23 replies) |
| Moving to Vancouver area in mid January from TN. (33 replies) |
| Any advice in purchasing here... ? (23 replies) |
| Ridgefield vs La Center vs Battleground (8 replies) |
| Good/bad input about Walnut Grove area in Vancouver, WA (5 replies) |

Median year apartment built: 1997
Household type by relationship:
Households: 10,278- In family households: 8,427 (1,431 male householders, 1,211 female householders)
1,979 spouses, 2,818 children (2,594 natural, 69 adopted, 154 stepchildren), 198 grandchildren, 69 brothers or sisters, 200 parents, 0 foster children, 168 other relatives, 349 non-relatives
- In nonfamily households: 1,841 (831 male householders (713 living alone)), 630 female householders (512 living alone)), 379 nonrelatives
- In group quarters: 9
Size of family households: 1,145 2-persons, 763 3-persons, 512 4-persons, 247 5-persons, 64 6-persons, 48 7-or-more-persons.
Size of nonfamily households: 1,290 1-person, 187 2-persons, 165 3-persons.
1,471 married couples with children.
316 single-parent households (122 men, 194 women).
79.2% of residents of Walnut Grove speak English at home.
4.8% of residents speak Spanish at home (59% speak English very well, 16% speak English well, 21% speak English not well, 4% don't speak English at all).
10.1% of residents speak other Indo-European language at home (43% speak English very well, 30% speak English well, 26% speak English not well, 1% don't speak English at all).
6.4% of residents speak Asian or Pacific Island language at home (53% speak English very well, 18% speak English well, 26% speak English not well, 2% don't speak English at all).
0.2% of residents speak other language at home (100% speak English very well).
Foreign born population: 1,842 (16.7%)
(53.0% of them are naturalized citizens)
| Here: | 5.9 |
| State: | 6.5 |
| Here: | 4.6 |
| State: | 3.9 |

- Bedrooms in owner-occupied houses and condos in Walnut Grove, Washington
- 0no bedroom
- 221 bedroom
- 3082 bedrooms
- 2,1443 bedrooms
- 5104 bedrooms
- 1505+ bedrooms

- Bedrooms in renter-occupied apartments in Walnut Grove, Washington
- 66no bedroom
- 3741 bedroom
- 2112 bedrooms
- 5273 bedrooms
- 1064 bedrooms
- 95+ bedrooms

- Cars and other vehicles available in Walnut Grove in owner-occupied houses/condos
- 18no vehicle
- 1,0531 vehicle
- 1,2032 vehicles
- 5913 vehicles
- 1784 vehicles
- 925+ vehicles

- Cars and other vehicles available in Walnut Grove in renter-occupied apartments
- 238no vehicle
- 4631 vehicle
- 3382 vehicles
- 913 vehicles
- 1314 vehicles
- 325+ vehicles

- Rooms in owner-occupied houses in Walnut Grove, Washington
- 01 room
- 02 rooms
- 663 rooms
- 4174 rooms
- 7735 rooms
- 7626 rooms
- 4297 rooms
- 3048 rooms
- 3839+ rooms

- Rooms in renter-occupied apartments in Walnut Grove, Washington
- 661 room
- 442 rooms
- 2483 rooms
- 2274 rooms
- 3665 rooms
- 1406 rooms
- 1047 rooms
- 498 rooms
- 499+ rooms


Walnut Grove, WA household income distribution

- 137Less than $10,000
- 245$10,000 to $19,999
- 125$20,000 to $29,999
- 208$30,000 to $39,999
- 332$40,000 to $49,999
- 368$50,000 to $59,999
- 494$60,000 to $74,999
- 704$75,000 to $99,999
- 630$100,000 to $124,999
- 198$125,000 to $149,999
- 328$150,000 to $199,999
- 290$200,000 or more
Home value of owner - occupied houses in 2022 in Walnut Grove, WA
-
- 23Less than $10,000
- 8$10,000 to $14,999
- 10$15,000 to $19,999
- 5$20,000 to $24,999
- 14$25,000 to $29,999
- 7$30,000 to $34,999
- 16$40,000 to $49,999
- 6$70,000 to $79,999
- 6$80,000 to $89,999
- 2$100,000 to $124,999
- 13$125,000 to $149,999
- 52$150,000 to $174,999
- 106$175,000 to $199,999
- 316$200,000 to $249,999
- 313$250,000 to $299,999
- 390$300,000 to $399,999
- 191$400,000 to $499,999
- 175$500,000 to $749,999
- 55$2,000,000 or more
Rent paid by renters in 2022 in Walnut Grove, WA
-
- 29$200 to $249
- 19$300 to $349
- 1$450 to $499
- 3$500 to $549
- 11$550 to $599
- 2$650 to $699
- 6$700 to $749
- 12$750 to $799
- 33$800 to $899
- 36$900 to $999
- 181$1,000 to $1,249
- 272$1,250 to $1,499
- 586$1,500 to $1,999
- 649$2,000 to $2,499
- 228$3,000 to $3,499
- 148$3,500 or more
- 32No cash rent


Percentage of workers working in this county: 71.2%
Number of people working at home: 876 (15.8% of all workers)
Travel time to work (commute)
- Less than 5 minutes: 24
- 5 to 9 minutes: 470
- 10 to 14 minutes: 664
- 15 to 19 minutes: 981
- 20 to 24 minutes: 690
- 25 to 29 minutes: 299
- 30 to 34 minutes: 638
- 35 to 39 minutes: 50
- 40 to 44 minutes: 146
- 45 to 59 minutes: 316
- 60 to 89 minutes: 256
- 90 or more minutes: 86
Means of transportation to work:
- Drove a car alone: 3,259 (78.5%)
- Carpooled: 254 (6.1%)
- Bicycle: 26 (0.6%)
- Walked: 2 (0.0%)
- Worked at home: 669 (16.1%)

- Unemployment by race in 2022
- Unemployment rate for White non-Hispanic residents
- 4.3%Males
- 3.1%Females
- Unemployment rate for Asian residents
- 20.5%Females
- Unemployment rate for two or more race residents
- 20.3%Males
- Unemployment rate for Hispanic or Latino residents
- 4.4%Males

- Year of entry for the foreign-born population in Walnut Grove, Washington
- 6772010 or later
- 5102000 to 2009
- 3521990 to 1999
- 1741980 to 1989
- 461970 to 1979
- 111Before 1970

First ancestries reported:
- Ukrainian: 646 (13.3%)
- German: 367 (7.5%)
- English: 218 (4.5%)
- Irish: 210 (4.3%)
- American: 199 (4.1%)
- Italian: 176 (3.6%)
- Norwegian: 139 (2.9%)
- Northern European: 119 (2.4%)
- European: 104 (2.1%)
- African: 71 (1.5%)
- Russian: 61 (1.3%)
- Swedish: 53 (1.1%)
- Scandinavian: 44 (0.9%)
- British: 41 (0.8%)
- Scottish: 39 (0.8%)
- Scotch-Irish: 37 (0.8%)
- French Canadian: 36 (0.7%)
- Assyrian: 32 (0.7%)
- Romanian: 31 (0.6%)
- Finnish: 29 (0.6%)
- Polish: 28 (0.6%)
- Greek: 25 (0.5%)
- Dutch: 23 (0.5%)
- French: 19 (0.4%)
- South African: 17 (0.3%)
- Yugoslavian: 16 (0.3%)
- Welsh: 13 (0.3%)
- Canadian: 12 (0.2%)
- Lithuanian: 10 (0.2%)
- Iranian: 10 (0.2%)
- Swiss: 9 (0.2%)
- Czech: 8 (0.2%)
- Hungarian: 7 (0.1%)
- Danish: 6 (0.1%)
- Latvian: 6 (0.1%)
Most common places of birth for foreign-born residents (%):
| Walnut Grove: | 33.5% (533) |
| Washington: | 100.0% (-1) |
| Walnut Grove: | 11.9% (189) |
| Washington: | 100.0% (-1) |
| Walnut Grove: | 7.0% (112) |
| Washington: | 100.0% (-1) |
| Walnut Grove: | 5.5% (88) |
| Washington: | 100.0% (-1) |
| Walnut Grove: | 4.3% (69) |
| Washington: | 100.0% (-1) |
| Walnut Grove: | 4.0% (63) |
| Washington: | 100.0% (-1) |
| Walnut Grove: | 3.5% (55) |
| Washington: | 100.0% (-1) |
| Walnut Grove: | 3.5% (55) |
| Washington: | 100.0% (-1) |
| Walnut Grove: | 3.1% (50) |
| Washington: | 100.0% (-1) |
| Walnut Grove: | 2.1% (33) |
| Washington: | 100.0% (-1) |
| Walnut Grove: | 1.7% (27) |
| Washington: | 100.0% (-1) |
| Walnut Grove: | 1.7% (27) |
| Washington: | 100.0% (-1) |
| Walnut Grove: | 1.5% (24) |
| Washington: | 100.0% (-1) |
Place of birth for U.S.-born residents:
- This state: 3,470
- Other state: 5,597
- Northeast: 280
- Midwest: 763
- South: 520
- West: 4,057
86.6% of Walnut Grove residents lived in the same house 1 years ago.
Out of people who lived in different houses, 43.5% lived in this county.
Out of people who lived in different counties, 22.8% lived in Washington.
| Walnut Grove: | 86.6% |
| State average: | 85.2% |
Education attainment for males 25 years and older:
- No schooling: 64
- Nursery to 4th grade: 32
- 5th and 6th grade: 53
- 7th and 8th grade: 8
- 9th grade: 3
- 10th grade: 50
- 11th grade: 52
- 12th grade, no diploma: 57
- High school graduate (or equivalency): 1,099
- Less than 1 year of college: 325
- Some college more than 1 year, no degree: 829
- Associate degree: 436
- Bachelor's degree: 789
- Master's degree: 217
- Professional school degree: 59
- Doctorate degree: 28

Education attainment for females 25 years and older:
- No schooling: 51
- Nursery to 4th grade: 7
- 5th and 6th grade: 16
- 7th and 8th grade: 19
- 9th grade: 13
- 10th grade: 27
- 11th grade: 26
- 12th grade, no diploma: 81
- High school graduate (or equivalency): 995
- Less than 1 year of college: 327
- Some college more than 1 year, no degree: 767
- Associate degree: 552
- Bachelor's degree: 487
- Master's degree: 339
- Professional school degree: 30
- Doctorate degree: 5


Housing units in structures:
- One, detached: 3,339
- One, attached: 292
- Two: 32
- 3 or 4: 28
- 5 to 9: 56
- 10 to 19: 152
- 20 to 49: 34
- 50 or more: 357
- Mobile homes: 255
Median worth of mobile homes: $59,224
House/condo owner moved in on average 7 years ago
Renter moved in on average 2 years ago

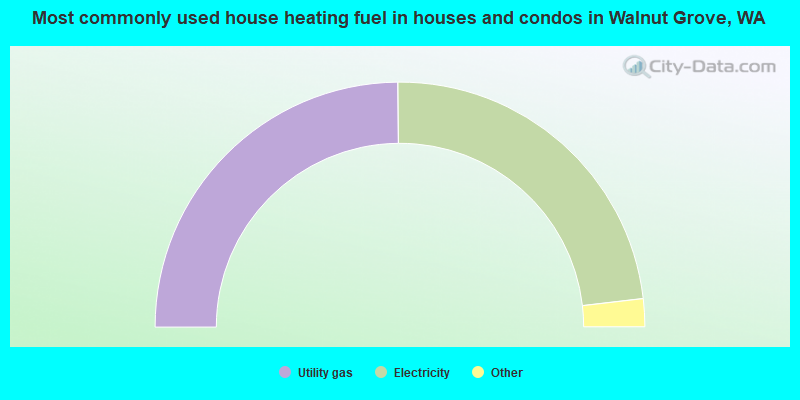
- 49.8%Utility gas
- 46.6%Electricity
- 1.6%Wood
- 1.1%No fuel used
- 0.5%Other fuel
- 0.4%Bottled, tank, or LP gas
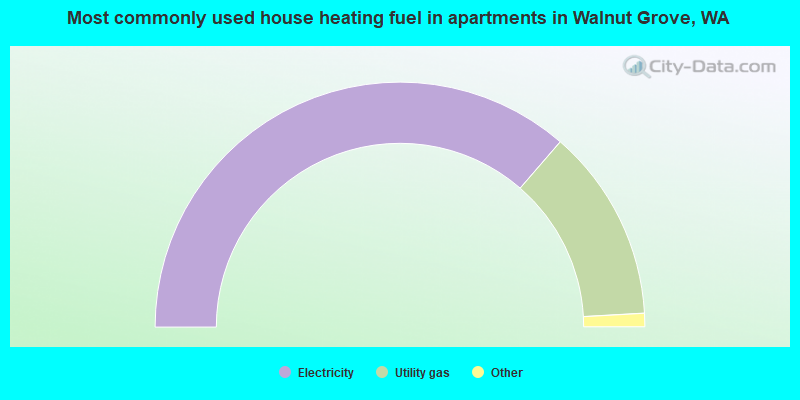
- 72.8%Electricity
- 25.5%Utility gas
- 0.9%Bottled, tank, or LP gas
- 0.9%Fuel oil, kerosene, etc.
Private vs. public school enrollment:
| Here: | 33.6% |
| Washington: | 12.4% |
| Here: | 4.0% |
| Washington: | 9.2% |
| Here: | 12.8% |
| Washington: | 16.5% |


