Trenton, NJ (New Jersey) Houses and Residents
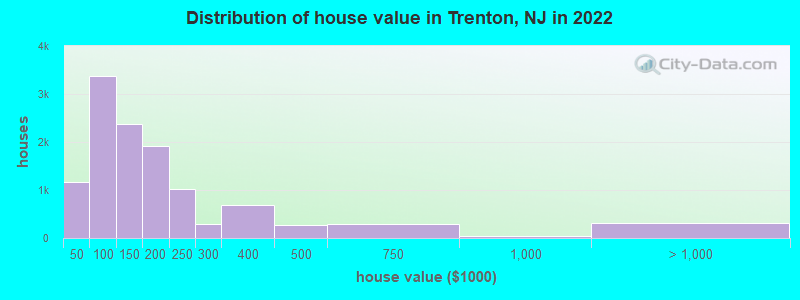
Estimated median house or condo value in 2022: $169,500 (it was $66,200 in 2000 )
Trenton:
$169,500New Jersey:
$428,900
Lower value quartile - upper value quartile: $103,400 - $218,500Mean price in 2022: Detached houses: $325,819 Here:
$325,819State:
$537,591
Townhouses or other attached units: $142,142 Here:
$142,142State:
$381,113
In 2-unit structures: $249,345 Here:
$249,345State:
$444,476
In 5-or-more-unit structures: $146,560 Here:
$146,560State:
$368,745
Total population: 84,034 (All urban)
Houses: 32,561 (30,789 occupied: 14,047 owner occupied, 16,742 renter occupied )
% of renters here:
54%State:
35%
Housing density: 4,252 houses/condos per square mile
Median price asked for vacant for-sale houses and condos in 2022: $218,909.
Median contract rent in 2022: $965 (lower quartile is $514, upper quartile is $1,265)
Median rent asked for vacant for-rent units in 2022: $1,206
Median gross rent in Trenton, NJ in 2022: $1,204
Housing units in Trenton with a mortgage: 9,011 (1,045 second mortgage, 0 home equity loan, 893 both second mortgage and home equity loan )Houses without a mortgage: 331
Median household income for houses/condos with a mortgage: $101,055
Median household income for apartments without a mortgage: $80,781
Median monthly housing costs: $1,299
Data:
Median house or condo value ($)
Median house or condo value ($ change since 2000)
Median house or condo value ($) - White
Median house or condo value ($) - Black or African American
Median house or condo value ($) - Asian
Median house or condo value ($) - Hispanic or Latino
Median house or condo value ($) - American Indian and Alaska Native
Median house or condo value ($) - Multirace
Median house or condo value ($) - Other Race
Median price asked for mobile homes ($)
Household density (households per square mile)
Mean house or condo value by units in structure - 1, detached ($)
Mean house or condo value by units in structure - 1, attached ($)
Mean house or condo value by units in structure - 2 ($)
Mean house or condo value by units in structure by units in structure - 3 or 4 ($)
Mean house or condo value by units in structure - 5 or more ($)
Mean house or condo value by units in structure - Boat, RV, van, etc. ($)
Mean house or condo value by units in structure - Mobile home ($)
Median contract rent ($)
Median contract rent - Lower quartile ($)
Median contract rent - Upper quartile ($)
Median gross rent ($)
Urban houses (%)
Rural houses (%)
Houses occupied (%)
Houses occupied (% change since 2000)
Houses owner occupied (%)
Houses owner occupied (% change since 2000)
Houses renter occupied (%)
Houses renter occupied (% change since 2000)
Vacant housing units - For rent (%)
Vacant housing units - For rent (% change since 2000)
Vacant housing units - For sale only (%)
Vacant housing units - For sale only (% change since 2000)
Vacant housing units - Rented or sold, not occupied (%)
Vacant housing units - Rented or sold, not occupied (% change since 2000)
Vacant housing units - For seasonal, recreational, or occasional use (%)
Vacant housing units - For seasonal, recreational, or occasional use (% change since 2000)
Vacant housing units - For migrant workers (%)
Vacant housing units - For migrant workers (% change since 2000)
Vacant housing units - Other vacant (%)
Vacant housing units - Other vacant (% change since 2000)
Median monthly housing costs ($)
Median household income for houses/condos with a mortgage ($)
Median household income for houses/condos without a mortgage ($)
Median household income ($)
Median household income ($) - White
Median household income ($) - Black or African American
Median household income ($) - Asian
Median household income ($) - Hispanic or Latino
Median household income ($) - American Indian and Alaska Native
Median household income ($) - Multirace
Median household income ($) - Other Race
Mortgage status - with mortgage (%)
Mortgage status - with second mortgage (%)
Mortgage status - with home equity loan (%)
Mortgage status - with both second mortgage and home equity loan (%)
Mortgage status - without a mortgage (%)
Median year house/condo built
Median year apartment built
Household type by relationship - Male householder living alone (%)
Household type by relationship - Male householder not living alone (%)
Household type by relationship - Female householder living alone (%)
Household type by relationship - Female householder not living alone (%)
Household type by relationship - Opposite-Sex spouse (%)
Household type by relationship - Same-Sex spouse (%)
Household type by relationship - Opposite-Sex unmarried partner (%)
Household type by relationship - Same-Sex unmarried partner (%)
Household type by relationship - In group quarters (%)
Size of family households - 2-person household (%)
Size of family households - 3-person household (%)
Size of family households - 4-person household (%)
Size of family households - 5-person household (%)
Size of family households - 6-person household (%)
Size of family households - 7-or-more-person household (%)
Size of nonfamily households - 1-person household (%)
Size of nonfamily households - 2-person household (%)
Size of nonfamily households - 3-person household (%)
Size of nonfamily households - 4-person household (%)
Size of nonfamily households - 5-person household (%)
Size of nonfamily households - 6-person household (%)
Size of nonfamily households - 7-or-moreperson household (%)
Year house built - Built 2010 or later (%)
Year house built - Built 2000 to 2009 (%)
Year house built - Built 1990 to 1999 (%)
Year house built - Built 1980 to 1989 (%)
Year house built - Built 1970 to 1979 (%)
Year house built - Built 1960 to 1969 (%)
Year house built - Built 1950 to 1959 (%)
Year house built - Built 1940 to 1949 (%)
Year house built - Built 1939 or earlier (%)
Median number of rooms in houses and condos
Median number of rooms in apartments
Median number of bedrooms in owner occupied houses
Mean number of bedrooms in owner occupied houses
Median number of bedrooms in renter occupied houses
Mean number of bedrooms in renter occupied houses
Median number of vehichles in owner occupied houses
Mean number of vehichles in owner occupied houses
Median number of vehichles in renter occupied houses
Mean number of vehichles in renter occupied houses
Rooms in owner-occupied houses - 1 room (%)
Rooms in owner-occupied houses - 2 rooms (%)
Rooms in owner-occupied houses - 3 rooms (%)
Rooms in owner-occupied houses - 4 rooms (%)
Rooms in owner-occupied houses - 5 rooms (%)
Rooms in owner-occupied houses - 6 rooms (%)
Rooms in owner-occupied houses - 7 rooms (%)
Rooms in owner-occupied houses - 8 rooms (%)
Rooms in owner-occupied houses - 9+ rooms (%)
Rooms in renter-occupied houses - 1 room (%)
Rooms in renter-occupied houses - 2 rooms (%)
Rooms in renter-occupied houses - 3 rooms (%)
Rooms in renter-occupied houses - 4 rooms (%)
Rooms in renter-occupied houses - 5 rooms (%)
Rooms in renter-occupied houses - 6 rooms (%)
Rooms in renter-occupied houses - 7 rooms (%)
Rooms in renter-occupied houses - 8 rooms (%)
Rooms in renter-occupied houses - 9+ rooms (%)
Bedrooms in owner-occupied houses - no bedrooms (%)
Bedrooms in owner-occupied houses - 1 bedroom (%)
Bedrooms in owner-occupied houses - 2 bedrooms (%)
Bedrooms in owner-occupied houses - 3 bedrooms (%)
Bedrooms in owner-occupied houses - 4 bedrooms (%)
Bedrooms in owner-occupied houses - 5+ bedrooms (%)
Bedrooms in renter-occupied houses - no bedrooms (%)
Bedrooms in renter-occupied houses - 1 bedroom (%)
Bedrooms in renter-occupied houses - 2 bedrooms (%)
Bedrooms in renter-occupied houses - 3 bedrooms (%)
Bedrooms in renter-occupied houses - 4 bedrooms (%)
Bedrooms in renter-occupied houses - 5+ bedrooms (%)
Vehicles available in owner-occupied houses - no vehicle available (%)
Vehicles available in owner-occupied houses - 1 vehicle available(%)
Vehicles available in owner-occupied houses - 2 Vehicles available (%)
Vehicles available in owner-occupied houses - 3 Vehicles available (%)
Vehicles available in owner-occupied houses - 4 Vehicles available (%)
Vehicles available in owner-occupied houses - 5+ Vehicles available (%)
Vehicles available in renter-occupied houses - no vehicle available (%)
Vehicles available in renter-occupied houses - 1 vehicle available (%)
Vehicles available in renter-occupied houses - 2 Vehicles available (%)
Vehicles available in renter-occupied houses - 3 Vehicles available (%)
Vehicles available in renter-occupied houses - 4 Vehicles available (%)
Vehicles available in renter-occupied houses - 5+ Vehicles available (%)
Housing units in structures - 1, detached (%)
Housing units in structures - 1, attached (%)
Housing units in structures - 2 (%)
Housing units in structures - 3 or 4 (%)
Housing units in structures - 5 to 9 (%)
Housing units in structures - 10 to 19 (%)
Housing units in structures - 20 to 49 (%)
Housing units in structures - 50 or more (%)
Housing units in structures - Mobile home (%)
Housing units in structures - Boat, RV, van, etc. (%)
Housing units in structures - Owners - 1, detached (%)
Housing units in structures - Owners - 1, attached (%)
Housing units in structures - Owners - 2 (%)
Housing units in structures - Owners - 3 or 4 (%)
Housing units in structures - Owners - 5 to 9 (%)
Housing units in structures - Owners - 10 to 19 (%)
Housing units in structures - Owners - 20 to 49 (%)
Housing units in structures - Owners - 50 or more (%)
Housing units in structures - Owners - Mobile home (%)
Housing units in structures - Owners - Boat, RV, van, etc. (%)
Housing units in structures - Renters - 1, detached (%)
Housing units in structures - Renters - 1, attached (%)
Housing units in structures - Renters - 2 (%)
Housing units in structures - Renters - 3 or 4 (%)
Housing units in structures - Renters - 5 to 9 (%)
Housing units in structures - Renters - 10 to 19 (%)
Housing units in structures - Renters - 20 to 49 (%)
Housing units in structures - Renters - 50 or more (%)
Housing units in structures - Renters - Mobile home (%)
Housing units in structures - Renters - Boat, RV, van, etc. (%)
House/condo owner moved in on average (years ago)
Renter moved in on average (years ago)
Year householder moved into unit - Moved in 1999 to March 2000 (%)
Year householder moved into unit - Moved in 1999 to March 2000 (%) - White
Year householder moved into unit - Moved in 1999 to March 2000 (%) - Black or African American
Year householder moved into unit - Moved in 1999 to March 2000 (%) - Asian
Year householder moved into unit - Moved in 1999 to March 2000 (%) - Hispanic or Latino
Year householder moved into unit - Moved in 1999 to March 2000 (%) - American Indian and Alaska Native
Year householder moved into unit - Moved in 1999 to March 2000 (%) - Multirace
Year householder moved into unit - Moved in 1999 to March 2000 (%) - Other Race
Year householder moved into unit - Moved in 1995 to 1998 (%)
Year householder moved into unit - Moved in 1995 to 1998 (%) - White
Year householder moved into unit - Moved in 1995 to 1998 (%) - Black or African American
Year householder moved into unit - Moved in 1995 to 1998 (%) - Asian
Year householder moved into unit - Moved in 1995 to 1998 (%) - Hispanic or Latino
Year householder moved into unit - Moved in 1995 to 1998 (%) - American Indian and Alaska Native
Year householder moved into unit - Moved in 1995 to 1998 (%) - Multirace
Year householder moved into unit - Moved in 1995 to 1998 (%) - Other Race
Year householder moved into unit - Moved in 1990 to 1994 (%)
Year householder moved into unit - Moved in 1990 to 1994 (%) - White
Year householder moved into unit - Moved in 1990 to 1994 (%) - Black or African American
Year householder moved into unit - Moved in 1990 to 1994 (%) - Asian
Year householder moved into unit - Moved in 1990 to 1994 (%) - Hispanic or Latino
Year householder moved into unit - Moved in 1990 to 1994 (%) - American Indian and Alaska Native
Year householder moved into unit - Moved in 1990 to 1994 (%) - Multirace
Year householder moved into unit - Moved in 1990 to 1994 (%) - Other Race
Year householder moved into unit - Moved in 1980 to 1989 (%)
Year householder moved into unit - Moved in 1980 to 1989 (%) - White
Year householder moved into unit - Moved in 1980 to 1989 (%) - Black or African American
Year householder moved into unit - Moved in 1980 to 1989 (%) - Asian
Year householder moved into unit - Moved in 1980 to 1989 (%) - Hispanic or Latino
Year householder moved into unit - Moved in 1980 to 1989 (%) - American Indian and Alaska Native
Year householder moved into unit - Moved in 1980 to 1989 (%) - Multirace
Year householder moved into unit - Moved in 1980 to 1989 (%) - Other Race
Year householder moved into unit - Moved in 1970 to 1979 (%)
Year householder moved into unit - Moved in 1970 to 1979 (%) - White
Year householder moved into unit - Moved in 1970 to 1979 (%) - Black or African American
Year householder moved into unit - Moved in 1970 to 1979 (%) - Asian
Year householder moved into unit - Moved in 1970 to 1979 (%) - Hispanic or Latino
Year householder moved into unit - Moved in 1970 to 1979 (%) - American Indian and Alaska Native
Year householder moved into unit - Moved in 1970 to 1979 (%) - Multirace
Year householder moved into unit - Moved in 1970 to 1979 (%) - Other Race
Year householder moved into unit - Moved in 1969 or earlier (%)
Year householder moved into unit - Moved in 1969 or earlier (%) - White
Year householder moved into unit - Moved in 1969 or earlier (%) - Black or African American
Year householder moved into unit - Moved in 1969 or earlier (%) - Asian
Year householder moved into unit - Moved in 1969 or earlier (%) - Hispanic or Latino
Year householder moved into unit - Moved in 1969 or earlier (%) - American Indian and Alaska Native
Year householder moved into unit - Moved in 1969 or earlier (%) - Multirace
Year householder moved into unit - Moved in 1969 or earlier (%) - Other Race
Housing units lacking complete plumbing facilities (%)
Housing units lacking complete kitchen facilities (%)
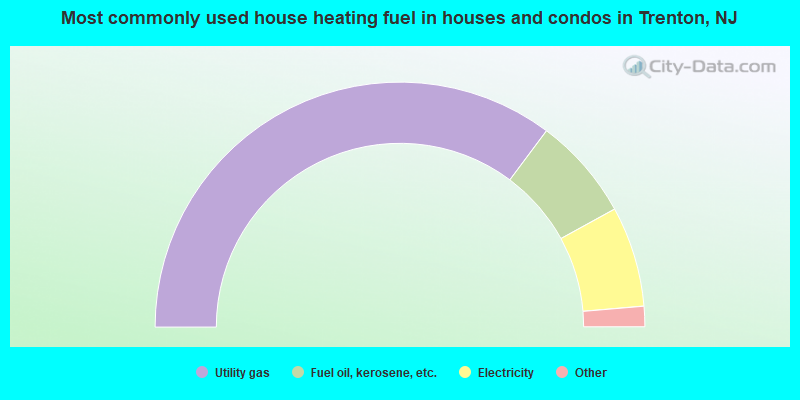
House heating fuel used in houses and condos - Utility gas (%)
House heating fuel used in houses and condos - Bottled, tank, or LP gas (%)
House heating fuel used in houses and condos - Electricity (%)
House heating fuel used in houses and condos - Fuel oil, kerosene, etc. (%)
House heating fuel used in houses and condos - Coal or coke (%)
House heating fuel used in houses and condos - Wood (%)
House heating fuel used in houses and condos - Solar energy (%)
House heating fuel used in houses and condos - Other fuel (%)
House heating fuel used in houses and condos - No fuel used (%)
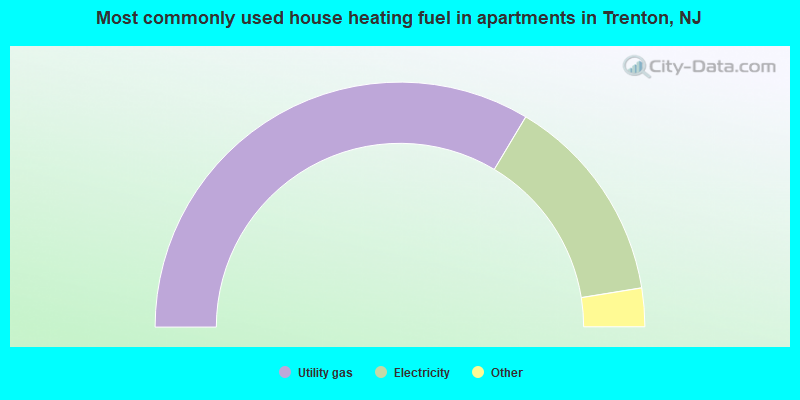
House heating fuel used in apartments - Utility gas (%)
House heating fuel used in apartments - Bottled, tank, or LP gas (%)
House heating fuel used in apartments - Electricity (%)
House heating fuel used in apartments - Fuel oil, kerosene, etc. (%)
House heating fuel used in apartments - Coal or coke (%)
House heating fuel used in apartments - Wood (%)
House heating fuel used in apartments - Solar energy (%)
House heating fuel used in apartments - Other fuel (%)
House heating fuel used in apartments - No fuel used (%)
Latest news about housing in Trenton, NJ collected exclusively by city-data.com from local newspapers, TV, and radio stations
Median year house/condo built: 1943Median year apartment built: 1956Household type by relationship:
Households: 89,658
Male householders: 13,750 (3,926 living alone ), Female householders: 17,039 (5,374 living alone )7,938 spouses (7,836 opposite-sex spouses ), 4,383 unmarried partners , (4,247 opposite-sex unmarried partners ), 28,522 children (27,138 natural , 375 adopted , 1,009 stepchildren ), 4,098 grandchildren , 1,873 brothers or sisters , 1,159 parents , 143 foster children , 4,212 other relatives , 4,864 non-relatives In group quarters: 1,677
Size of family households: 6,034 2-persons , 5,171 3-persons , 4,052 4-persons , 1,556 5-persons , 702 6-persons , 1,540 7-or-more-persons .
Size of nonfamily households: 9,300 1-person , 2,025 2-persons , 71 3-persons , 338 5-persons .
6,650 married couples with children. single-parent households (4,100 men , 8,613 women ).
56.5% of residents of Trenton speak English at home. of residents speak Spanish at home (50% speak English very well , 16% speak English well , 23% speak English not well , 11% don't speak English at all ).of residents speak other Indo-European language at home (51% speak English very well , 26% speak English well , 22% speak English not well , 2% don't speak English at all ).of residents speak Asian or Pacific Island language at home (18% speak English very well , 22% speak English well , 51% speak English not well , 9% don't speak English at all ).of residents speak other language at home (76% speak English very well , 13% speak English well , 11% speak English not well ).
Foreign born population: 30,436 (33.9%)of them are naturalized citizens )
Median number of rooms in houses and condos:
Median number of rooms in apartments
Owner-occupied Renter-occupied
Bedrooms in owner-occupied houses and condos in Trenton, New Jersey
0 no bedroom 362 1 bedroom 2,557 2 bedrooms 7,400 3 bedrooms 2,698 4 bedrooms 1,030 5+ bedrooms
Bedrooms in renter-occupied apartments in Trenton, New Jersey
1,162 no bedroom 5,671 1 bedroom 4,288 2 bedrooms 3,729 3 bedrooms 1,656 4 bedrooms 236 5+ bedrooms
Owner-occupied Renter-occupied
Rooms in owner-occupied houses in Trenton, New Jersey
0 1 room 0 2 rooms 724 3 rooms 1,294 4 rooms 1,325 5 rooms 2,352 6 rooms 2,434 7 rooms 4,408 8 rooms 1,510 9+ rooms
Rooms in renter-occupied apartments in Trenton, New Jersey
1,162 1 room 934 2 rooms 2,504 3 rooms 3,929 4 rooms 4,019 5 rooms 2,268 6 rooms 538 7 rooms 1,089 8 rooms 299 9+ rooms
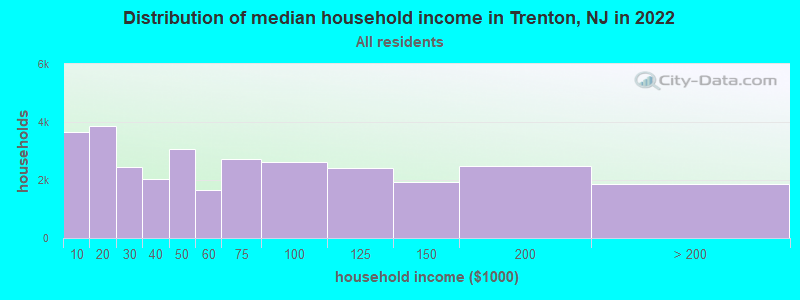
Trenton, NJ household income distribution 3,642 Less than $10,0003,857 $10,000 to $19,9992,444 $20,000 to $29,9992,031 $30,000 to $39,9993,082 $40,000 to $49,9991,664 $50,000 to $59,9992,737 $60,000 to $74,9992,628 $75,000 to $99,9992,418 $100,000 to $124,9991,922 $125,000 to $149,9992,497 $150,000 to $199,9991,867 $200,000 or more
Home value of owner - occupied houses in 2022 in Trenton, NJ 192 Less than $10,00047 $10,000 to $14,99953 $15,000 to $19,999144 $20,000 to $24,99937 $25,000 to $29,99934 $30,000 to $34,99952 $35,000 to $39,999595 $40,000 to $49,999517 $50,000 to $59,999494 $60,000 to $69,999664 $70,000 to $79,999561 $80,000 to $89,999545 $90,000 to $99,9991,824 $100,000 to $124,999559 $125,000 to $149,999980 $150,000 to $174,999928 $175,000 to $199,9991,028 $200,000 to $249,999288 $250,000 to $299,999678 $300,000 to $399,999267 $400,000 to $499,999287 $500,000 to $749,99947 $750,000 to $999,99970 $1,000,000 to $1,499,999164 $1,500,000 to $1,999,99966 $2,000,000 or moreRent paid by renters in 2022 in Trenton, NJ 271 Less than $100137 $100 to $149138 $150 to $1992,061 $200 to $249892 $250 to $299326 $300 to $349299 $350 to $399297 $400 to $44942 $450 to $499251 $500 to $549134 $550 to $599231 $600 to $649305 $650 to $699292 $700 to $749486 $750 to $7991,587 $800 to $8992,624 $900 to $9995,474 $1,000 to $1,2492,132 $1,250 to $1,4991,908 $1,500 to $1,999138 $2,000 to $2,499287 No cash rent
Percentage of workers working in this county: 70.8%Number of people working at home: 2,353 (6.6% of all workers )
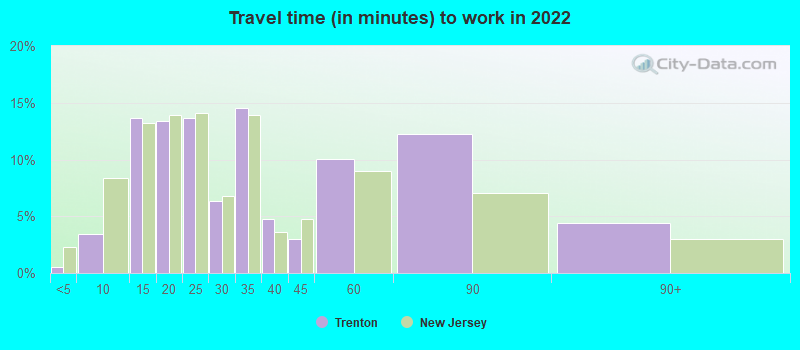
Travel time to work (commute)
Less than 5 minutes: 4405 to 9 minutes: 1,05210 to 14 minutes: 5,87315 to 19 minutes: 8,78620 to 24 minutes: 5,03625 to 29 minutes: 1,91830 to 34 minutes: 4,92035 to 39 minutes: 1,16640 to 44 minutes: 74245 to 59 minutes: 2,37760 to 89 minutes: 2,39290 or more minutes: 606
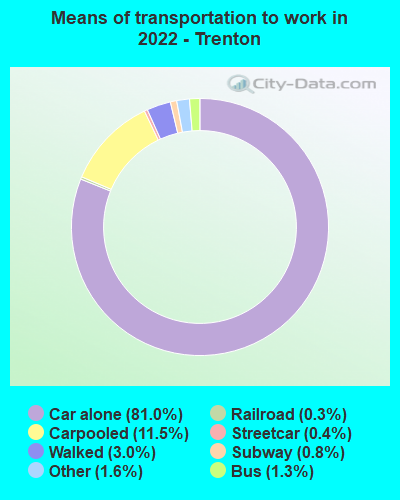
Means of transportation to work:
Drove a car alone: 34,673 (73.9%)Carpooled: 5,069 (10.8%)Bus : 485 (1.0%)Subway or elevated rail : 175 (0.4%)Long-distance train or commuter rail : 446 (1.0%)Light rail, streetcar or trolley : 143 (0.3%)Ferryboat: 10 (0.0%)Taxi: 868 (1.8%)Bicycle: 32 (0.1%)Walked: 1,607 (3.4%)Worked at home: 2,353 (5.0%)
Unemployment by race in 2022
Unemployment rate for White non-Hispanic residents 8.8% Males8.6% FemalesUnemployment rate for Black residents 13.5% Males14.7% FemalesUnemployment rate for American Indian and Alaska Native residents 2.7% MalesUnemployment rate for Asian residents 19.3% Males11.2% FemalesUnemployment rate for other race residents 2.9% Males3.9% FemalesUnemployment rate for two or more race residents 7.1% Males7.1% FemalesUnemployment rate for Hispanic or Latino residents 4.6% Males6.0% Females
Year of entry for the foreign-born population in Trenton, New Jersey
12,869 2010 or later 6,260 2000 to 2009 3,838 1990 to 1999 3,011 1980 to 1989 1,151 1970 to 1979 1,013 Before 1970
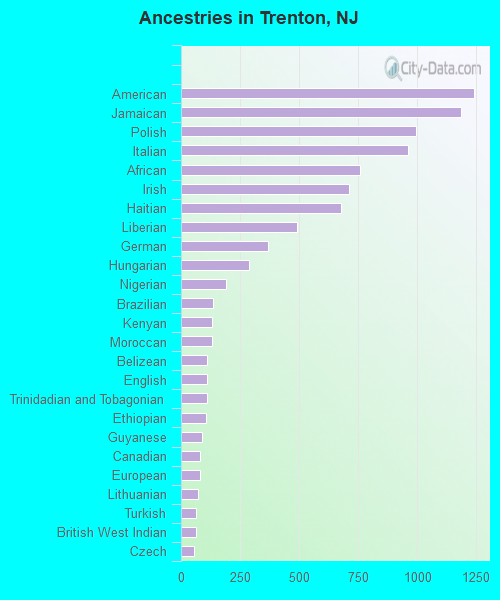
First ancestries reported:
American: 1,242 (2.1%)
Jamaican: 1,184 (2.0%)
Polish: 997 (1.7%)
Italian: 962 (1.6%)
African: 760 (1.3%)
Irish: 711 (1.2%)
Haitian: 677 (1.1%)
Liberian: 492 (0.8%)
German: 369 (0.6%)
Hungarian: 290 (0.5%)
Nigerian: 190 (0.3%)
Brazilian: 136 (0.2%)
Kenyan: 131 (0.2%)
Moroccan: 130 (0.2%)
Belizean: 111 (0.2%)
English: 109 (0.2%)
Trinidadian and Tobagonian: 109 (0.2%)
Ethiopian: 107 (0.2%)
Guyanese: 91 (0.2%)
Canadian: 79 (0.1%)
European: 79 (0.1%)
Lithuanian: 71 (0.1%)
Turkish: 65 (0.1%)
British West Indian: 63 (0.1%)
Czech: 53 (0.09%)
Ghanaian: 49 (0.08%)
Sudanese: 46 (0.08%)
Russian: 42 (0.07%)
Ukrainian: 42 (0.07%)
U.S. Virgin Islander: 39 (0.07%)
Dutch: 31 (0.05%)
Scotch-Irish: 27 (0.05%)
Portuguese: 22 (0.04%)
West Indian: 20 (0.03%)
British: 15 (0.03%)
Slavic: 15 (0.03%)
French: 10 (0.02%)
Arab: 7 (0.01%)
Slovak: 7 (0.01%)
Bulgarian: 7 (0.01%)
Norwegian: 3 (0.01%) Most common places of birth for foreign-born residents (%): Guatemala Trenton:
25.0% (5,991)New Jersey:
2.2% (46,813)
Dominican Republic Trenton:
16.6% (3,985)New Jersey:
9.7% (209,055)
Honduras Trenton:
7.1% (1,706)New Jersey:
1.7% (37,335)
Liberia Trenton:
6.6% (1,577)New Jersey:
0.4% (8,533)
Jamaica Trenton:
5.7% (1,372)New Jersey:
2.2% (47,365)
Ecuador Trenton:
4.3% (1,035)New Jersey:
4.4% (95,275)
Costa Rica Trenton:
4.2% (1,012)New Jersey:
0.7% (14,848)
Colombia Trenton:
3.7% (893)New Jersey:
4.2% (90,817)
Mexico Trenton:
3.3% (803)New Jersey:
4.8% (102,527)
Haiti Trenton:
2.3% (553)New Jersey:
2.3% (49,491)
El Salvador Trenton:
1.6% (395)New Jersey:
2.3% (48,885)
Poland Trenton:
1.6% (387)New Jersey:
2.3% (48,811)
Place of birth for U.S.-born residents:
This state: 42,502Other state: 10,346Northeast: 5,720Midwest: 1,125South: 3,490West: 11 87.1% of Trenton residents lived in the same house 1 years ago.
Out of people who lived in different houses, 39.9% lived in this county.
Out of people who lived in different counties, 59.6% lived in New Jersey.
Trenton:
87.1%State average:
90.4%
Education attainment for males 25 years and older:
No schooling: 2,881Nursery to 4th grade: 7785th and 6th grade: 1,1907th and 8th grade: 1999th grade: 10810th grade: 38011th grade: 34212th grade, no diploma: 702High school graduate (or equivalency): 11,504Less than 1 year of college: 1,710Some college more than 1 year, no degree: 3,003Associate degree: 1,000Bachelor's degree: 3,592Master's degree: 1,049Professional school degree: 210Doctorate degree: 116
Education attainment for females 25 years and older:
No schooling: 1,469Nursery to 4th grade: 1,0685th and 6th grade: 3787th and 8th grade: 2459th grade: 23710th grade: 69911th grade: 44612th grade, no diploma: 1,170High school graduate (or equivalency): 10,875Less than 1 year of college: 2,029Some college more than 1 year, no degree: 2,868Associate degree: 1,715Bachelor's degree: 2,446Master's degree: 1,503Professional school degree: 135Doctorate degree: 76
Housing units in structures:
One, detached: 7,967One, attached: 12,245Two: 3,5633 or 4: 2,0115 to 9: 1,03610 to 19: 1,51920 to 49: 39150 or more: 3,757Mobile homes: 72Housing units lacking complete plumbing facilities in 2022: 3.3%Housing units lacking complete kitchen facilities in 2022: 3.6%House/condo owner moved in on average 15 years ago
Renter moved in on average 3 years ago
Private vs. public school enrollment:
Students in private schools in grades 1 to 8 (elementary and middle school): 946 Here:
9.3%New Jersey:
12.3%
Students in private schools in grades 9 to 12 (high school): 211 Here:
4.7%New Jersey:
13.1%
Students in private undergraduate colleges: 453 Here:
14.9%New Jersey:
33.2%