Tifton, GA (Georgia) Houses and Residents
| Tifton: | $189,881 |
| Georgia: | $297,400 |
Total population: 16,701 (Urban population: 14,770 (all inside urban clusters), Rural population: 94 (all nonfarm))
Houses: 7,846 (6,780 occupied: 2,646 owner occupied, 4,211 renter occupied)
| % of renters here: | 61% |
| State: | 34% |
Housing density: 878 houses/condos per square mile
Median price asked for vacant for-sale houses and condos in 2022: $819,568.
Median contract rent in 2022: $611 (lower quartile is $455, upper quartile is $802)
Median rent asked for vacant for-rent units in 2022: $768
Median gross rent in Tifton, GA in 2022: $795
Housing units in Tifton with a mortgage: 1,632 (113 second mortgage, 48 home equity loan, 68 both second mortgage and home equity loan)
Houses without a mortgage: 0
Median household income for houses/condos with a mortgage: $76,046
Median household income for apartments without a mortgage: $64,024
Median monthly housing costs: $805
Compare current foreclosures in Tifton, GA:
| Photo | Address | Area | Beds / Baths | Price | Details |
|---|---|---|---|---|---|

|
#1
Crescent Dr
Tifton, GA 31794
|
2,133 sq. feet
|
3 baths 4 beds |
show details | |

|
#2
42nd St E
Tifton, GA 31794
|
1,640 sq. feet
|
2 baths 3 beds |
show details | |

|
#3
Whiddon Mill Rd
Tifton, GA 31793
|
1,379 sq. feet
|
2 baths 3 beds |
show details | |

|
#4
Deer Run Rd
Tifton, GA 31794
|
1,344 sq. feet
|
2 baths 3 beds |
show details | |

|
#5
Hillcrest Dr
Tifton, GA 31794
|
1,216 sq. feet
|
1 baths 2 beds |
show details | |

|
#6
Brookhaven Dr
Tifton, GA 31794
|
1,033 sq. feet
|
1 baths 3 beds |
show details | |

|
#7
E Washington St
Tifton, GA 31794
|
1,203 sq. feet
|
1 baths 3 beds |
show details | |

|
#8
48th St
Tifton, GA 31794
|
2,000 sq. feet
|
2 baths 3 beds |
show details | |

|
#9
40th St E
Tifton, GA 31794
|
4,012 sq. feet
|
3 baths 4 beds |
show details | |

|
#10
Holland Rd
Tifton, GA 31794
|
2,262 sq. feet
|
2 baths 3 beds |
show details |
| Photo | Address | Area | Beds / Baths | Price | Details |
|---|---|---|---|---|---|

|
#11
Byrch Dr
Tifton, GA 31794
|
1,076 sq. feet
|
1 baths - beds |
show details | |

|
#12
College Ave S
Tifton, GA 31794
|
1,404 sq. feet
|
1 baths - beds |
show details | |

|
#13
1/2 Hill Ave
Tifton, GA 31794
|
784 sq. feet
|
1 baths - beds |
show details | |

|
#14
11th St W
Tifton, GA 31794
|
1,460 sq. feet
|
2 baths - beds |
show details | |

|
#15
Florida Dr
Tifton, GA 31794
|
1,602 sq. feet
|
2 baths - beds |
show details | |

|
#16
Pehler Dr
Tifton, GA 31794
|
1,033 sq. feet
|
1 baths - beds |
show details | |

|
#17
Windsor Dr
Tifton, GA 31794
|
1,239 sq. feet
|
2 baths - beds |
show details | |

|
#18
Riverbend Ct
Tifton, GA 31793
|
- sq. feet
|
2 baths 4 beds |
show details | |

|
#19
Elizabeth Dr
Tifton, GA 31793
|
1,582 sq. feet
|
2 baths - beds |
show details | |

|
#20
Us Highway 319 N
Tifton, GA 31794
|
1,312 sq. feet
|
1 baths - beds |
show details |
| Photo | Address | Area | Beds / Baths | Price | Details |
|---|---|---|---|---|---|

|
#21
Shannon Rd
Tifton, GA 31793
|
- sq. feet
|
2 baths 3 beds |
show details | |

|
#22
Sugar St
Tifton, GA 31794
|
1,056 sq. feet
|
1 baths - beds |
show details | |

|
#23
Tyson Ave
Tifton, GA 31794
|
1,680 sq. feet
|
1 baths - beds |
show details | |

|
#24
Wiley Branch Rd
Tifton, GA 31794
|
2,116 sq. feet
|
2 baths - beds |
show details | |

|
#25
Grimsley Rd
Tifton, GA 31794
|
1,200 sq. feet
|
1 baths - beds |
show details | |

|
#26
Lewis St
Tifton, GA 31794
|
1,782 sq. feet
|
2 baths - beds |
show details | |

|
#27
Palmetta Rd
Tifton, GA 31793
|
2,023 sq. feet
|
2 baths - beds |
show details | |

|
#28
Goff St
Tifton, GA 31794
|
912 sq. feet
|
1 baths - beds |
show details | |

|
#29
Connecticut Dr
Tifton, GA 31794
|
2,237 sq. feet
|
2 baths - beds |
show details | |

|
#30
Mallard Ln
Tifton, GA 31793
|
1,811 sq. feet
|
2 baths - beds |
show details |
| Photo | Address | Area | Beds / Baths | Price | Details |
|---|---|---|---|---|---|

|
#31
Oneal Ave
Tifton, GA 31794
|
1,512 sq. feet
|
2 baths - beds |
show details | |

|
#32
Golden Rd E
Tifton, GA 31794
|
975 sq. feet
|
1 baths - beds |
show details | |

|
#33
42nd St E
Tifton, GA 31794
|
1,905 sq. feet
|
2 baths - beds |
show details | |

|
#34
Us Highway 319 S
Tifton, GA 31793
|
1,344 sq. feet
|
3 baths - beds |
show details | |

|
#35
Wilson Ave N
Tifton, GA 31794
|
1,314 sq. feet
|
2 baths - beds |
show details | |

|
#36
Goff St
Tifton, GA 31794
|
1,537 sq. feet
|
1 baths - beds |
show details | |

|
#37
Pehler Dr
Tifton, GA 31794
|
1,685 sq. feet
|
2 baths - beds |
show details | |

|
#38
Early Hutchinson Rd
Tifton, GA 31793
|
1,193 sq. feet
|
2 baths - beds |
show details | |

|
#39
William H Cir
Tifton, GA 31793
|
1,560 sq. feet
|
2 baths - beds |
show details | |

|
#40
12th St E
Tifton, GA 31794
|
1,686 sq. feet
|
2 baths - beds |
show details |
| Photo | Address | Area | Beds / Baths | Price | Details |
|---|---|---|---|---|---|

|
#41
Midland Ave
Tifton, GA 31794
|
- sq. feet
|
2 baths 3 beds |
show details | |

|
#42
Prince Ave
Tifton, GA 31794
|
1,284 sq. feet
|
1 baths - beds |
show details | |

|
#43
Brookvale Dr
Tifton, GA 31794
|
- sq. feet
|
2 baths 3 beds |
show details | |

|
#44
Early Hutchinson Rd
Tifton, GA 31793
|
1,579 sq. feet
|
1 baths - beds |
show details | |

|
#45
26th St E
Tifton, GA 31794
|
1,624 sq. feet
|
2 baths - beds |
show details | |

|
#46
Westview Dr
Tifton, GA 31794
|
- sq. feet
|
2 baths 3 beds |
show details | |

|
#47
Horse Shoe Cir
Tifton, GA 31794
|
- sq. feet
|
2 baths 2 beds |
show details | |

|
#48
Lee Ave
Tifton, GA 31794
|
1,656 sq. feet
|
2 baths - beds |
show details | |

|
#49
Tyson Ave
Tifton, GA 31794
|
1,392 sq. feet
|
2 baths - beds |
show details | |

|
Check over 1 million property listings on Foreclosure.com!
|
browse all offers | |||

Latest news about housing in Tifton, GA collected exclusively by city-data.com from local newspapers, TV, and radio stations

 | Tifton or Valdosta? (6 replies) |
| Microsoft expansion (306 replies) |
| Favorite small college town in Georgia? (11 replies) |
| Albany VS Valdosta (31 replies) |
| Perry/Cordele former Holiday Inn’s (5 replies) |
| Confederate Flags hanging proudly on side of some Atlanta metro homes (109 replies) |

Median year apartment built: 1979
Household type by relationship:
Households: 17,362- Male householders: 2,946 (1,208 living alone), Female householders: 3,784 (1,421 living alone)
1,900 spouses (1,870 opposite-sex spouses), 178 unmarried partners, (147 opposite-sex unmarried partners), 4,669 children (4,600 natural, 56 adopted, 12 stepchildren), 807 grandchildren, 396 brothers or sisters, 54 parents, 0 foster children, 239 other relatives, 737 non-relatives
- In group quarters: 1,647
Size of family households: 1,671 2-persons, 1,208 3-persons, 805 4-persons, 168 5-persons, 54 6-persons, 10 7-or-more-persons.
Size of nonfamily households: 2,639 1-person, 138 2-persons, 146 3-persons.
950 married couples with children.
2,197 single-parent households (503 men, 1,694 women).
85.5% of residents of Tifton speak English at home.
11.4% of residents speak Spanish at home (62% speak English very well, 16% speak English well, 15% speak English not well, 7% don't speak English at all).
0.4% of residents speak other Indo-European language at home (69% speak English very well, 8% speak English well, 22% speak English not well).
2.3% of residents speak Asian or Pacific Island language at home (72% speak English very well, 16% speak English well, 13% speak English not well).
0.2% of residents speak other language at home (23% speak English well, 77% speak English not well).
Foreign born population: 1,070 (6.2%)
(17.5% of them are naturalized citizens)
| Here: | 6.9 |
| State: | 6.8 |
| Here: | 4.7 |
| State: | 4.6 |

- Bedrooms in owner-occupied houses and condos in Tifton, Georgia
- 0no bedroom
- 01 bedroom
- 3192 bedrooms
- 1,7553 bedrooms
- 5074 bedrooms
- 655+ bedrooms

- Bedrooms in renter-occupied apartments in Tifton, Georgia
- 73no bedroom
- 6671 bedroom
- 1,9582 bedrooms
- 1,4493 bedrooms
- 514 bedrooms
- 155+ bedrooms

- Cars and other vehicles available in Tifton in owner-occupied houses/condos
- 47no vehicle
- 9521 vehicle
- 1,1392 vehicles
- 3603 vehicles
- 1494 vehicles
- 05+ vehicles

- Cars and other vehicles available in Tifton in renter-occupied apartments
- 832no vehicle
- 2,3111 vehicle
- 7942 vehicles
- 1893 vehicles
- 754 vehicles
- 105+ vehicles

- Rooms in owner-occupied houses in Tifton, Georgia
- 01 room
- 02 rooms
- 53 rooms
- 1144 rooms
- 2995 rooms
- 4746 rooms
- 1,0737 rooms
- 2468 rooms
- 4369+ rooms

- Rooms in renter-occupied apartments in Tifton, Georgia
- 731 room
- 1162 rooms
- 6493 rooms
- 1,0864 rooms
- 1,1615 rooms
- 3156 rooms
- 7067 rooms
- 878 rooms
- 189+ rooms


Tifton, GA household income distribution

- 605Less than $10,000
- 527$10,000 to $19,999
- 1,194$20,000 to $29,999
- 766$30,000 to $39,999
- 523$40,000 to $49,999
- 562$50,000 to $59,999
- 779$60,000 to $74,999
- 407$75,000 to $99,999
- 574$100,000 to $124,999
- 209$125,000 to $149,999
- 536$150,000 to $199,999
- 81$200,000 or more

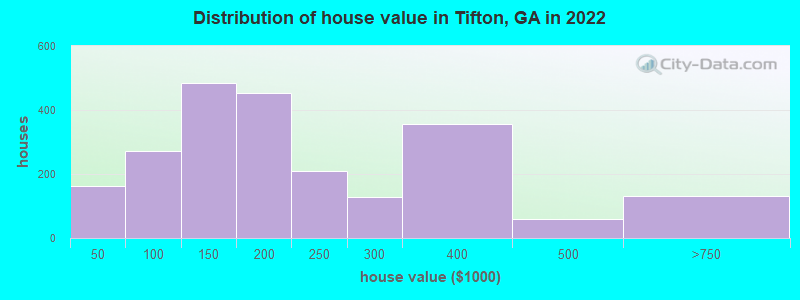
Home value of owner - occupied houses in 2022 in Tifton, GA
-
- 32Less than $10,000
- 93$10,000 to $14,999
- 7$25,000 to $29,999
- 18$30,000 to $34,999
- 10$35,000 to $39,999
- 61$50,000 to $59,999
- 71$60,000 to $69,999
- 46$70,000 to $79,999
- 23$80,000 to $89,999
- 68$90,000 to $99,999
- 232$100,000 to $124,999
- 251$125,000 to $149,999
- 244$150,000 to $174,999
- 207$175,000 to $199,999
- 207$200,000 to $249,999
- 127$250,000 to $299,999
- 356$300,000 to $399,999
- 59$400,000 to $499,999
- 130$500,000 to $749,999
Rent paid by renters in 2022 in Tifton, GA
-
- 15Less than $100
- 66$100 to $149
- 117$150 to $199
- 52$200 to $249
- 149$250 to $299
- 133$300 to $349
- 77$350 to $399
- 436$400 to $449
- 415$450 to $499
- 316$500 to $549
- 213$550 to $599
- 154$600 to $649
- 263$650 to $699
- 484$700 to $749
- 241$750 to $799
- 197$800 to $899
- 32$900 to $999
- 260$1,000 to $1,249
- 45$1,250 to $1,499
- 57$1,500 to $1,999
- 149No cash rent


Percentage of workers working in this county: 87.6%
Number of people working at home: 608 (8.1% of all workers)
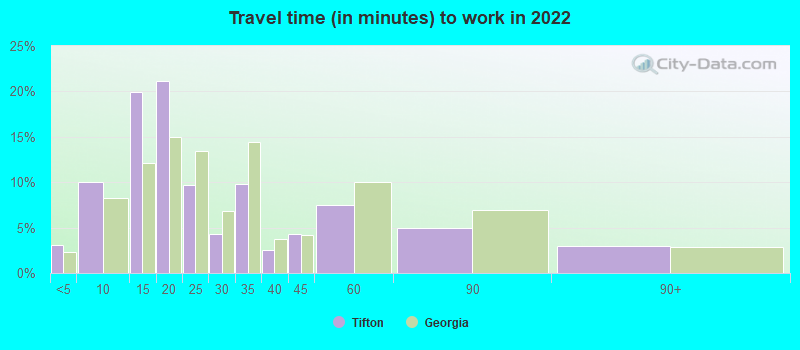
Travel time to work (commute)
- Less than 5 minutes: 292
- 5 to 9 minutes: 1,236
- 10 to 14 minutes: 1,980
- 15 to 19 minutes: 1,128
- 20 to 24 minutes: 558
- 25 to 29 minutes: 205
- 30 to 34 minutes: 416
- 35 to 39 minutes: 83
- 40 to 44 minutes: 236
- 45 to 59 minutes: 373
- 60 to 89 minutes: 83
- 90 or more minutes: 150
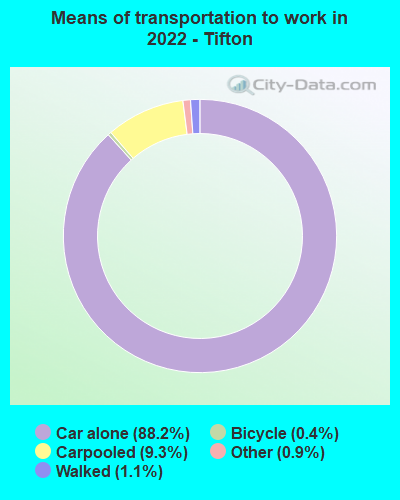
Means of transportation to work:
- Drove a car alone: 15,413 (81.9%)
- Carpooled: 1,691 (9.0%)
- Bus: 13 (0.1%)
- Taxi: 160 (0.9%)
- Bicycle: 67 (0.4%)
- Walked: 207 (1.1%)
- Worked at home: 608 (3.2%)

- Unemployment by race in 2022
- Unemployment rate for White non-Hispanic residents
- 2.3%Males
- 1.5%Females
- Unemployment rate for Black residents
- 2.0%Males
- 5.5%Females

- Year of entry for the foreign-born population in Tifton, Georgia
- 3082010 or later
- 4122000 to 2009
- 2501990 to 1999
- 2091980 to 1989
- 461970 to 1979
- 29Before 1970

First ancestries reported:
- American: 3,605 (32.1%)
- English: 519 (4.6%)
- Irish: 347 (3.1%)
- European: 116 (1.0%)
- German: 99 (0.9%)
- Scotch-Irish: 79 (0.7%)
- African: 51 (0.5%)
- Haitian: 51 (0.5%)
- Italian: 41 (0.4%)
- Scottish: 37 (0.3%)
- Welsh: 31 (0.3%)
- Iraqi: 22 (0.2%)
- Eastern European: 12 (0.1%)
- French: 12 (0.1%)
- British: 8 (0.07%)
Most common places of birth for foreign-born residents (%):
| Tifton: | 61.7% (660) |
| Georgia: | 20.0% (223,400) |
| Tifton: | 13.6% (146) |
| Georgia: | 3.5% (39,227) |
| Tifton: | 6.8% (73) |
| Georgia: | 4.1% (45,797) |
| Tifton: | 5.6% (60) |
| Georgia: | 2.1% (23,500) |
| Tifton: | 4.8% (51) |
| Georgia: | 0.1% (1,096) |
| Tifton: | 1.9% (20) |
| Georgia: | 1.8% (20,700) |
Place of birth for U.S.-born residents:
- This state: 13,046
- Other state: 3,081
- Northeast: 587
- Midwest: 393
- South: 1,777
- West: 322
87.2% of Tifton residents lived in the same house 1 years ago.
Out of people who lived in different houses, 31.6% lived in this county.
Out of people who lived in different counties, 83.5% lived in Georgia.
| Tifton: | 87.2% |
| State average: | 86.6% |
Education attainment for males 25 years and older:
- No schooling: 107
- Nursery to 4th grade: 48
- 5th and 6th grade: 19
- 7th and 8th grade: 84
- 9th grade: 47
- 10th grade: 119
- 11th grade: 130
- 12th grade, no diploma: 191
- High school graduate (or equivalency): 1,952
- Less than 1 year of college: 107
- Some college more than 1 year, no degree: 758
- Associate degree: 701
- Bachelor's degree: 574
- Master's degree: 145
- Professional school degree: 37
- Doctorate degree: 105

Education attainment for females 25 years and older:
- No schooling: 7
- Nursery to 4th grade: 0
- 5th and 6th grade: 136
- 7th and 8th grade: 98
- 9th grade: 151
- 10th grade: 134
- 11th grade: 244
- 12th grade, no diploma: 28
- High school graduate (or equivalency): 1,627
- Less than 1 year of college: 300
- Some college more than 1 year, no degree: 871
- Associate degree: 806
- Bachelor's degree: 664
- Master's degree: 483
- Professional school degree: 155
- Doctorate degree: 114


Housing units in structures:
- One, detached: 4,222
- One, attached: 75
- Two: 626
- 3 or 4: 810
- 5 to 9: 626
- 10 to 19: 204
- 20 to 49: 252
- 50 or more: 99
- Mobile homes: 857
- Boats, RVs, vans, etc.: 71
Housing units lacking complete kitchen facilities in 2022: 2.7%
House/condo owner moved in on average 9 years ago
Renter moved in on average 1 years ago

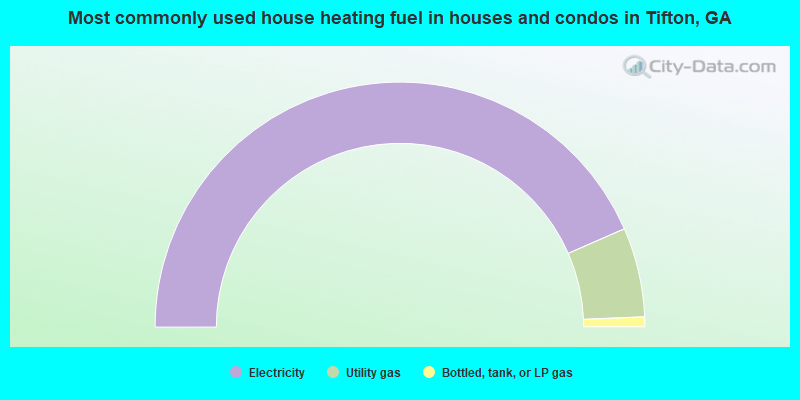
- 86.9%Electricity
- 11.8%Utility gas
- 1.3%Bottled, tank, or LP gas
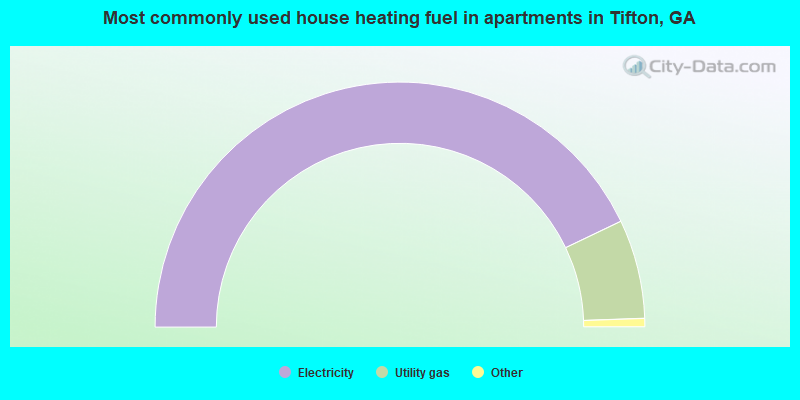
- 85.8%Electricity
- 13.1%Utility gas
- 0.9%No fuel used
- 0.2%Bottled, tank, or LP gas
Private vs. public school enrollment:
| Here: | 3.1% |
| Georgia: | 12.1% |
| Here: | 9.8% |
| Georgia: | 10.8% |
| Here: | 1.8% |
| Georgia: | 17.1% |


