Sun City, CA (California) Houses and Residents
| Sun City: | $403,179 |
| California: | $715,900 |
Total population: 23,436 (Urban population: 17,695, Rural population: 155 (all nonfarm))
Houses: 9,456 (8,780 occupied: 7,431 owner occupied, 1,349 renter occupied)
| % of renters here: | 15% |
| State: | 44% |
Housing density: 1,213 houses/condos per square mile
Median price asked for vacant for-sale houses and condos in 2022 in this county: $550,307.
Median contract rent in 2022: $1,576 (lower quartile is $1,222, upper quartile is over $2,000)
Median rent asked for vacant for-rent units in 2022: $870
Median gross rent in Sun City, CA in 2022: $1,792
Housing units in Sun City with a mortgage: 3,200 (371 second mortgage, 146 home equity loan, 0 both second mortgage and home equity loan)
Houses without a mortgage: 3,194
Compare current foreclosures in Sun City, CA:
| Photo | Address | Area | Beds / Baths | Price | Details |
|---|---|---|---|---|---|

|
#1
Railroad Canyon Rd # 3
Sun City, CA 92587
|
1,360 sq. feet
|
2 baths 2 beds |
show details | |

|
#2
Canyon Club Dr
Sun City, CA 92587
|
1,804 sq. feet
|
2 baths 3 beds |
show details | |

|
#3
Dusty Trail Way
Sun City, CA 92587
|
1,895 sq. feet
|
2 baths 3 beds |
show details | |

|
#4
Calle Rabano
Sun City, CA 92585
|
2,544 sq. feet
|
2 baths 4 beds |
show details | |

|
#5
Shadywood St
Sun City, CA 92586
|
1,199 sq. feet
|
1 baths 2 beds |
show details | |

|
#6
Bradley Rd
Sun City, CA 92586
|
1,366 sq. feet
|
1 baths 2 beds |
show details | |

|
#7
Hope Dr
Sun City, CA 92586
|
1,098 sq. feet
|
1 baths 2 beds |
show details | |

|
#8
Cherry Hills Blvd
Sun City, CA 92586
|
1,066 sq. feet
|
1 baths 2 beds |
show details | |

|
#9
China Dr
Sun City, CA 92585
|
1,427 sq. feet
|
1 baths 3 beds |
show details | |

|
#10
Skipjack Dr
Sun City, CA 92587
|
1,494 sq. feet
|
2 baths 3 beds |
show details |
| Photo | Address | Area | Beds / Baths | Price | Details |
|---|---|---|---|---|---|

|
#11
Cove View St
Sun City, CA 92587
|
2,709 sq. feet
|
2 baths 4 beds |
show details | |

|
#12
Longhorn Dr
Sun City, CA 92587
|
2,239 sq. feet
|
2 baths 3 beds |
show details | |

|
#13
Cascade Dr
Sun City, CA 92587
|
2,104 sq. feet
|
2 baths 4 beds |
show details | |

|
#14
Redwood Dr
Sun City, CA 92587
|
1,346 sq. feet
|
1 baths 1 beds |
show details | |

|
#15
Medford Way
Sun City, CA 92586
|
2,011 sq. feet
|
2 baths 3 beds |
show details | |

|
#16
Calle Gregorio
Sun City, CA 92585
|
1,251 sq. feet
|
1 baths 2 beds |
show details | |

|
#17
Calle De Leon
Sun City, CA 92585
|
1,904 sq. feet
|
1 baths 3 beds |
show details | |

|
#18
Prominence Rd
Sun City, CA 92586
|
1,318 sq. feet
|
1 baths 3 beds |
show details | |

|
#19
Blue Topaz Dr
Sun City, CA 92585
|
3,290 sq. feet
|
3 baths 5 beds |
show details | |

|
#20
Baldy Peak Dr
Sun City, CA 92586
|
1,570 sq. feet
|
2 baths 3 beds |
show details |
| Photo | Address | Area | Beds / Baths | Price | Details |
|---|---|---|---|---|---|

|
#21
Almaden Ln
Sun City, CA 92585
|
912 sq. feet
|
1 baths 1 beds |
show details | |

|
#22
Point Marina Dr
Sun City, CA 92587
|
1,894 sq. feet
|
2 baths 3 beds |
show details | |

|
#23
Murrieta Rd
Sun City, CA 92586
|
1,017 sq. feet
|
1 baths 2 beds |
show details | |

|
#24
Camino Juarez
Sun City, CA 92585
|
1,251 sq. feet
|
1 baths 2 beds |
show details | |

|
#25
Prominence Rd
Sun City, CA 92586
|
1,318 sq. feet
|
1 baths 3 beds |
show details | |

|
#26
Paseo Grande Dr
Sun City, CA 92586
|
1,285 sq. feet
|
1 baths 2 beds |
show details | |

|
#27
Sun City Blvd
Sun City, CA 92586
|
1,204 sq. feet
|
1 baths 2 beds |
show details | |

|
#28
Cloud Dance Ct
Sun City, CA 92585
|
1,207 sq. feet
|
1 baths 3 beds |
show details | |

|
#29
Avenida De Sereno
Sun City, CA 92586
|
1,458 sq. feet
|
2 baths 3 beds |
show details | |

|
#30
Old Wrangler Rd
Sun City, CA 92587
|
3,189 sq. feet
|
3 baths 5 beds |
show details |
| Photo | Address | Area | Beds / Baths | Price | Details |
|---|---|---|---|---|---|

|
#31
Avenida De Las Flores
Sun City, CA 92587
|
1,152 sq. feet
|
2 baths 2 beds |
show details | |

|
#32
Murrieta Rd
Sun City, CA 92586
|
1,725 sq. feet
|
1 baths 3 beds |
show details | |

|
#33
Portsmouth Dr
Sun City, CA 92586
|
2,420 sq. feet
|
2 baths 4 beds |
show details | |

|
#34
Moonridge Dr
Sun City, CA 92585
|
1,207 sq. feet
|
1 baths 3 beds |
show details | |

|
#35
Alta Vista Way
Sun City, CA 92585
|
1,101 sq. feet
|
1 baths 2 beds |
show details | |

|
#36
Lazy Creek Rd
Sun City, CA 92586
|
1,415 sq. feet
|
2 baths 4 beds |
show details | |

|
#37
Mammoth Pl
Sun City, CA 92587
|
2,842 sq. feet
|
2 baths 4 beds |
show details | |

|
#38
Almont Way
Sun City, CA 92585
|
2,865 sq. feet
|
3 baths 6 beds |
show details | |

|
#39
Eller Way
Sun City, CA 92585
|
1,672 sq. feet
|
1 baths 3 beds |
show details | |

|
#40
Brook Dr
Sun City, CA 92587
|
2,173 sq. feet
|
3 baths 5 beds |
show details |
| Photo | Address | Area | Beds / Baths | Price | Details |
|---|---|---|---|---|---|

|
#41
Evans Rd
Sun City, CA 92585
|
1,715 sq. feet
|
2 baths 3 beds |
show details | |

|
#42
Waverly Dr
Sun City, CA 92586
|
1,715 sq. feet
|
1 baths 3 beds |
show details | |

|
#43
Calle Gregorio
Sun City, CA 92585
|
1,251 sq. feet
|
2 baths 2 beds |
show details | |

|
#44
Lupin Pl
Sun City, CA 92587
|
3,800 sq. feet
|
4 baths 4 beds |
show details | |

|
#45
Cheyenne Canyon Dr
Sun City, CA 92587
|
1,785 sq. feet
|
2 baths 3 beds |
show details | |

|
#46
Coronado Way
Sun City, CA 92586
|
977 sq. feet
|
2 baths 2 beds |
show details | |

|
#47
Ohio Pl
Sun City, CA 92587
|
1,456 sq. feet
|
2 baths 3 beds |
show details | |

|
#48
Blue Topaz Dr
Sun City, CA 92585
|
3,290 sq. feet
|
3 baths 5 beds |
show details | |

|
#49
Red Dawn Dr
Sun City, CA 92585
|
1,207 sq. feet
|
2 baths 3 beds |
show details | |

|
Check over 1 million property listings on Foreclosure.com!
|
browse all offers | |||


Household type by relationship:
Households: 2,153,812- In family households: 1,916,707 (357,691 male householders, 152,550 female householders)
376,381 spouses, 728,028 children (675,451 natural, 15,499 adopted, 37,078 stepchildren), 69,455 grandchildren, 34,232 brothers or sisters, 33,896 parents, foster children, 57,727 other relatives, 76,462 non-relatives
- In nonfamily households: 237,105 (84,686 male householders (58,397 living alone)), 91,333 female householders (74,097 living alone)), 61,086 nonrelatives
- In group quarters: 35,829 (20,862 institutionalized population)
308,692 married couples with children.
98,911 single-parent households (26,262 men, 72,649 women).
88.4% of residents of Sun City speak English at home.
8.6% of residents speak Spanish at home (69% speak English very well, 17% speak English well, 13% speak English not well, 1% don't speak English at all).
2.2% of residents speak other Indo-European language at home (72% speak English very well, 20% speak English well, 8% speak English not well).
0.6% of residents speak Asian or Pacific Island language at home (43% speak English very well, 57% speak English well).
0.3% of residents speak other language at home (52% speak English very well, 48% speak English well).
Foreign born population: 3,021 (10.6%)
(115.2% of them are naturalized citizens)
| Here: | 6.1 |
| State: | 6.0 |
| Here: | 5.7 |
| State: | 3.9 |

- Bedrooms in owner-occupied houses and condos in Sun City, California
- 56no bedroom
- 1851 bedroom
- 4,1992 bedrooms
- 2,6243 bedrooms
- 3614 bedrooms
- 65+ bedrooms

- Bedrooms in renter-occupied apartments in Sun City, California
- 77no bedroom
- 2071 bedroom
- 7002 bedrooms
- 3003 bedrooms
- 574 bedrooms
- 85+ bedrooms

- Cars and other vehicles available in Sun City in owner-occupied houses/condos
- 470no vehicle
- 3,9761 vehicle
- 2,4072 vehicles
- 4563 vehicles
- 784 vehicles
- 445+ vehicles

- Cars and other vehicles available in Sun City in renter-occupied apartments
- 253no vehicle
- 7001 vehicle
- 3092 vehicles
- 733 vehicles
- 144 vehicles
- 05+ vehicles

- Rooms in owner-occupied houses in Sun City, California
- 01 room
- 932 rooms
- 2133 rooms
- 1,1924 rooms
- 2,8085 rooms
- 1,9796 rooms
- 8397 rooms
- 2348 rooms
- 739+ rooms

- Rooms in renter-occupied apartments in Sun City, California
- 471 room
- 1352 rooms
- 1293 rooms
- 3034 rooms
- 3865 rooms
- 2476 rooms
- 747 rooms
- 88 rooms
- 209+ rooms


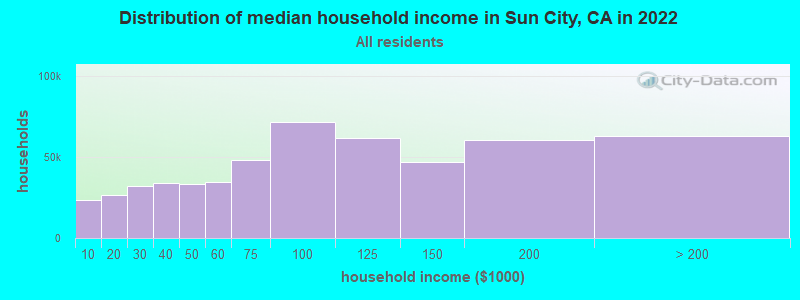
Sun City, CA household income distribution

- 23,405Less than $10,000
- 26,468$10,000 to $19,999
- 31,946$20,000 to $29,999
- 33,945$30,000 to $39,999
- 33,526$40,000 to $49,999
- 34,477$50,000 to $59,999
- 48,275$60,000 to $74,999
- 71,437$75,000 to $99,999
- 61,478$100,000 to $124,999
- 47,021$125,000 to $149,999
- 60,076$150,000 to $199,999
- 62,865$200,000 or more
Percentage of workers working in this county: 75.9%
Number of people working at home: 887 (11.7% of all workers)
Travel time to work (commute)
- Less than 5 minutes: 50
- 5 to 9 minutes: 249
- 10 to 14 minutes: 364
- 15 to 19 minutes: 497
- 20 to 24 minutes: 456
- 25 to 29 minutes: 187
- 30 to 34 minutes: 553
- 35 to 39 minutes: 75
- 40 to 44 minutes: 130
- 45 to 59 minutes: 410
- 60 to 89 minutes: 452
- 90 or more minutes: 411
Means of transportation to work:
- Drove a car alone: 3,286 (82.0%)
- Carpooled: 471 (11.8%)
- Bus or trolley bus: 15 (0.4%)
- Railroad: 7 (0.2%)
- Taxi: 8 (0.2%)
- Motorcycle: 5 (0.1%)
- Walked: 34 (0.8%)
- Other means: 8 (0.2%)
- Worked at home: 171 (4.3%)


- Year of entry for the foreign-born population in Sun City, California
- 431995 to March 2000
- 591990 to 1994
- 1291985 to 1989
- 951980 to 1984
- 1441975 to 1979
- 1011970 to 1974
- 1301965 to 1969
- 931Before 1965

First ancestries reported:
- Other: 4,293 (21.1%)
- German: 3,081 (15.1%)
- English: 2,909 (14.3%)
- Irish: 2,529 (12.4%)
- United States: 1,090 (5.3%)
- Italian: 1,063 (5.2%)
- French: 907 (4.5%)
- Scotch-Irish: 678 (3.3%)
- Polish: 568 (2.8%)
- Swedish: 565 (2.8%)
- Norwegian: 479 (2.4%)
- Scottish: 470 (2.3%)
- Dutch: 447 (2.2%)
- Hungarian: 214 (1.1%)
- Czech: 189 (0.9%)
- Danish: 155 (0.8%)
- Russian: 133 (0.7%)
- French Canadian: 131 (0.6%)
- Welsh: 105 (0.5%)
- Lithuanian: 99 (0.5%)
- Arab: 84 (0.4%)
- Swiss: 54 (0.3%)
- Greek: 47 (0.2%)
- Subsaharan African: 34 (0.2%)
- Ukrainian: 25 (0.1%)
- Portuguese: 20 (0.10%)
- Slovak: 7 (0.03%)
Most common places of birth for foreign-born residents (%):
| Sun City: | 36.3% (592) |
| California: | 44.3% (3,928,701) |
| Sun City: | 12.7% (208) |
| California: | 1.6% (141,181) |
| Sun City: | 8.3% (135) |
| California: | 1.5% (133,090) |
| Sun City: | 7.4% (120) |
| California: | 1.1% (98,160) |
| Sun City: | 4.0% (65) |
| California: | 0.1% (12,252) |
| Sun City: | 2.5% (41) |
| California: | 0.2% (16,885) |
| Sun City: | 2.4% (39) |
| California: | 0.4% (38,450) |
| Sun City: | 2.2% (36) |
| California: | 0.3% (22,311) |
| Sun City: | 2.0% (32) |
| California: | 0.1% (11,383) |
| Sun City: | 1.9% (31) |
| California: | 1.3% (112,212) |
| Sun City: | 1.7% (27) |
| California: | 0.3% (24,638) |
| Sun City: | 1.6% (26) |
| California: | 0.4% (32,049) |
| Sun City: | 1.6% (26) |
| California: | 0.4% (32,148) |
| Sun City: | 1.5% (25) |
| California: | 7.5% (664,935) |
Place of birth for U.S.-born residents:
- This state: 5,954
- Other state: 10,135
- Northeast: 1,903
- Midwest: 4,977
- South: 2,013
- West: 1,242
56% of Sun City residents lived in the same house 5 years ago.
Out of people who lived in different houses, 50% lived in this county.
Out of people who lived in different counties, 73% lived in California.
Education attainment for males 25 years and older:
- No schooling: 28
- Nursery to 4th grade: 35
- 5th and 6th grade: 93
- 7th and 8th grade: 237
- 9th grade: 126
- 10th grade: 221
- 11th grade: 213
- 12th grade, no diploma: 358
- High school graduate (or equivalency): 1,932
- Less than 1 year of college: 557
- Some college more than 1 year, no degree: 1,213
- Associate degree: 324
- Bachelor's degree: 516
- Master's degree: 221
- Professional school degree: 89
- Doctorate degree: 72

Education attainment for females 25 years and older:
- No schooling: 55
- Nursery to 4th grade: 21
- 5th and 6th grade: 70
- 7th and 8th grade: 296
- 9th grade: 238
- 10th grade: 406
- 11th grade: 377
- 12th grade, no diploma: 558
- High school graduate (or equivalency): 2,749
- Less than 1 year of college: 871
- Some college more than 1 year, no degree: 1,600
- Associate degree: 504
- Bachelor's degree: 533
- Master's degree: 195
- Professional school degree: 63
- Doctorate degree: 27


Housing units in structures:
- One, detached: 7,601
- One, attached: 638
- Two: 50
- 3 or 4: 119
- 5 to 9: 45
- 10 to 19: 17
- 50 or more: 124
- Mobile homes: 862
Median worth of mobile homes: $66,864
Housing units lacking complete kitchen facilities: 0.1%

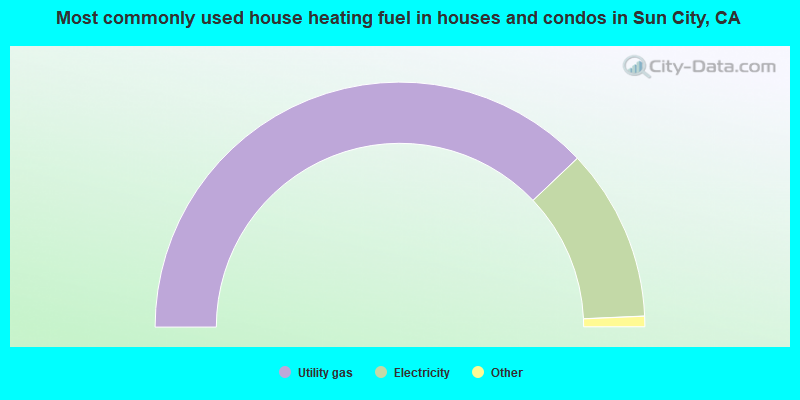
- 75.8%Utility gas
- 22.8%Electricity
- 1.3%Bottled, tank, or LP gas
- 0.1%Wood
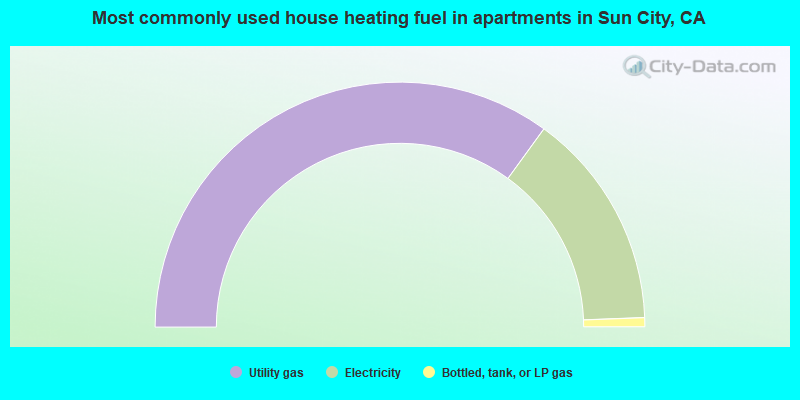
- 70.0%Utility gas
- 28.8%Electricity
- 1.2%Bottled, tank, or LP gas
Private vs. public school enrollment:
| Here: | 16.3% |
| California: | 9.9% |
| Here: | 3.9% |
| California: | 7.8% |
| Here: | 20.1% |
| California: | 15.4% |


