Sumter, SC (South Carolina) Houses and Residents
| Sumter: | $189,911 |
| South Carolina: | $254,600 |
Mean price in 2022:
Detached houses: $248,039
Here: $248,039 State: $368,255 Townhouses or other attached units: $133,411
Here: $133,411 State: $292,023 In 2-unit structures: $157,684
Here: $157,684 State: $358,283 In 5-or-more-unit structures: $136,340
Here: $136,340 State: $326,361 Mobile homes: $408,839
Here: $408,839 State: $102,531
Total population: 40,929 (Urban population: 39,930, Rural population: 283 (all nonfarm))
Houses: 19,139 (16,603 occupied: 8,737 owner occupied, 7,444 renter occupied)
| % of renters here: | 46% |
| State: | 28% |
Housing density: 720 houses/condos per square mile
Median price asked for vacant for-sale houses and condos in 2022: $150,942.
Median contract rent in 2022: $985 (lower quartile is $643, upper quartile is $1,272)
Median rent asked for vacant for-rent units in 2022: $928
Median gross rent in Sumter, SC in 2022: $1,154
Housing units in Sumter with a mortgage: 5,454 (221 second mortgage, 0 home equity loan, 180 both second mortgage and home equity loan)
Houses without a mortgage: 38
Median household income for houses/condos with a mortgage: $73,706
Median household income for apartments without a mortgage: $47,834
Median monthly housing costs: $964
Compare current foreclosures in Sumter, SC:
| Photo | Address | Area | Beds / Baths | Price | Details |
|---|---|---|---|---|---|

|
#1
Artesian Dr
Sumter, SC 29150
|
1,441 sq. feet
|
2 baths 3 beds |
$220,000
|
show details |

|
#2
Copley Dr
Sumter, SC 29154
|
1,755 sq. feet
|
2 baths 3 beds |
$170,000
|
show details |

|
#3
Mooneyhan Rd
Sumter, SC 29150
|
2,126 sq. feet
|
2 baths 5 beds |
$180,000
|
show details |

|
#4
Vernon Dr
Sumter, SC 29150
|
1,515 sq. feet
|
3 baths 3 beds |
show details | |

|
#5
Legette St
Sumter, SC 29150
|
- sq. feet
|
2 baths 2 beds |
show details | |

|
#6
Vernon Dr
Sumter, SC 29150
|
- sq. feet
|
1 baths 3 beds |
show details | |

|
#7
Shuler Dr
Sumter, SC 29150
|
- sq. feet
|
1 baths 2 beds |
show details | |

|
#8
Genoa Dr
Sumter, SC 29153
|
- sq. feet
|
2 baths 3 beds |
show details | |

|
#9
Morris Way Dr
Sumter, SC 29154
|
- sq. feet
|
2 baths 3 beds |
show details | |

|
#10
Old Spring Ct
Sumter, SC 29154
|
- sq. feet
|
2 baths 3 beds |
show details |
| Photo | Address | Area | Beds / Baths | Price | Details |
|---|---|---|---|---|---|

|
#11
Continental Dr
Sumter, SC 29154
|
- sq. feet
|
2 baths 3 beds |
show details | |

|
#12
Tamarah Way
Sumter, SC 29154
|
- sq. feet
|
2 baths 3 beds |
show details | |

|
#13
Landmark Dr
Sumter, SC 29154
|
- sq. feet
|
2 baths 2 beds |
show details | |

|
#14
Habitat Dr
Sumter, SC 29153
|
- sq. feet
|
2 baths 3 beds |
show details | |

|
#15
S Magnolia St
Sumter, SC 29150
|
- sq. feet
|
2 baths 3 beds |
show details | |

|
#16
Monterey Dr
Sumter, SC 29154
|
- sq. feet
|
2 baths 3 beds |
show details | |

|
#17
Crosswell Dr
Sumter, SC 29150
|
- sq. feet
|
2 baths 3 beds |
show details | |

|
#18
Senate Ln
Sumter, SC 29154
|
- sq. feet
|
2 baths 3 beds |
show details | |

|
#19
Bors St
Sumter, SC 29154
|
- sq. feet
|
2 baths 3 beds |
show details | |

|
#20
Cutleaf Dr
Sumter, SC 29150
|
- sq. feet
|
2 baths 3 beds |
show details |
| Photo | Address | Area | Beds / Baths | Price | Details |
|---|---|---|---|---|---|

|
#21
Collingwood Ct
Sumter, SC 29154
|
- sq. feet
|
2 baths 3 beds |
show details | |

|
#22
Habitat Dr
Sumter, SC 29153
|
- sq. feet
|
2 baths 3 beds |
show details | |

|
#23
Mossberg Dr
Sumter, SC 29150
|
- sq. feet
|
2 baths 4 beds |
show details | |

|
#24
Ruger Dr
Sumter, SC 29150
|
- sq. feet
|
3 baths 4 beds |
show details | |

|
#25
Beulah Cuttino Rd
Sumter, SC 29154
|
1,161 sq. feet
|
- baths - beds |
show details | |

|
#26
Habitat Ct
Sumter, SC 29153
|
- sq. feet
|
2 baths 3 beds |
show details | |

|
#27
Forest Lake Dr
Sumter, SC 29154
|
- sq. feet
|
2 baths 3 beds |
show details | |

|
#28
Browning Ridge Dr
Sumter, SC 29154
|
- sq. feet
|
2 baths 3 beds |
show details | |

|
#29
Polaris Dr
Sumter, SC 29150
|
- sq. feet
|
2 baths 3 beds |
show details | |

|
#30
Trillium Ln
Sumter, SC 29154
|
- sq. feet
|
2 baths 3 beds |
show details |
| Photo | Address | Area | Beds / Baths | Price | Details |
|---|---|---|---|---|---|

|
#31
Edmunds Dr
Sumter, SC 29154
|
- sq. feet
|
2 baths 3 beds |
show details | |

|
#32
Oleander Dr
Sumter, SC 29154
|
- sq. feet
|
2 baths 3 beds |
show details | |

|
#33
Highland Ave
Sumter, SC 29150
|
- sq. feet
|
- baths - beds |
show details | |

|
#34
Montecello Ln
Sumter, SC 29154
|
- sq. feet
|
- baths - beds |
show details | |

|
#35
Pinewood Rd
Sumter, SC 29154
|
- sq. feet
|
- baths 3 beds |
show details | |

|
#36
Sweet Olive Ct
Sumter, SC 29154
|
- sq. feet
|
- baths 3 beds |
show details | |

|
#37
Forest Dr
Sumter, SC 29154
|
- sq. feet
|
- baths 5 beds |
show details | |

|
#38
Companion Ct Apt 428
Sumter, SC 29150
|
- sq. feet
|
- baths - beds |
show details | |

|
#39
Tindal Rd
Sumter, SC 29150
|
- sq. feet
|
- baths 3 beds |
show details | |

|
#40
Curtiswood Dr
Sumter, SC 29150
|
- sq. feet
|
- baths 3 beds |
show details |
| Photo | Address | Area | Beds / Baths | Price | Details |
|---|---|---|---|---|---|

|
#41
Ruger Dr
Sumter, SC 29150
|
- sq. feet
|
- baths - beds |
show details | |

|
#42
Foxcroft Cir
Sumter, SC 29154
|
- sq. feet
|
- baths - beds |
show details | |

|
#43
Somerset Dr
Sumter, SC 29150
|
- sq. feet
|
- baths - beds |
show details | |

|
#44
N Wise Dr # 315
Sumter, SC 29150
|
- sq. feet
|
- baths - beds |
show details | |

|
#45
Lauderdale Ln
Sumter, SC 29154
|
- sq. feet
|
- baths - beds |
show details | |

|
#46
Habitat Ct
Sumter, SC 29153
|
- sq. feet
|
- baths - beds |
show details | |

|
#47
Furman Dr
Sumter, SC 29154
|
- sq. feet
|
- baths 3 beds |
show details | |

|
#48
Bay Blossom Ave # 7
Sumter, SC 29150
|
- sq. feet
|
- baths - beds |
show details | |

|
#49
Ervin Ln
Sumter, SC 29154
|
- sq. feet
|
- baths - beds |
show details | |

|
Check over 1 million property listings on Foreclosure.com!
|
browse all offers | |||

Latest news about housing in Sumter, SC collected exclusively by city-data.com from local newspapers, TV, and radio stations

 | South Carolina’s Employment Situation, Month to Month: Dept. of Employment & Workforce (312 replies) |
| Homes for Rent in Columbia area (0 replies) |
| Reloc to Sumter, SC or surrounding area (2 replies) |
| Possible move to Sumter, SC area (1 reply) |
| What's New or Coming To Sumter (2744 replies) |
| Shouldn't Sumter County now be in the Columbia CSA? (53 replies) |
Median year apartment built: 1990
Household type by relationship:
Households: 42,560- Male householders: 7,492 (2,511 living alone), Female householders: 8,716 (2,953 living alone)
6,593 spouses (6,535 opposite-sex spouses), 665 unmarried partners, (655 opposite-sex unmarried partners), 12,793 children (11,574 natural, 161 adopted, 1,056 stepchildren), 1,515 grandchildren, 852 brothers or sisters, 514 parents, 66 foster children, 1,119 other relatives, 552 non-relatives
- In group quarters: 1,678
Size of family households: 4,912 2-persons, 2,047 3-persons, 1,815 4-persons, 704 5-persons, 210 6-persons, 422 7-or-more-persons.
Size of nonfamily households: 5,677 1-person, 475 2-persons, 57 3-persons, 8 4-persons.
5,646 married couples with children.
4,082 single-parent households (833 men, 3,249 women).
92.4% of residents of Sumter speak English at home.
5.1% of residents speak Spanish at home (90% speak English very well, 4% speak English well, 4% speak English not well, 2% don't speak English at all).
1.2% of residents speak other Indo-European language at home (92% speak English very well, 3% speak English well, 5% speak English not well).
1.1% of residents speak Asian or Pacific Island language at home (65% speak English very well, 25% speak English well, 6% speak English not well, 5% don't speak English at all).
0.2% of residents speak other language at home (100% speak English very well).
Foreign born population: 1,403 (3.3%)
(49.5% of them are naturalized citizens)
| Here: | 7.0 |
| State: | 6.4 |
| Here: | 5.0 |
| State: | 4.5 |

- Bedrooms in owner-occupied houses and condos in Sumter, South Carolina
- 41no bedroom
- 161 bedroom
- 1,1612 bedrooms
- 4,5423 bedrooms
- 2,4274 bedrooms
- 5515+ bedrooms

- Bedrooms in renter-occupied apartments in Sumter, South Carolina
- 116no bedroom
- 8821 bedroom
- 3,2872 bedrooms
- 2,5643 bedrooms
- 5074 bedrooms
- 875+ bedrooms

- Cars and other vehicles available in Sumter in owner-occupied houses/condos
- 393no vehicle
- 2,5421 vehicle
- 3,2922 vehicles
- 1,6443 vehicles
- 5064 vehicles
- 3605+ vehicles

- Cars and other vehicles available in Sumter in renter-occupied apartments
- 1,393no vehicle
- 3,4411 vehicle
- 2,1572 vehicles
- 4093 vehicles
- 454 vehicles
- 05+ vehicles

- Rooms in owner-occupied houses in Sumter, South Carolina
- 301 room
- 02 rooms
- 2583 rooms
- 5124 rooms
- 1,5105 rooms
- 1,6346 rooms
- 1,8647 rooms
- 1,5268 rooms
- 1,4059+ rooms

- Rooms in renter-occupied apartments in Sumter, South Carolina
- 1161 room
- 2382 rooms
- 8063 rooms
- 2,1534 rooms
- 1,9845 rooms
- 1,1826 rooms
- 5567 rooms
- 2348 rooms
- 1769+ rooms


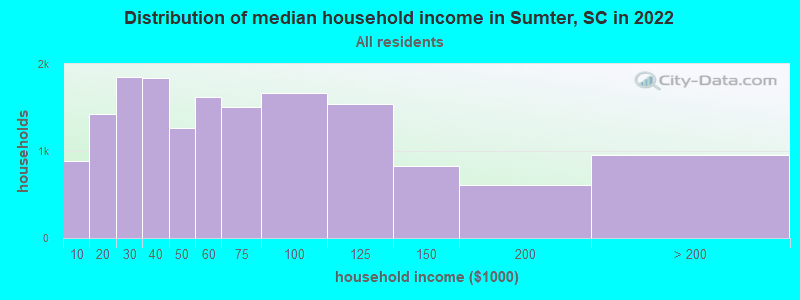
Sumter, SC household income distribution

- 881Less than $10,000
- 1,427$10,000 to $19,999
- 1,854$20,000 to $29,999
- 1,837$30,000 to $39,999
- 1,266$40,000 to $49,999
- 1,626$50,000 to $59,999
- 1,501$60,000 to $74,999
- 1,662$75,000 to $99,999
- 1,542$100,000 to $124,999
- 830$125,000 to $149,999
- 609$150,000 to $199,999
- 955$200,000 or more
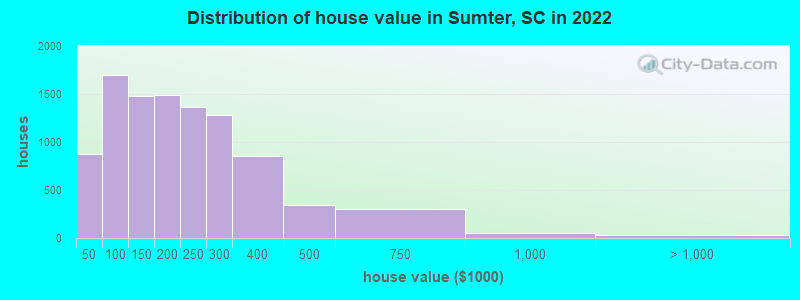
Home value of owner - occupied houses in 2022 in Sumter, SC
-
- 38Less than $10,000
- 23$10,000 to $14,999
- 27$15,000 to $19,999
- 184$20,000 to $24,999
- 26$25,000 to $29,999
- 319$30,000 to $34,999
- 19$35,000 to $39,999
- 236$40,000 to $49,999
- 203$50,000 to $59,999
- 439$60,000 to $69,999
- 400$70,000 to $79,999
- 150$80,000 to $89,999
- 269$90,000 to $99,999
- 714$100,000 to $124,999
- 762$125,000 to $149,999
- 614$150,000 to $174,999
- 879$175,000 to $199,999
- 1,362$200,000 to $249,999
- 1,278$250,000 to $299,999
- 858$300,000 to $399,999
- 346$400,000 to $499,999
- 299$500,000 to $749,999
- 56$750,000 to $999,999
- 6$1,000,000 to $1,499,999
- 8$1,500,000 to $1,999,999
- 17$2,000,000 or more
Rent paid by renters in 2022 in Sumter, SC
-
- 248Less than $100
- 225$100 to $149
- 89$150 to $199
- 92$200 to $249
- 130$250 to $299
- 42$300 to $349
- 76$350 to $399
- 291$400 to $449
- 230$450 to $499
- 192$500 to $549
- 239$550 to $599
- 381$600 to $649
- 159$650 to $699
- 405$700 to $749
- 424$750 to $799
- 395$800 to $899
- 1,148$900 to $999
- 1,504$1,000 to $1,249
- 274$1,250 to $1,499
- 294$1,500 to $1,999
- 30$2,000 to $2,499
- 81$2,500 to $2,999
- 483No cash rent


Percentage of workers working in this county: 89.3%
Number of people working at home: 1,253 (6.7% of all workers)
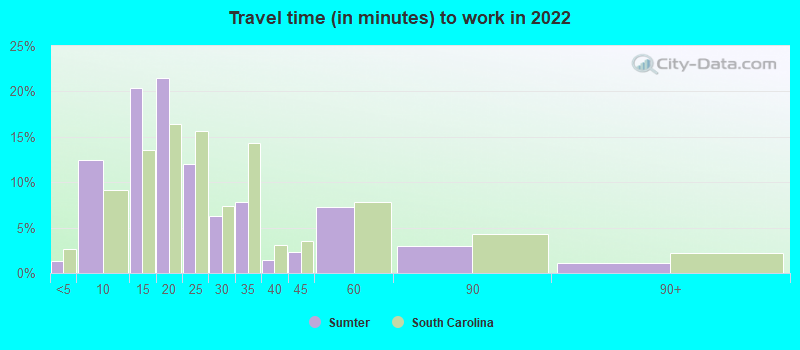
Travel time to work (commute)
- Less than 5 minutes: 249
- 5 to 9 minutes: 2,683
- 10 to 14 minutes: 4,610
- 15 to 19 minutes: 3,379
- 20 to 24 minutes: 1,657
- 25 to 29 minutes: 803
- 30 to 34 minutes: 628
- 35 to 39 minutes: 185
- 40 to 44 minutes: 614
- 45 to 59 minutes: 768
- 60 to 89 minutes: 501
- 90 or more minutes: 353
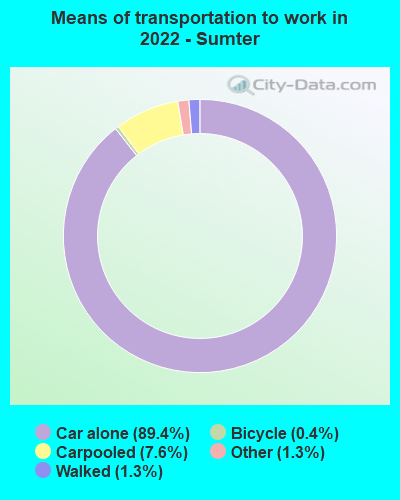
Means of transportation to work:
- Drove a car alone: 27,398 (83.6%)
- Carpooled: 2,447 (7.5%)
- Bus: 12 (0.0%)
- Taxi: 432 (1.3%)
- Bicycle: 139 (0.4%)
- Walked: 374 (1.1%)
- Worked at home: 1,253 (3.8%)

- Unemployment by race in 2022
- Unemployment rate for White non-Hispanic residents
- 5.2%Males
- 5.4%Females
- Unemployment rate for Black residents
- 19.0%Males
- 2.4%Females
- Unemployment rate for American Indian and Alaska Native residents
- 15.9%Females
- Unemployment rate for Asian residents
- 30.5%Females
- Unemployment rate for other race residents
- 11.9%Males
- Unemployment rate for two or more race residents
- 5.5%Males
- 2.8%Females
- Unemployment rate for Hispanic or Latino residents
- 17.9%Males
- 1.7%Females

- Year of entry for the foreign-born population in Sumter, South Carolina
- 6132010 or later
- 7232000 to 2009
- 3121990 to 1999
- 2521980 to 1989
- 1391970 to 1979
- 168Before 1970

First ancestries reported:
- American: 2,433 (8.8%)
- English: 1,505 (5.4%)
- German: 1,137 (4.1%)
- Irish: 726 (2.6%)
- European: 564 (2.0%)
- African: 522 (1.9%)
- Italian: 327 (1.2%)
- Scottish: 229 (0.8%)
- Romanian: 183 (0.7%)
- Polish: 176 (0.6%)
- Jamaican: 159 (0.6%)
- French: 120 (0.4%)
- Scotch-Irish: 116 (0.4%)
- Russian: 77 (0.3%)
- Welsh: 55 (0.2%)
- Nigerian: 49 (0.2%)
- British: 48 (0.2%)
- Swedish: 41 (0.1%)
- Hungarian: 33 (0.1%)
- Dutch: 30 (0.1%)
- Finnish: 30 (0.1%)
- Armenian: 28 (0.1%)
- Cajun: 27 (0.10%)
- Norwegian: 25 (0.09%)
- Canadian: 21 (0.08%)
- French Canadian: 21 (0.08%)
- Ukrainian: 21 (0.08%)
- Northern European: 19 (0.07%)
- Lebanese: 17 (0.06%)
- Danish: 16 (0.06%)
- Greek: 13 (0.05%)
- Maltese: 8 (0.03%)
- Swiss: 8 (0.03%)
- Syrian: 5 (0.02%)
- Portuguese: 5 (0.02%)
- Trinidadian and Tobagonian: 5 (0.02%)
Most common places of birth for foreign-born residents (%):
| Sumter: | 17.6% (323) |
| South Carolina: | 22.5% (60,774) |
| Sumter: | 9.5% (175) |
| South Carolina: | 2.6% (7,073) |
| Sumter: | 9.5% (174) |
| South Carolina: | 0.5% (1,298) |
| Sumter: | 7.2% (132) |
| South Carolina: | 0.6% (1,507) |
| Sumter: | 6.9% (126) |
| South Carolina: | 3.2% (8,721) |
| Sumter: | 6.3% (115) |
| South Carolina: | 3.0% (8,193) |
| Sumter: | 4.2% (77) |
| South Carolina: | 0.2% (581) |
| Sumter: | 3.8% (69) |
| South Carolina: | 4.1% (11,031) |
| Sumter: | 3.6% (66) |
| South Carolina: | 1.3% (3,522) |
| Sumter: | 3.2% (59) |
| South Carolina: | 2.3% (6,308) |
| Sumter: | 2.6% (47) |
| South Carolina: | 1.9% (5,117) |
| Sumter: | 2.2% (41) |
| South Carolina: | 3.7% (9,982) |
| Sumter: | 2.1% (38) |
| South Carolina: | 0.1% (269) |
| Sumter: | 1.9% (35) |
| South Carolina: | 0.6% (1,652) |
| Sumter: | 1.8% (34) |
| South Carolina: | 6.8% (18,307) |
Place of birth for U.S.-born residents:
- This state: 22,649
- Other state: 18,177
- Northeast: 4,653
- Midwest: 3,369
- South: 6,696
- West: 3,394
78.3% of Sumter residents lived in the same house 1 years ago.
Out of people who lived in different houses, 30.6% lived in this county.
Out of people who lived in different counties, 42.0% lived in South Carolina.
| Sumter: | 78.3% |
| State average: | 86.5% |
Education attainment for males 25 years and older:
- No schooling: 106
- Nursery to 4th grade: 41
- 5th and 6th grade: 17
- 7th and 8th grade: 132
- 9th grade: 61
- 10th grade: 123
- 11th grade: 232
- 12th grade, no diploma: 758
- High school graduate (or equivalency): 3,952
- Less than 1 year of college: 839
- Some college more than 1 year, no degree: 1,719
- Associate degree: 1,016
- Bachelor's degree: 2,349
- Master's degree: 1,050
- Professional school degree: 213
- Doctorate degree: 155

Education attainment for females 25 years and older:
- No schooling: 135
- Nursery to 4th grade: 4
- 5th and 6th grade: 50
- 7th and 8th grade: 146
- 9th grade: 79
- 10th grade: 499
- 11th grade: 692
- 12th grade, no diploma: 311
- High school graduate (or equivalency): 3,637
- Less than 1 year of college: 917
- Some college more than 1 year, no degree: 2,114
- Associate degree: 1,669
- Bachelor's degree: 2,665
- Master's degree: 1,704
- Professional school degree: 30
- Doctorate degree: 115

Housing units in structures:
- One, detached: 12,469
- One, attached: 1,016
- Two: 678
- 3 or 4: 981
- 5 to 9: 1,018
- 10 to 19: 876
- 20 to 49: 360
- 50 or more: 644
- Mobile homes: 1,093
Median worth of mobile homes: $45,669
Housing units lacking complete kitchen facilities in 2022: 3.4%
House/condo owner moved in on average 10 years ago
Renter moved in on average 3 years ago

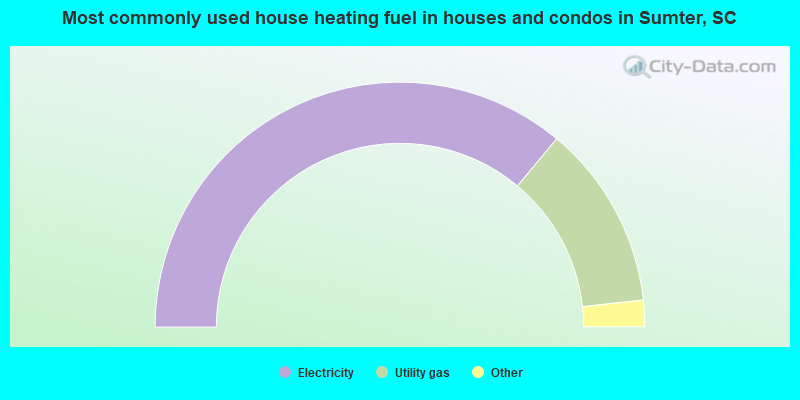
- 72.2%Electricity
- 24.4%Utility gas
- 1.7%Bottled, tank, or LP gas
- 0.6%Wood
- 0.5%Fuel oil, kerosene, etc.
- 0.3%Coal or coke
- 0.2%Solar energy
- 0.1%Other fuel
- 0.1%No fuel used
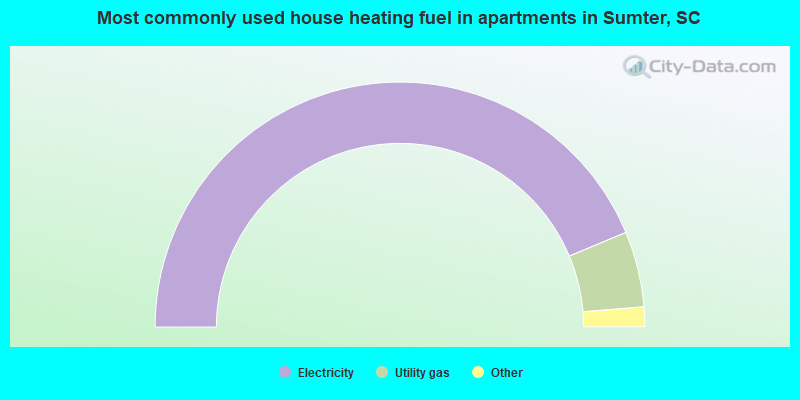
- 87.4%Electricity
- 10.0%Utility gas
- 1.1%No fuel used
- 1.0%Bottled, tank, or LP gas
- 0.4%Fuel oil, kerosene, etc.
- 0.1%Solar energy
Private vs. public school enrollment:
| Here: | 17.0% |
| South Carolina: | 14.4% |
| Here: | 16.5% |
| South Carolina: | 11.1% |
| Here: | 24.7% |
| South Carolina: | 21.9% |


