Streamwood, IL (Illinois) Houses and Residents
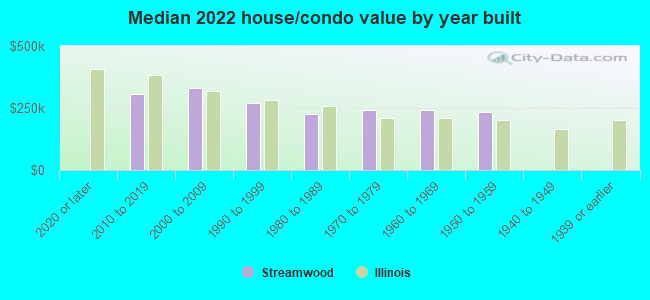
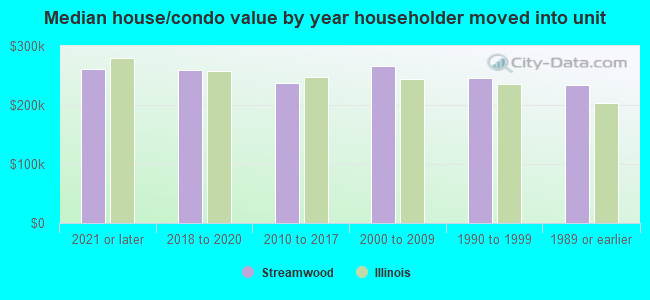
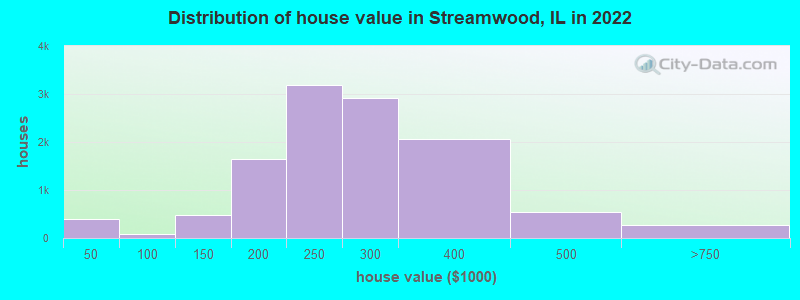
Estimated median house or condo value in 2022: $250,500 (it was $142,800 in 2000 )
Streamwood:
$250,500Illinois:
$251,600
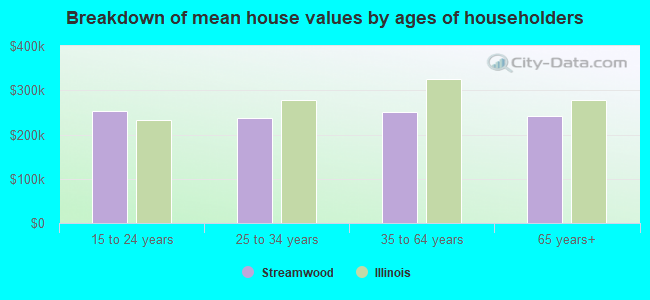
Lower value quartile - upper value quartile: $210,634 - $296,892Mean price in 2022: Detached houses: $268,289 Here:
$268,289State:
$310,164
Townhouses or other attached units: $216,976 Here:
$216,976State:
$286,230
In 2-unit structures: $378,252 Here:
$378,252State:
$299,638
In 3-to-4-unit structures: $192,228 Here:
$192,228State:
$330,907
In 5-or-more-unit structures: $124,210 Here:
$124,210State:
$318,887
Mobile homes: $95,184 Here:
$95,184State:
$78,855
Total population: 40,345 (Urban population: 36,725, Rural population: 7 (all nonfarm) )
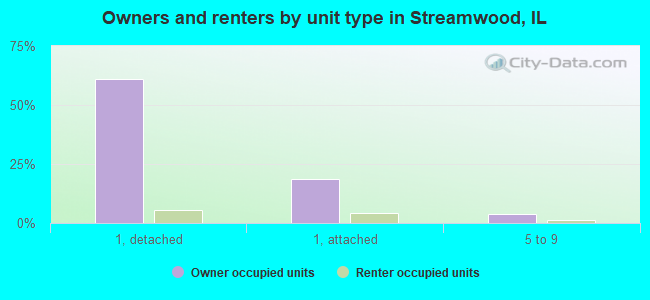
Houses: 13,680 (13,290 occupied: 11,624 owner occupied, 1,892 renter occupied )
% of renters here:
14%State:
33%
Housing density: 1,875 houses/condos per square mile
Median price asked for vacant for-sale houses and condos in 2022: $76,477.
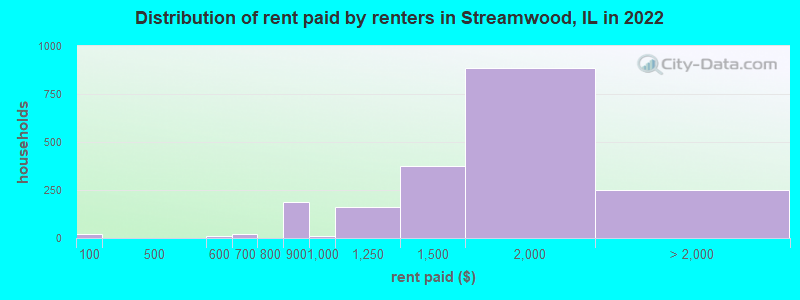
Median contract rent in 2022: $1,567 (lower quartile is $1,291, upper quartile is $1,856)
Median rent asked for vacant for-rent units in 2022: $9,433
Median gross rent in Streamwood, IL in 2022: $1,751
Housing units in Streamwood with a mortgage: 7,960 (475 second mortgage, 70 home equity loan, 345 both second mortgage and home equity loan )Houses without a mortgage: 104
Median household income for houses/condos with a mortgage: $98,881
Median household income for apartments without a mortgage: $92,513
Median monthly housing costs: $1,531
Data:
Median house or condo value ($)
Median house or condo value ($ change since 2000)
Median house or condo value ($) - White
Median house or condo value ($) - Black or African American
Median house or condo value ($) - Asian
Median house or condo value ($) - Hispanic or Latino
Median house or condo value ($) - American Indian and Alaska Native
Median house or condo value ($) - Multirace
Median house or condo value ($) - Other Race
Median price asked for mobile homes ($)
Household density (households per square mile)
Mean house or condo value by units in structure - 1, detached ($)
Mean house or condo value by units in structure - 1, attached ($)
Mean house or condo value by units in structure - 2 ($)
Mean house or condo value by units in structure by units in structure - 3 or 4 ($)
Mean house or condo value by units in structure - 5 or more ($)
Mean house or condo value by units in structure - Boat, RV, van, etc. ($)
Mean house or condo value by units in structure - Mobile home ($)
Median contract rent ($)
Median contract rent - Lower quartile ($)
Median contract rent - Upper quartile ($)
Median gross rent ($)
Urban houses (%)
Rural houses (%)
Houses occupied (%)
Houses occupied (% change since 2000)
Houses owner occupied (%)
Houses owner occupied (% change since 2000)
Houses renter occupied (%)
Houses renter occupied (% change since 2000)
Vacant housing units - For rent (%)
Vacant housing units - For rent (% change since 2000)
Vacant housing units - For sale only (%)
Vacant housing units - For sale only (% change since 2000)
Vacant housing units - Rented or sold, not occupied (%)
Vacant housing units - Rented or sold, not occupied (% change since 2000)
Vacant housing units - For seasonal, recreational, or occasional use (%)
Vacant housing units - For seasonal, recreational, or occasional use (% change since 2000)
Vacant housing units - For migrant workers (%)
Vacant housing units - For migrant workers (% change since 2000)
Vacant housing units - Other vacant (%)
Vacant housing units - Other vacant (% change since 2000)
Median monthly housing costs ($)
Median household income for houses/condos with a mortgage ($)
Median household income for houses/condos without a mortgage ($)
Median household income ($)
Median household income ($) - White
Median household income ($) - Black or African American
Median household income ($) - Asian
Median household income ($) - Hispanic or Latino
Median household income ($) - American Indian and Alaska Native
Median household income ($) - Multirace
Median household income ($) - Other Race
Mortgage status - with mortgage (%)
Mortgage status - with second mortgage (%)
Mortgage status - with home equity loan (%)
Mortgage status - with both second mortgage and home equity loan (%)
Mortgage status - without a mortgage (%)
Median year house/condo built
Median year apartment built
Household type by relationship - Male householder living alone (%)
Household type by relationship - Male householder not living alone (%)
Household type by relationship - Female householder living alone (%)
Household type by relationship - Female householder not living alone (%)
Household type by relationship - Opposite-Sex spouse (%)
Household type by relationship - Same-Sex spouse (%)
Household type by relationship - Opposite-Sex unmarried partner (%)
Household type by relationship - Same-Sex unmarried partner (%)
Household type by relationship - In group quarters (%)
Size of family households - 2-person household (%)
Size of family households - 3-person household (%)
Size of family households - 4-person household (%)
Size of family households - 5-person household (%)
Size of family households - 6-person household (%)
Size of family households - 7-or-more-person household (%)
Size of nonfamily households - 1-person household (%)
Size of nonfamily households - 2-person household (%)
Size of nonfamily households - 3-person household (%)
Size of nonfamily households - 4-person household (%)
Size of nonfamily households - 5-person household (%)
Size of nonfamily households - 6-person household (%)
Size of nonfamily households - 7-or-moreperson household (%)
Year house built - Built 2010 or later (%)
Year house built - Built 2000 to 2009 (%)
Year house built - Built 1990 to 1999 (%)
Year house built - Built 1980 to 1989 (%)
Year house built - Built 1970 to 1979 (%)
Year house built - Built 1960 to 1969 (%)
Year house built - Built 1950 to 1959 (%)
Year house built - Built 1940 to 1949 (%)
Year house built - Built 1939 or earlier (%)
Median number of rooms in houses and condos
Median number of rooms in apartments
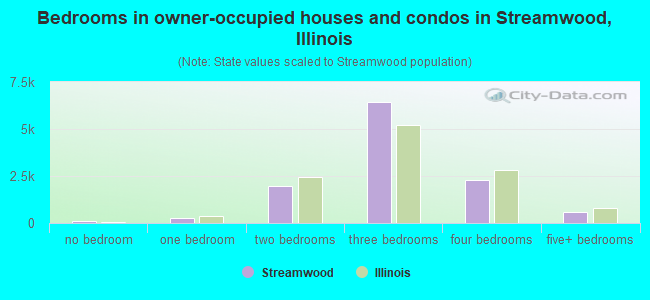
Median number of bedrooms in owner occupied houses
Mean number of bedrooms in owner occupied houses
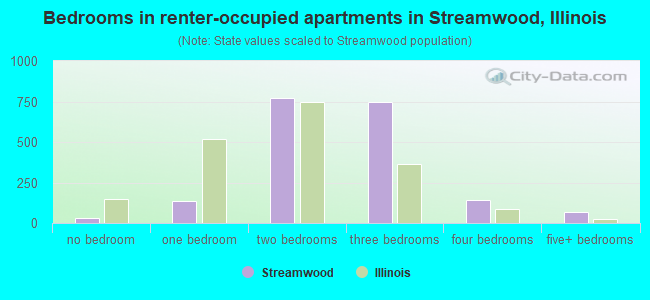
Median number of bedrooms in renter occupied houses
Mean number of bedrooms in renter occupied houses
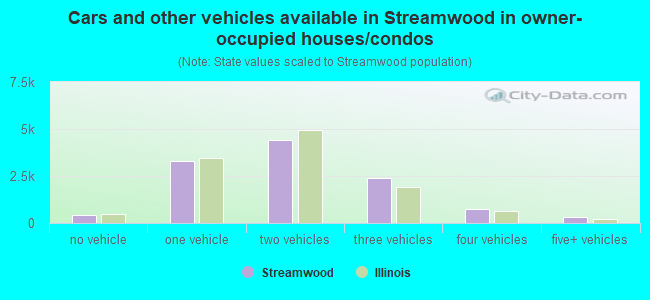
Median number of vehichles in owner occupied houses
Mean number of vehichles in owner occupied houses
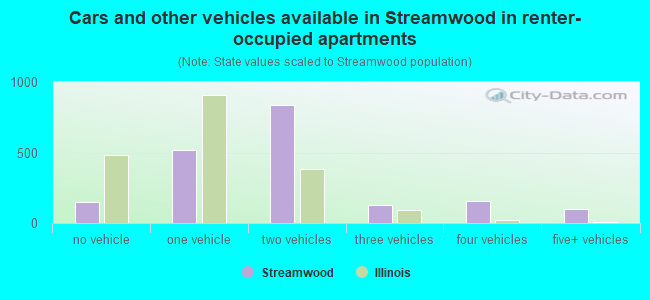
Median number of vehichles in renter occupied houses
Mean number of vehichles in renter occupied houses
Rooms in owner-occupied houses - 1 room (%)
Rooms in owner-occupied houses - 2 rooms (%)
Rooms in owner-occupied houses - 3 rooms (%)
Rooms in owner-occupied houses - 4 rooms (%)
Rooms in owner-occupied houses - 5 rooms (%)
Rooms in owner-occupied houses - 6 rooms (%)
Rooms in owner-occupied houses - 7 rooms (%)
Rooms in owner-occupied houses - 8 rooms (%)
Rooms in owner-occupied houses - 9+ rooms (%)
Rooms in renter-occupied houses - 1 room (%)
Rooms in renter-occupied houses - 2 rooms (%)
Rooms in renter-occupied houses - 3 rooms (%)
Rooms in renter-occupied houses - 4 rooms (%)
Rooms in renter-occupied houses - 5 rooms (%)
Rooms in renter-occupied houses - 6 rooms (%)
Rooms in renter-occupied houses - 7 rooms (%)
Rooms in renter-occupied houses - 8 rooms (%)
Rooms in renter-occupied houses - 9+ rooms (%)
Bedrooms in owner-occupied houses - no bedrooms (%)
Bedrooms in owner-occupied houses - 1 bedroom (%)
Bedrooms in owner-occupied houses - 2 bedrooms (%)
Bedrooms in owner-occupied houses - 3 bedrooms (%)
Bedrooms in owner-occupied houses - 4 bedrooms (%)
Bedrooms in owner-occupied houses - 5+ bedrooms (%)
Bedrooms in renter-occupied houses - no bedrooms (%)
Bedrooms in renter-occupied houses - 1 bedroom (%)
Bedrooms in renter-occupied houses - 2 bedrooms (%)
Bedrooms in renter-occupied houses - 3 bedrooms (%)
Bedrooms in renter-occupied houses - 4 bedrooms (%)
Bedrooms in renter-occupied houses - 5+ bedrooms (%)
Vehicles available in owner-occupied houses - no vehicle available (%)
Vehicles available in owner-occupied houses - 1 vehicle available(%)
Vehicles available in owner-occupied houses - 2 Vehicles available (%)
Vehicles available in owner-occupied houses - 3 Vehicles available (%)
Vehicles available in owner-occupied houses - 4 Vehicles available (%)
Vehicles available in owner-occupied houses - 5+ Vehicles available (%)
Vehicles available in renter-occupied houses - no vehicle available (%)
Vehicles available in renter-occupied houses - 1 vehicle available (%)
Vehicles available in renter-occupied houses - 2 Vehicles available (%)
Vehicles available in renter-occupied houses - 3 Vehicles available (%)
Vehicles available in renter-occupied houses - 4 Vehicles available (%)
Vehicles available in renter-occupied houses - 5+ Vehicles available (%)
Housing units in structures - 1, detached (%)
Housing units in structures - 1, attached (%)
Housing units in structures - 2 (%)
Housing units in structures - 3 or 4 (%)
Housing units in structures - 5 to 9 (%)
Housing units in structures - 10 to 19 (%)
Housing units in structures - 20 to 49 (%)
Housing units in structures - 50 or more (%)
Housing units in structures - Mobile home (%)
Housing units in structures - Boat, RV, van, etc. (%)
Housing units in structures - Owners - 1, detached (%)
Housing units in structures - Owners - 1, attached (%)
Housing units in structures - Owners - 2 (%)
Housing units in structures - Owners - 3 or 4 (%)
Housing units in structures - Owners - 5 to 9 (%)
Housing units in structures - Owners - 10 to 19 (%)
Housing units in structures - Owners - 20 to 49 (%)
Housing units in structures - Owners - 50 or more (%)
Housing units in structures - Owners - Mobile home (%)
Housing units in structures - Owners - Boat, RV, van, etc. (%)
Housing units in structures - Renters - 1, detached (%)
Housing units in structures - Renters - 1, attached (%)
Housing units in structures - Renters - 2 (%)
Housing units in structures - Renters - 3 or 4 (%)
Housing units in structures - Renters - 5 to 9 (%)
Housing units in structures - Renters - 10 to 19 (%)
Housing units in structures - Renters - 20 to 49 (%)
Housing units in structures - Renters - 50 or more (%)
Housing units in structures - Renters - Mobile home (%)
Housing units in structures - Renters - Boat, RV, van, etc. (%)
House/condo owner moved in on average (years ago)
Renter moved in on average (years ago)
Year householder moved into unit - Moved in 1999 to March 2000 (%)
Year householder moved into unit - Moved in 1999 to March 2000 (%) - White
Year householder moved into unit - Moved in 1999 to March 2000 (%) - Black or African American
Year householder moved into unit - Moved in 1999 to March 2000 (%) - Asian
Year householder moved into unit - Moved in 1999 to March 2000 (%) - Hispanic or Latino
Year householder moved into unit - Moved in 1999 to March 2000 (%) - American Indian and Alaska Native
Year householder moved into unit - Moved in 1999 to March 2000 (%) - Multirace
Year householder moved into unit - Moved in 1999 to March 2000 (%) - Other Race
Year householder moved into unit - Moved in 1995 to 1998 (%)
Year householder moved into unit - Moved in 1995 to 1998 (%) - White
Year householder moved into unit - Moved in 1995 to 1998 (%) - Black or African American
Year householder moved into unit - Moved in 1995 to 1998 (%) - Asian
Year householder moved into unit - Moved in 1995 to 1998 (%) - Hispanic or Latino
Year householder moved into unit - Moved in 1995 to 1998 (%) - American Indian and Alaska Native
Year householder moved into unit - Moved in 1995 to 1998 (%) - Multirace
Year householder moved into unit - Moved in 1995 to 1998 (%) - Other Race
Year householder moved into unit - Moved in 1990 to 1994 (%)
Year householder moved into unit - Moved in 1990 to 1994 (%) - White
Year householder moved into unit - Moved in 1990 to 1994 (%) - Black or African American
Year householder moved into unit - Moved in 1990 to 1994 (%) - Asian
Year householder moved into unit - Moved in 1990 to 1994 (%) - Hispanic or Latino
Year householder moved into unit - Moved in 1990 to 1994 (%) - American Indian and Alaska Native
Year householder moved into unit - Moved in 1990 to 1994 (%) - Multirace
Year householder moved into unit - Moved in 1990 to 1994 (%) - Other Race
Year householder moved into unit - Moved in 1980 to 1989 (%)
Year householder moved into unit - Moved in 1980 to 1989 (%) - White
Year householder moved into unit - Moved in 1980 to 1989 (%) - Black or African American
Year householder moved into unit - Moved in 1980 to 1989 (%) - Asian
Year householder moved into unit - Moved in 1980 to 1989 (%) - Hispanic or Latino
Year householder moved into unit - Moved in 1980 to 1989 (%) - American Indian and Alaska Native
Year householder moved into unit - Moved in 1980 to 1989 (%) - Multirace
Year householder moved into unit - Moved in 1980 to 1989 (%) - Other Race
Year householder moved into unit - Moved in 1970 to 1979 (%)
Year householder moved into unit - Moved in 1970 to 1979 (%) - White
Year householder moved into unit - Moved in 1970 to 1979 (%) - Black or African American
Year householder moved into unit - Moved in 1970 to 1979 (%) - Asian
Year householder moved into unit - Moved in 1970 to 1979 (%) - Hispanic or Latino
Year householder moved into unit - Moved in 1970 to 1979 (%) - American Indian and Alaska Native
Year householder moved into unit - Moved in 1970 to 1979 (%) - Multirace
Year householder moved into unit - Moved in 1970 to 1979 (%) - Other Race
Year householder moved into unit - Moved in 1969 or earlier (%)
Year householder moved into unit - Moved in 1969 or earlier (%) - White
Year householder moved into unit - Moved in 1969 or earlier (%) - Black or African American
Year householder moved into unit - Moved in 1969 or earlier (%) - Asian
Year householder moved into unit - Moved in 1969 or earlier (%) - Hispanic or Latino
Year householder moved into unit - Moved in 1969 or earlier (%) - American Indian and Alaska Native
Year householder moved into unit - Moved in 1969 or earlier (%) - Multirace
Year householder moved into unit - Moved in 1969 or earlier (%) - Other Race
Housing units lacking complete plumbing facilities (%)
Housing units lacking complete kitchen facilities (%)
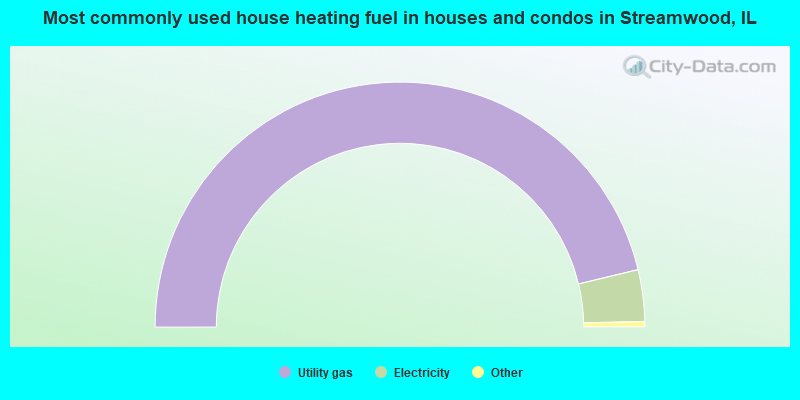
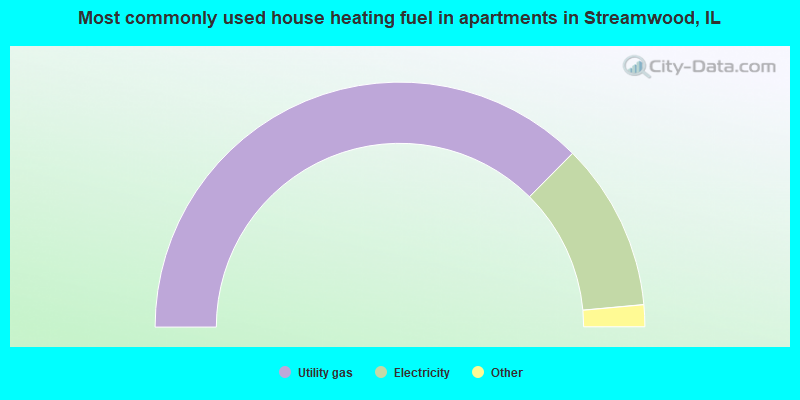
House heating fuel used in houses and condos - Utility gas (%)
House heating fuel used in houses and condos - Bottled, tank, or LP gas (%)
House heating fuel used in houses and condos - Electricity (%)
House heating fuel used in houses and condos - Fuel oil, kerosene, etc. (%)
House heating fuel used in houses and condos - Coal or coke (%)
House heating fuel used in houses and condos - Wood (%)
House heating fuel used in houses and condos - Solar energy (%)
House heating fuel used in houses and condos - Other fuel (%)
House heating fuel used in houses and condos - No fuel used (%)
House heating fuel used in apartments - Utility gas (%)
House heating fuel used in apartments - Bottled, tank, or LP gas (%)
House heating fuel used in apartments - Electricity (%)
House heating fuel used in apartments - Fuel oil, kerosene, etc. (%)
House heating fuel used in apartments - Coal or coke (%)
House heating fuel used in apartments - Wood (%)
House heating fuel used in apartments - Solar energy (%)
House heating fuel used in apartments - Other fuel (%)
House heating fuel used in apartments - No fuel used (%)
Latest news about housing in Streamwood, IL collected exclusively by city-data.com from local newspapers, TV, and radio stations
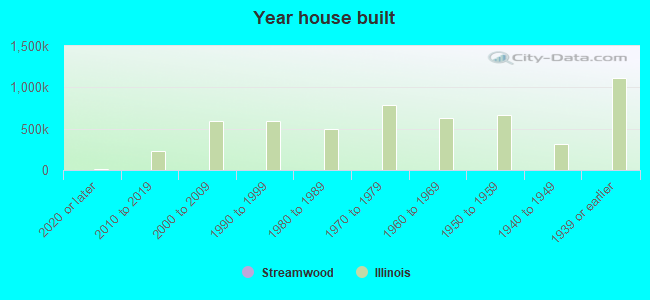
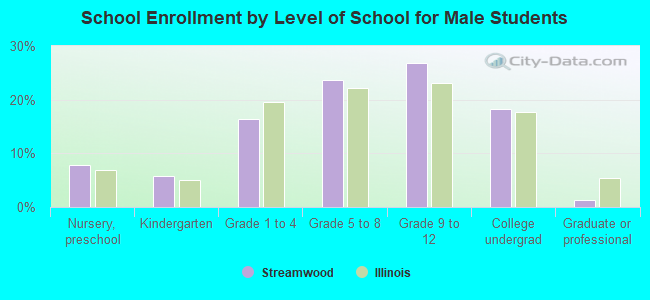
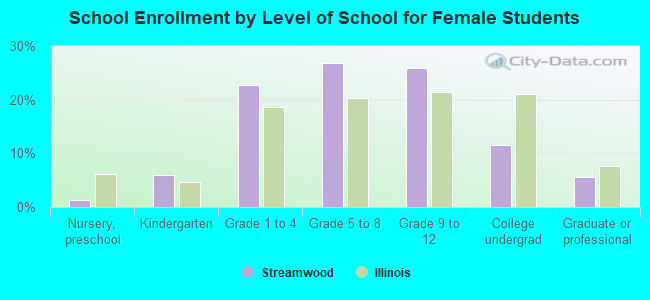
Median year house/condo built: 1980Median year apartment built: 1985Household type by relationship:
Households: 38,677
Male householders: 7,257 (1,639 living alone ), Female householders: 5,682 (1,465 living alone )7,105 spouses (7,105 opposite-sex spouses ), 1,085 unmarried partners , (1,085 opposite-sex unmarried partners ), 12,720 children (12,237 natural , 116 adopted , 365 stepchildren ), 1,204 grandchildren , 363 brothers or sisters , 1,046 parents , 0 foster children , 1,189 other relatives , 805 non-relatives In group quarters: 216
Size of family households: 3,107 2-persons , 2,026 3-persons , 2,160 4-persons , 946 5-persons , 560 6-persons , 643 7-or-more-persons .
Size of nonfamily households: 3,335 1-person , 520 2-persons , 50 3-persons , 25 4-persons , 6 6-persons .
5,340 married couples with children. single-parent households (751 men , 1,273 women ).
51.6% of residents of Streamwood speak English at home. of residents speak Spanish at home (66% speak English very well , 16% speak English well , 9% speak English not well , 9% don't speak English at all ).of residents speak other Indo-European language at home (65% speak English very well , 22% speak English well , 9% speak English not well , 5% don't speak English at all ).of residents speak Asian or Pacific Island language at home (61% speak English very well , 22% speak English well , 16% speak English not well , 1% don't speak English at all ).of residents speak other language at home (85% speak English very well , 13% speak English well , 3% speak English not well ).
Foreign born population: 12,015 (31.1%)of them are naturalized citizens )
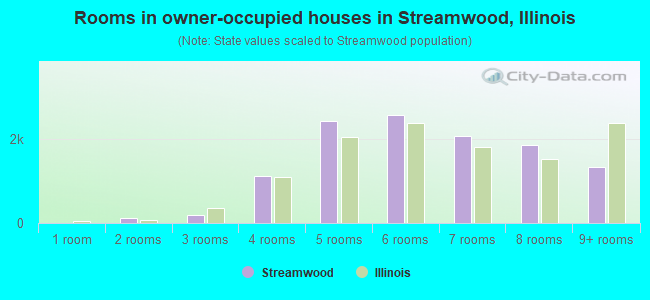
Median number of rooms in houses and condos:
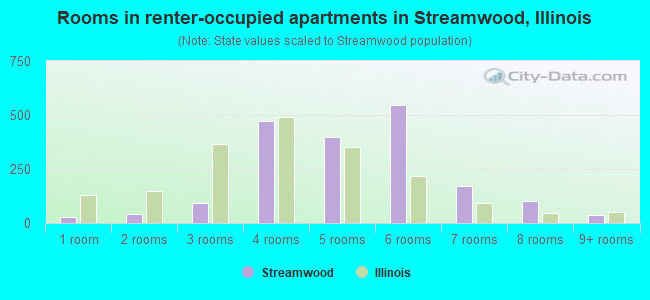
Median number of rooms in apartments
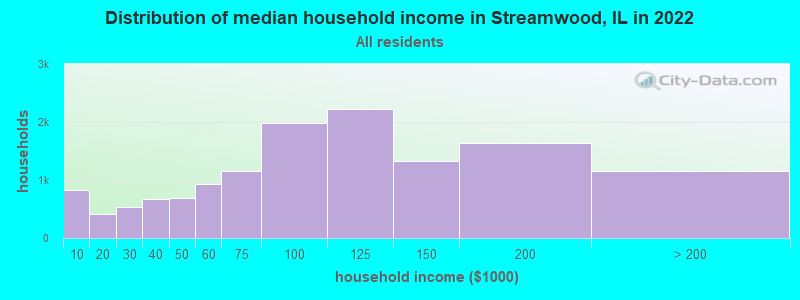
Streamwood, IL household income distribution 834 Less than $10,000407 $10,000 to $19,999538 $20,000 to $29,999672 $30,000 to $39,999692 $40,000 to $49,999932 $50,000 to $59,9991,150 $60,000 to $74,9991,986 $75,000 to $99,9992,226 $100,000 to $124,9991,322 $125,000 to $149,9991,637 $150,000 to $199,9991,148 $200,000 or more
Home value of owner - occupied houses in 2022 in Streamwood, IL 166 Less than $10,00046 $10,000 to $14,9996 $15,000 to $19,99977 $20,000 to $24,99949 $25,000 to $29,99922 $30,000 to $34,99914 $35,000 to $39,99914 $40,000 to $49,9991 $50,000 to $59,99915 $70,000 to $79,99935 $80,000 to $89,99920 $90,000 to $99,999342 $100,000 to $124,999142 $125,000 to $149,999665 $150,000 to $174,999986 $175,000 to $199,9993,178 $200,000 to $249,9992,916 $250,000 to $299,9992,068 $300,000 to $399,999539 $400,000 to $499,999246 $500,000 to $749,99920 $750,000 to $999,9993 $1,000,000 to $1,499,9999 $2,000,000 or moreRent paid by renters in 2022 in Streamwood, IL 21 Less than $10011 $500 to $54919 $650 to $699188 $800 to $89911 $900 to $999159 $1,000 to $1,249376 $1,250 to $1,499883 $1,500 to $1,999192 $2,000 to $2,4999 $2,500 to $2,99918 $3,500 or more31 No cash rent
Percentage of workers working in this county: 69.7%Number of people working at home: 2,909 (14.0% of all workers )
Travel time to work (commute)
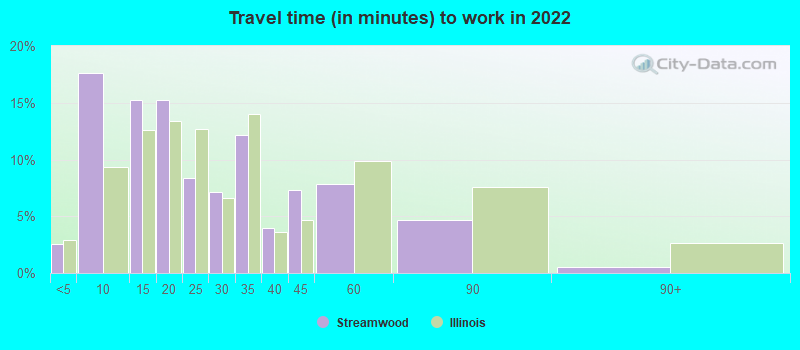
Less than 5 minutes: 2925 to 9 minutes: 1,35810 to 14 minutes: 1,37015 to 19 minutes: 2,46520 to 24 minutes: 2,67525 to 29 minutes: 1,71530 to 34 minutes: 3,09135 to 39 minutes: 76240 to 44 minutes: 85445 to 59 minutes: 1,48560 to 89 minutes: 1,13590 or more minutes: 509
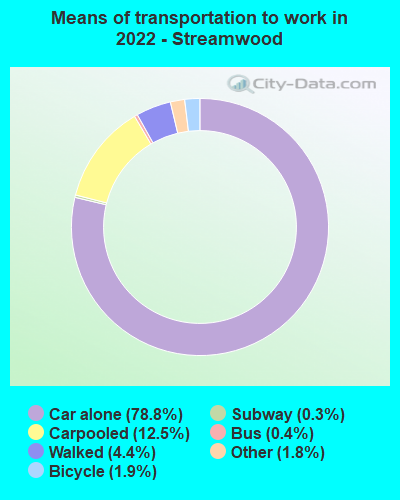
Means of transportation to work:
Drove a car alone: 5,298 (58.4%)Carpooled: 897 (9.9%)Bus : 24 (0.3%)Long-distance train or commuter rail : 12 (0.1%)Taxi: 121 (1.3%)Bicycle: 135 (1.5%)Walked: 303 (3.3%)Worked at home: 2,909 (32.1%)
Unemployment by race in 2022
Unemployment rate for White non-Hispanic residents 4.1% Males3.8% FemalesUnemployment rate for Black residents 7.2% Males9.6% FemalesUnemployment rate for Asian residents 1.8% Males2.6% FemalesUnemployment rate for other race residents 0.3% Males1.4% FemalesUnemployment rate for two or more race residents 0.4% FemalesUnemployment rate for Hispanic or Latino residents 0.1% Males0.8% Females
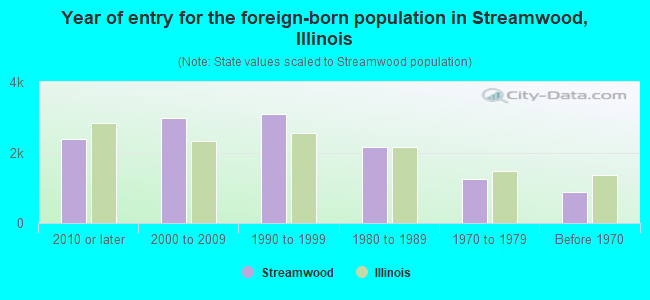
Year of entry for the foreign-born population in Streamwood, Illinois
2,372 2010 or later 2,972 2000 to 2009 3,079 1990 to 1999 2,159 1980 to 1989 1,257 1970 to 1979 885 Before 1970
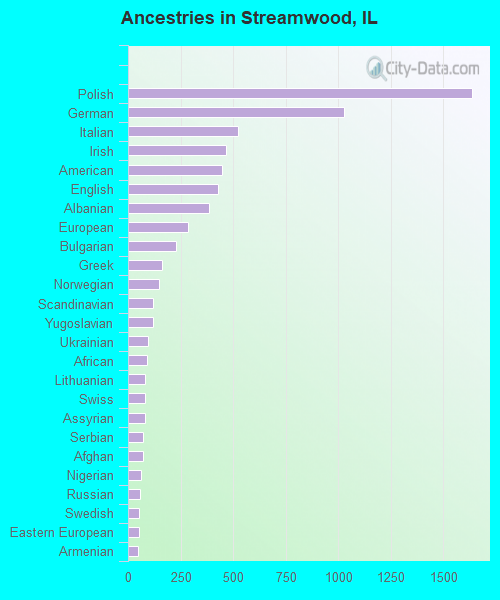
First ancestries reported:
Polish: 1,635 (7.1%)
German: 1,026 (4.4%)
Italian: 522 (2.3%)
Irish: 464 (2.0%)
American: 447 (1.9%)
English: 426 (1.8%)
Albanian: 383 (1.7%)
European: 287 (1.2%)
Bulgarian: 228 (1.0%)
Greek: 162 (0.7%)
Norwegian: 149 (0.6%)
Scandinavian: 121 (0.5%)
Yugoslavian: 118 (0.5%)
Ukrainian: 94 (0.4%)
African: 92 (0.4%)
Lithuanian: 83 (0.4%)
Swiss: 82 (0.4%)
Assyrian: 80 (0.3%)
Serbian: 71 (0.3%)
Afghan: 70 (0.3%)
Nigerian: 64 (0.3%)
Russian: 56 (0.2%)
Swedish: 54 (0.2%)
Eastern European: 53 (0.2%)
Armenian: 49 (0.2%)
Dutch: 49 (0.2%)
British: 45 (0.2%)
French Canadian: 45 (0.2%)
Romanian: 41 (0.2%)
Northern European: 36 (0.2%)
Slavic: 33 (0.1%)
Turkish: 30 (0.1%)
Latvian: 29 (0.1%)
French: 27 (0.1%)
Czech: 23 (0.10%)
Danish: 13 (0.06%)
Icelander: 11 (0.05%)
Slovak: 11 (0.05%)
Macedonian: 8 (0.03%)
Austrian: 7 (0.03%)
Welsh: 4 (0.02%) Most common places of birth for foreign-born residents (%): Mexico Streamwood:
42.0% (5,047)Illinois:
34.7% (626,958)
India Streamwood:
14.6% (1,756)Illinois:
9.2% (166,409)
Philippines Streamwood:
10.6% (1,270)Illinois:
5.2% (93,003)
Poland Streamwood:
7.5% (897)Illinois:
6.9% (124,474)
Korea Streamwood:
3.1% (378)Illinois:
2.2% (40,393)
Venezuela Streamwood:
2.2% (267)Illinois:
0.5% (9,688)
Bulgaria Streamwood:
1.7% (204)Illinois:
0.8% (14,165)
Place of birth for U.S.-born residents:
This state: 22,018Other state: 4,255Northeast: 996Midwest: 1,427South: 824West: 1,004 92.6% of Streamwood residents lived in the same house 1 years ago.
Out of people who lived in different houses, 37.1% lived in this county.
Out of people who lived in different counties, 78.0% lived in Illinois.
Streamwood:
92.6%State average:
88.3%
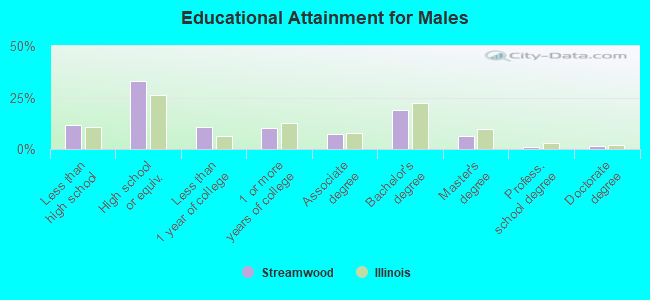
Education attainment for males 25 years and older:
No schooling: 364Nursery to 4th grade: 1655th and 6th grade: 2627th and 8th grade: 1019th grade: 8010th grade: 13111th grade: 15012th grade, no diploma: 345High school graduate (or equivalency): 4,445Less than 1 year of college: 1,462Some college more than 1 year, no degree: 1,365Associate degree: 980Bachelor's degree: 2,538Master's degree: 824Professional school degree: 122Doctorate degree: 202
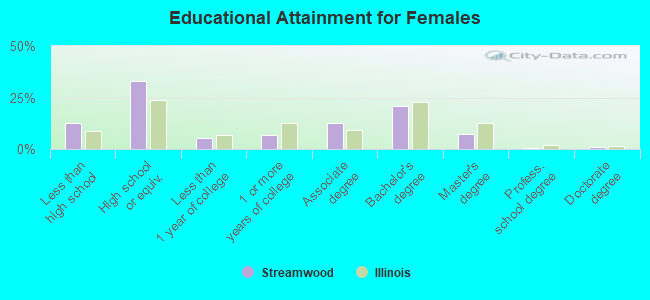
Education attainment for females 25 years and older:
No schooling: 346Nursery to 4th grade: 945th and 6th grade: 2697th and 8th grade: 989th grade: 20310th grade: 18611th grade: 9912th grade, no diploma: 353High school graduate (or equivalency): 4,390Less than 1 year of college: 706Some college more than 1 year, no degree: 904Associate degree: 1,663Bachelor's degree: 2,745Master's degree: 979Professional school degree: 62Doctorate degree: 151
Housing units in structures:
One, detached: 9,374One, attached: 2,955Two: 763 or 4: 3115 to 9: 65810 to 19: 1920 to 49: 11450 or more: 113Mobile homes: 56Median worth of mobile homes: $10,110
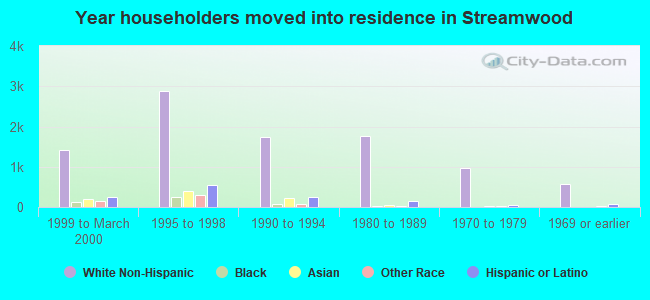
Housing units lacking complete plumbing facilities in 2022: 0.3%Housing units lacking complete kitchen facilities in 2022: 0.2%House/condo owner moved in on average 12 years ago
Renter moved in on average 3 years ago
Private vs. public school enrollment:
Students in private schools in grades 1 to 8 (elementary and middle school): 349 Students in private schools in grades 9 to 12 (high school): 133 Students in private undergraduate colleges: 290