Staunton, VA (Virginia) Houses and Residents
Estimated median house or condo value in 2022: $239,963 (it was $88,000 in 2000 )
Staunton:
$239,963Virginia:
$365,700
Lower value quartile - upper value quartile: $166,830 - $314,596Mean price in 2022: Detached houses: $346,625 Here:
$346,625State:
$472,865
Townhouses or other attached units: $293,427 Here:
$293,427State:
$457,437
In 2-unit structures: $438,219 Here:
$438,219State:
$396,289
In 5-or-more-unit structures: $255,314 Here:
$255,314State:
$382,551
Mobile homes: $161,102 Here:
$161,102State:
$100,736
Total population: 24,538 (Urban population: 23,646 (all inside urban clusters), Rural population: 207 (21 farm, 186 nonfarm ))
Houses: 12,464 (11,218 occupied: 6,882 owner occupied, 4,688 renter occupied )
% of renters here:
41%State:
33%
Housing density: 632 houses/condos per square mile
Median price asked for vacant for-sale houses and condos in 2022: $181,604.
Median contract rent in 2022: $813 (lower quartile is $546, upper quartile is $1,216)
Median rent asked for vacant for-rent units in 2022: $1,082
Median gross rent in Staunton, VA in 2022: $937
Housing units in Staunton with a mortgage: 4,264 (417 second mortgage, 0 home equity loan, 307 both second mortgage and home equity loan )Houses without a mortgage: 197
Median household income for houses/condos with a mortgage: $91,445
Median household income for apartments without a mortgage: $57,130
Median monthly housing costs: $952
Data:
Median house or condo value ($)
Median house or condo value ($ change since 2000)
Median house or condo value ($) - White
Median house or condo value ($) - Black or African American
Median house or condo value ($) - Asian
Median house or condo value ($) - Hispanic or Latino
Median house or condo value ($) - American Indian and Alaska Native
Median house or condo value ($) - Multirace
Median house or condo value ($) - Other Race
Median price asked for mobile homes ($)
Household density (households per square mile)
Mean house or condo value by units in structure - 1, detached ($)
Mean house or condo value by units in structure - 1, attached ($)
Mean house or condo value by units in structure - 2 ($)
Mean house or condo value by units in structure by units in structure - 3 or 4 ($)
Mean house or condo value by units in structure - 5 or more ($)
Mean house or condo value by units in structure - Boat, RV, van, etc. ($)
Mean house or condo value by units in structure - Mobile home ($)
Median contract rent ($)
Median contract rent - Lower quartile ($)
Median contract rent - Upper quartile ($)
Median gross rent ($)
Urban houses (%)
Rural houses (%)
Houses occupied (%)
Houses occupied (% change since 2000)
Houses owner occupied (%)
Houses owner occupied (% change since 2000)
Houses renter occupied (%)
Houses renter occupied (% change since 2000)
Vacant housing units - For rent (%)
Vacant housing units - For rent (% change since 2000)
Vacant housing units - For sale only (%)
Vacant housing units - For sale only (% change since 2000)
Vacant housing units - Rented or sold, not occupied (%)
Vacant housing units - Rented or sold, not occupied (% change since 2000)
Vacant housing units - For seasonal, recreational, or occasional use (%)
Vacant housing units - For seasonal, recreational, or occasional use (% change since 2000)
Vacant housing units - For migrant workers (%)
Vacant housing units - For migrant workers (% change since 2000)
Vacant housing units - Other vacant (%)
Vacant housing units - Other vacant (% change since 2000)
Median monthly housing costs ($)
Median household income for houses/condos with a mortgage ($)
Median household income for houses/condos without a mortgage ($)
Median household income ($)
Median household income ($) - White
Median household income ($) - Black or African American
Median household income ($) - Asian
Median household income ($) - Hispanic or Latino
Median household income ($) - American Indian and Alaska Native
Median household income ($) - Multirace
Median household income ($) - Other Race
Mortgage status - with mortgage (%)
Mortgage status - with second mortgage (%)
Mortgage status - with home equity loan (%)
Mortgage status - with both second mortgage and home equity loan (%)
Mortgage status - without a mortgage (%)
Median year house/condo built
Median year apartment built
Household type by relationship - Male householder living alone (%)
Household type by relationship - Male householder not living alone (%)
Household type by relationship - Female householder living alone (%)
Household type by relationship - Female householder not living alone (%)
Household type by relationship - Opposite-Sex spouse (%)
Household type by relationship - Same-Sex spouse (%)
Household type by relationship - Opposite-Sex unmarried partner (%)
Household type by relationship - Same-Sex unmarried partner (%)
Household type by relationship - In group quarters (%)
Size of family households - 2-person household (%)
Size of family households - 3-person household (%)
Size of family households - 4-person household (%)
Size of family households - 5-person household (%)
Size of family households - 6-person household (%)
Size of family households - 7-or-more-person household (%)
Size of nonfamily households - 1-person household (%)
Size of nonfamily households - 2-person household (%)
Size of nonfamily households - 3-person household (%)
Size of nonfamily households - 4-person household (%)
Size of nonfamily households - 5-person household (%)
Size of nonfamily households - 6-person household (%)
Size of nonfamily households - 7-or-moreperson household (%)
Year house built - Built 2010 or later (%)
Year house built - Built 2000 to 2009 (%)
Year house built - Built 1990 to 1999 (%)
Year house built - Built 1980 to 1989 (%)
Year house built - Built 1970 to 1979 (%)
Year house built - Built 1960 to 1969 (%)
Year house built - Built 1950 to 1959 (%)
Year house built - Built 1940 to 1949 (%)
Year house built - Built 1939 or earlier (%)
Median number of rooms in houses and condos
Median number of rooms in apartments
Median number of bedrooms in owner occupied houses
Mean number of bedrooms in owner occupied houses
Median number of bedrooms in renter occupied houses
Mean number of bedrooms in renter occupied houses
Median number of vehichles in owner occupied houses
Mean number of vehichles in owner occupied houses
Median number of vehichles in renter occupied houses
Mean number of vehichles in renter occupied houses
Rooms in owner-occupied houses - 1 room (%)
Rooms in owner-occupied houses - 2 rooms (%)
Rooms in owner-occupied houses - 3 rooms (%)
Rooms in owner-occupied houses - 4 rooms (%)
Rooms in owner-occupied houses - 5 rooms (%)
Rooms in owner-occupied houses - 6 rooms (%)
Rooms in owner-occupied houses - 7 rooms (%)
Rooms in owner-occupied houses - 8 rooms (%)
Rooms in owner-occupied houses - 9+ rooms (%)
Rooms in renter-occupied houses - 1 room (%)
Rooms in renter-occupied houses - 2 rooms (%)
Rooms in renter-occupied houses - 3 rooms (%)
Rooms in renter-occupied houses - 4 rooms (%)
Rooms in renter-occupied houses - 5 rooms (%)
Rooms in renter-occupied houses - 6 rooms (%)
Rooms in renter-occupied houses - 7 rooms (%)
Rooms in renter-occupied houses - 8 rooms (%)
Rooms in renter-occupied houses - 9+ rooms (%)
Bedrooms in owner-occupied houses - no bedrooms (%)
Bedrooms in owner-occupied houses - 1 bedroom (%)
Bedrooms in owner-occupied houses - 2 bedrooms (%)
Bedrooms in owner-occupied houses - 3 bedrooms (%)
Bedrooms in owner-occupied houses - 4 bedrooms (%)
Bedrooms in owner-occupied houses - 5+ bedrooms (%)
Bedrooms in renter-occupied houses - no bedrooms (%)
Bedrooms in renter-occupied houses - 1 bedroom (%)
Bedrooms in renter-occupied houses - 2 bedrooms (%)
Bedrooms in renter-occupied houses - 3 bedrooms (%)
Bedrooms in renter-occupied houses - 4 bedrooms (%)
Bedrooms in renter-occupied houses - 5+ bedrooms (%)
Vehicles available in owner-occupied houses - no vehicle available (%)
Vehicles available in owner-occupied houses - 1 vehicle available(%)
Vehicles available in owner-occupied houses - 2 Vehicles available (%)
Vehicles available in owner-occupied houses - 3 Vehicles available (%)
Vehicles available in owner-occupied houses - 4 Vehicles available (%)
Vehicles available in owner-occupied houses - 5+ Vehicles available (%)
Vehicles available in renter-occupied houses - no vehicle available (%)
Vehicles available in renter-occupied houses - 1 vehicle available (%)
Vehicles available in renter-occupied houses - 2 Vehicles available (%)
Vehicles available in renter-occupied houses - 3 Vehicles available (%)
Vehicles available in renter-occupied houses - 4 Vehicles available (%)
Vehicles available in renter-occupied houses - 5+ Vehicles available (%)
Housing units in structures - 1, detached (%)
Housing units in structures - 1, attached (%)
Housing units in structures - 2 (%)
Housing units in structures - 3 or 4 (%)
Housing units in structures - 5 to 9 (%)
Housing units in structures - 10 to 19 (%)
Housing units in structures - 20 to 49 (%)
Housing units in structures - 50 or more (%)
Housing units in structures - Mobile home (%)
Housing units in structures - Boat, RV, van, etc. (%)
Housing units in structures - Owners - 1, detached (%)
Housing units in structures - Owners - 1, attached (%)
Housing units in structures - Owners - 2 (%)
Housing units in structures - Owners - 3 or 4 (%)
Housing units in structures - Owners - 5 to 9 (%)
Housing units in structures - Owners - 10 to 19 (%)
Housing units in structures - Owners - 20 to 49 (%)
Housing units in structures - Owners - 50 or more (%)
Housing units in structures - Owners - Mobile home (%)
Housing units in structures - Owners - Boat, RV, van, etc. (%)
Housing units in structures - Renters - 1, detached (%)
Housing units in structures - Renters - 1, attached (%)
Housing units in structures - Renters - 2 (%)
Housing units in structures - Renters - 3 or 4 (%)
Housing units in structures - Renters - 5 to 9 (%)
Housing units in structures - Renters - 10 to 19 (%)
Housing units in structures - Renters - 20 to 49 (%)
Housing units in structures - Renters - 50 or more (%)
Housing units in structures - Renters - Mobile home (%)
Housing units in structures - Renters - Boat, RV, van, etc. (%)
House/condo owner moved in on average (years ago)
Renter moved in on average (years ago)
Year householder moved into unit - Moved in 1999 to March 2000 (%)
Year householder moved into unit - Moved in 1999 to March 2000 (%) - White
Year householder moved into unit - Moved in 1999 to March 2000 (%) - Black or African American
Year householder moved into unit - Moved in 1999 to March 2000 (%) - Asian
Year householder moved into unit - Moved in 1999 to March 2000 (%) - Hispanic or Latino
Year householder moved into unit - Moved in 1999 to March 2000 (%) - American Indian and Alaska Native
Year householder moved into unit - Moved in 1999 to March 2000 (%) - Multirace
Year householder moved into unit - Moved in 1999 to March 2000 (%) - Other Race
Year householder moved into unit - Moved in 1995 to 1998 (%)
Year householder moved into unit - Moved in 1995 to 1998 (%) - White
Year householder moved into unit - Moved in 1995 to 1998 (%) - Black or African American
Year householder moved into unit - Moved in 1995 to 1998 (%) - Asian
Year householder moved into unit - Moved in 1995 to 1998 (%) - Hispanic or Latino
Year householder moved into unit - Moved in 1995 to 1998 (%) - American Indian and Alaska Native
Year householder moved into unit - Moved in 1995 to 1998 (%) - Multirace
Year householder moved into unit - Moved in 1995 to 1998 (%) - Other Race
Year householder moved into unit - Moved in 1990 to 1994 (%)
Year householder moved into unit - Moved in 1990 to 1994 (%) - White
Year householder moved into unit - Moved in 1990 to 1994 (%) - Black or African American
Year householder moved into unit - Moved in 1990 to 1994 (%) - Asian
Year householder moved into unit - Moved in 1990 to 1994 (%) - Hispanic or Latino
Year householder moved into unit - Moved in 1990 to 1994 (%) - American Indian and Alaska Native
Year householder moved into unit - Moved in 1990 to 1994 (%) - Multirace
Year householder moved into unit - Moved in 1990 to 1994 (%) - Other Race
Year householder moved into unit - Moved in 1980 to 1989 (%)
Year householder moved into unit - Moved in 1980 to 1989 (%) - White
Year householder moved into unit - Moved in 1980 to 1989 (%) - Black or African American
Year householder moved into unit - Moved in 1980 to 1989 (%) - Asian
Year householder moved into unit - Moved in 1980 to 1989 (%) - Hispanic or Latino
Year householder moved into unit - Moved in 1980 to 1989 (%) - American Indian and Alaska Native
Year householder moved into unit - Moved in 1980 to 1989 (%) - Multirace
Year householder moved into unit - Moved in 1980 to 1989 (%) - Other Race
Year householder moved into unit - Moved in 1970 to 1979 (%)
Year householder moved into unit - Moved in 1970 to 1979 (%) - White
Year householder moved into unit - Moved in 1970 to 1979 (%) - Black or African American
Year householder moved into unit - Moved in 1970 to 1979 (%) - Asian
Year householder moved into unit - Moved in 1970 to 1979 (%) - Hispanic or Latino
Year householder moved into unit - Moved in 1970 to 1979 (%) - American Indian and Alaska Native
Year householder moved into unit - Moved in 1970 to 1979 (%) - Multirace
Year householder moved into unit - Moved in 1970 to 1979 (%) - Other Race
Year householder moved into unit - Moved in 1969 or earlier (%)
Year householder moved into unit - Moved in 1969 or earlier (%) - White
Year householder moved into unit - Moved in 1969 or earlier (%) - Black or African American
Year householder moved into unit - Moved in 1969 or earlier (%) - Asian
Year householder moved into unit - Moved in 1969 or earlier (%) - Hispanic or Latino
Year householder moved into unit - Moved in 1969 or earlier (%) - American Indian and Alaska Native
Year householder moved into unit - Moved in 1969 or earlier (%) - Multirace
Year householder moved into unit - Moved in 1969 or earlier (%) - Other Race
Housing units lacking complete plumbing facilities (%)
Housing units lacking complete kitchen facilities (%)
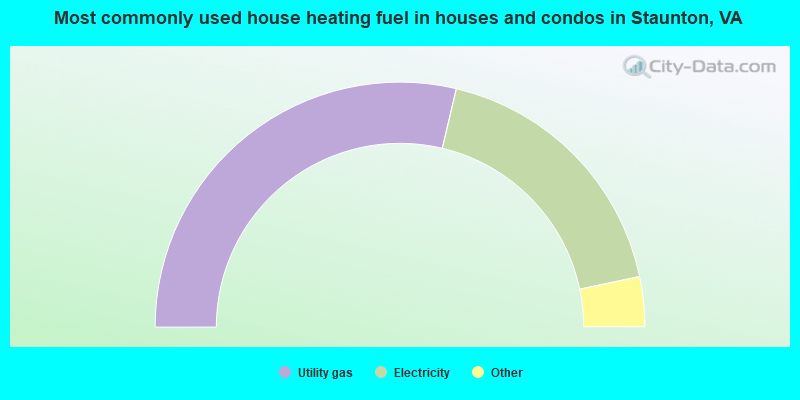
House heating fuel used in houses and condos - Utility gas (%)
House heating fuel used in houses and condos - Bottled, tank, or LP gas (%)
House heating fuel used in houses and condos - Electricity (%)
House heating fuel used in houses and condos - Fuel oil, kerosene, etc. (%)
House heating fuel used in houses and condos - Coal or coke (%)
House heating fuel used in houses and condos - Wood (%)
House heating fuel used in houses and condos - Solar energy (%)
House heating fuel used in houses and condos - Other fuel (%)
House heating fuel used in houses and condos - No fuel used (%)
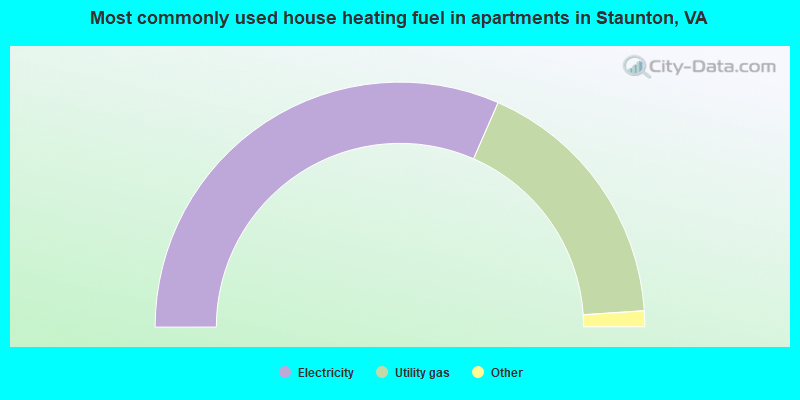
House heating fuel used in apartments - Utility gas (%)
House heating fuel used in apartments - Bottled, tank, or LP gas (%)
House heating fuel used in apartments - Electricity (%)
House heating fuel used in apartments - Fuel oil, kerosene, etc. (%)
House heating fuel used in apartments - Coal or coke (%)
House heating fuel used in apartments - Wood (%)
House heating fuel used in apartments - Solar energy (%)
House heating fuel used in apartments - Other fuel (%)
House heating fuel used in apartments - No fuel used (%)
Latest news about housing in Staunton, VA collected exclusively by city-data.com from local newspapers, TV, and radio stations
Median year house/condo built: 1966Median year apartment built: 1969Household type by relationship:
Households: 25,789
Male householders: 5,031 (1,753 living alone ), Female householders: 6,122 (2,376 living alone )4,261 spouses (4,134 opposite-sex spouses ), 922 unmarried partners , (906 opposite-sex unmarried partners ), 5,808 children (5,265 natural , 227 adopted , 315 stepchildren ), 584 grandchildren , 104 brothers or sisters , 332 parents , 0 foster children , 386 other relatives , 764 non-relatives In group quarters: 1,469
Size of family households: 3,253 2-persons , 1,343 3-persons , 1,363 4-persons , 277 5-persons , 125 6-persons , 118 7-or-more-persons .
Size of nonfamily households: 4,303 1-person , 672 2-persons , 69 3-persons .
2,761 married couples with children. single-parent households (131 men , 939 women ).
93.7% of residents of Staunton speak English at home. of residents speak Spanish at home (68% speak English very well , 13% speak English well , 16% speak English not well , 3% don't speak English at all ).of residents speak other Indo-European language at home (80% speak English very well , 20% speak English well ).of residents speak Asian or Pacific Island language at home (57% speak English very well , 27% speak English well , 10% speak English not well , 5% don't speak English at all ).of residents speak other language at home (52% speak English very well , 7% speak English well , 12% speak English not well , 30% don't speak English at all ).
Foreign born population: 1,195 (4.6%)of them are naturalized citizens )
Median number of rooms in houses and condos:
Median number of rooms in apartments
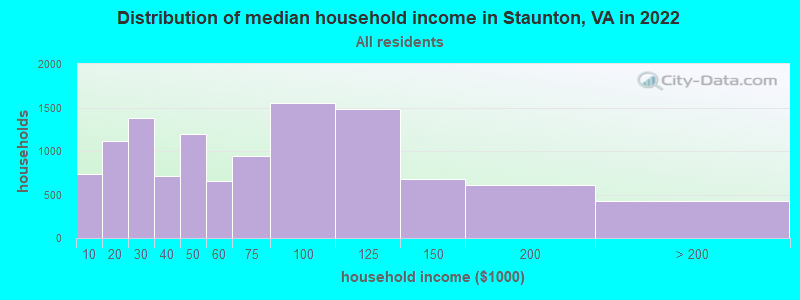
Staunton, VA household income distribution 734 Less than $10,0001,112 $10,000 to $19,9991,375 $20,000 to $29,999717 $30,000 to $39,9991,200 $40,000 to $49,999658 $50,000 to $59,999938 $60,000 to $74,9991,555 $75,000 to $99,9991,486 $100,000 to $124,999675 $125,000 to $149,999610 $150,000 to $199,999423 $200,000 or more
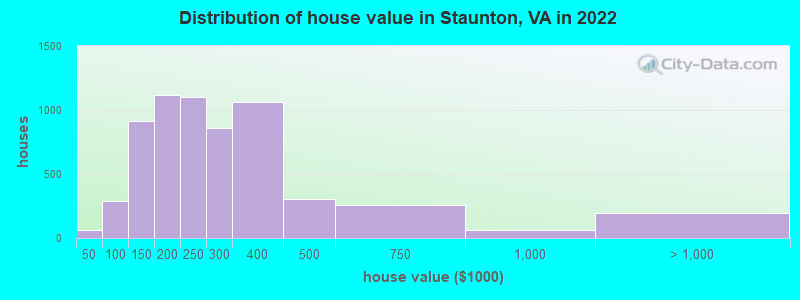
Home value of owner - occupied houses in 2022 in Staunton, VA 24 Less than $10,00031 $10,000 to $14,9998 $15,000 to $19,99920 $50,000 to $59,99960 $60,000 to $69,99980 $80,000 to $89,999123 $90,000 to $99,999436 $100,000 to $124,999475 $125,000 to $149,999620 $150,000 to $174,999499 $175,000 to $199,9991,103 $200,000 to $249,999862 $250,000 to $299,9991,059 $300,000 to $399,999306 $400,000 to $499,999254 $500,000 to $749,99959 $750,000 to $999,99958 $1,000,000 to $1,499,99927 $1,500,000 to $1,999,999108 $2,000,000 or moreRent paid by renters in 2022 in Staunton, VA 20 Less than $10011 $100 to $14933 $150 to $19944 $200 to $24933 $250 to $29988 $300 to $34952 $350 to $39936 $400 to $449198 $450 to $49999 $500 to $549295 $550 to $599180 $600 to $649156 $650 to $699285 $700 to $749507 $750 to $799411 $800 to $899312 $900 to $999625 $1,000 to $1,249243 $1,250 to $1,499207 $1,500 to $1,999140 $2,000 to $2,49969 $2,500 to $2,999108 $3,500 or more236 No cash rent
Percentage of workers working in this county: 51.2%Number of people working at home: 877 (7.2% of all workers )
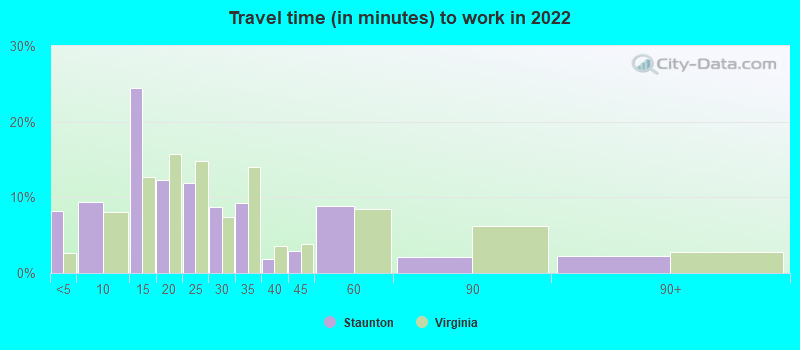
Travel time to work (commute)
Less than 5 minutes: 9275 to 9 minutes: 1,18110 to 14 minutes: 2,60615 to 19 minutes: 2,08220 to 24 minutes: 1,11825 to 29 minutes: 87730 to 34 minutes: 1,11135 to 39 minutes: 33440 to 44 minutes: 38945 to 59 minutes: 54860 to 89 minutes: 11990 or more minutes: 235
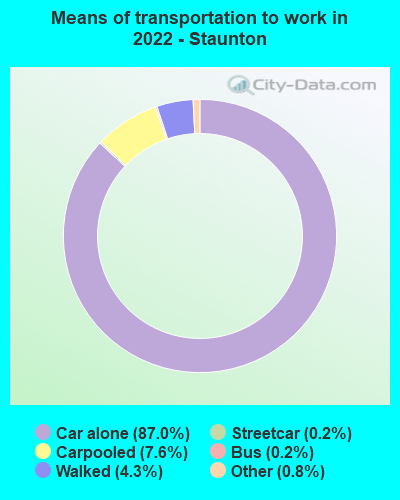
Means of transportation to work:
Drove a car alone: 9,661 (78.3%)Carpooled: 855 (6.9%)Bus : 15 (0.1%)Subway or elevated rail : 11 (0.1%)Taxi: 101 (0.8%)Walked: 508 (4.1%)Worked at home: 877 (7.1%)
Unemployment by race in 2022
Unemployment rate for White non-Hispanic residents 7.4% Males2.2% FemalesUnemployment rate for Black residents 10.8% Males1.4% FemalesUnemployment rate for two or more race residents 13.3% FemalesUnemployment rate for Hispanic or Latino residents 8.6% Females
Year of entry for the foreign-born population in Staunton, Virginia
550 2010 or later 186 2000 to 2009 143 1990 to 1999 92 1980 to 1989 89 1970 to 1979 194 Before 1970
First ancestries reported:
English: 2,032 (18.2%)
German: 1,341 (12.0%)
American: 1,170 (10.5%)
Irish: 826 (7.4%)
European: 485 (4.3%)
Scotch-Irish: 446 (4.0%)
Italian: 226 (2.0%)
Scottish: 220 (2.0%)
Swedish: 200 (1.8%)
French: 141 (1.3%)
Jamaican: 110 (1.0%)
British: 89 (0.8%)
African: 79 (0.7%)
Eastern European: 70 (0.6%)
Polish: 66 (0.6%)
Dutch: 55 (0.5%)
Norwegian: 54 (0.5%)
Portuguese: 52 (0.5%)
Russian: 43 (0.4%)
Greek: 43 (0.4%)
Lithuanian: 28 (0.3%)
Scandinavian: 22 (0.2%)
French Canadian: 19 (0.2%)
South African: 17 (0.2%)
Haitian: 17 (0.2%)
Swiss: 16 (0.1%)
Australian: 15 (0.1%)
Ukrainian: 15 (0.1%)
Celtic: 13 (0.1%)
Carpatho Rusyn: 12 (0.1%)
Northern European: 9 (0.08%)
Croatian: 8 (0.07%)
Nigerian: 8 (0.07%)
Slavic: 7 (0.06%)
Bahamian: 5 (0.04%)
Ethiopian: 5 (0.04%)
Danish: 4 (0.04%)
Brazilian: 4 (0.04%)
West Indian: 3 (0.03%)
Austrian: 2 (0.02%) Most common places of birth for foreign-born residents (%): Korea Staunton:
10.6% (115)Virginia:
4.9% (52,857)
Japan Staunton:
10.1% (110)Virginia:
0.8% (8,805)
Argentina Staunton:
8.5% (92)Virginia:
0.5% (4,997)
Jamaica Staunton:
8.1% (88)Virginia:
1.0% (10,734)
Nigeria Staunton:
5.0% (54)Virginia:
0.6% (6,956)
Germany Staunton:
4.3% (47)Virginia:
1.7% (18,227)
Haiti Staunton:
4.3% (47)Virginia:
0.4% (4,246)
El Salvador Staunton:
4.3% (47)Virginia:
9.9% (107,534)
Portugal Staunton:
4.0% (43)Virginia:
0.2% (1,848)
Mexico Staunton:
3.9% (42)Virginia:
5.3% (57,498)
Cuba Staunton:
3.6% (39)Virginia:
0.5% (5,899)
China, excluding Hong Kong and Taiwan Staunton:
3.3% (36)Virginia:
3.9% (42,989)
England Staunton:
3.2% (35)Virginia:
0.9% (9,842)
Thailand Staunton:
2.6% (28)Virginia:
0.7% (7,672)
India Staunton:
2.3% (25)Virginia:
9.0% (97,830)
Zimbabwe Staunton:
2.2% (24)Virginia:
0.1% (846)
Ecuador Staunton:
2.1% (23)Virginia:
0.4% (4,715)
Philippines Staunton:
2.0% (22)Virginia:
4.8% (52,629)
Dominican Republic Staunton:
2.0% (22)Virginia:
0.6% (6,698)
Venezuela Staunton:
1.7% (19)Virginia:
0.8% (8,186)
Colombia Staunton:
1.7% (18)Virginia:
1.3% (14,435)
United Kingdom, excluding England and Scotland Staunton:
1.6% (17)Virginia:
0.8% (8,513)
Place of birth for U.S.-born residents:
This state: 15,188Other state: 9,193Northeast: 1,917Midwest: 2,100South: 4,509West: 800 82.3% of Staunton residents lived in the same house 1 years ago.
Out of people who lived in different houses, 22.9% lived in this county.
Out of people who lived in different counties, 74.8% lived in Virginia.
Staunton:
82.3%State average:
86.6%
Education attainment for males 25 years and older:
No schooling: 226Nursery to 4th grade: 345th and 6th grade: 357th and 8th grade: 339th grade: 29010th grade: 17211th grade: 9212th grade, no diploma: 110High school graduate (or equivalency): 2,715Less than 1 year of college: 365Some college more than 1 year, no degree: 1,253Associate degree: 742Bachelor's degree: 1,263Master's degree: 854Professional school degree: 244Doctorate degree: 132
Education attainment for females 25 years and older:
No schooling: 59Nursery to 4th grade: 05th and 6th grade: 07th and 8th grade: 1289th grade: 8810th grade: 4111th grade: 5212th grade, no diploma: 47High school graduate (or equivalency): 2,996Less than 1 year of college: 687Some college more than 1 year, no degree: 1,372Associate degree: 660Bachelor's degree: 2,026Master's degree: 1,659Professional school degree: 105Doctorate degree: 345
Housing units in structures:
One, detached: 8,982One, attached: 468Two: 4443 or 4: 4945 to 9: 58010 to 19: 65720 to 49: 17850 or more: 605Mobile homes: 53Housing units lacking complete plumbing facilities in 2022: 0.5%Housing units lacking complete kitchen facilities in 2022: 2.2%House/condo owner moved in on average 12 years ago
Renter moved in on average 1 years ago
Private vs. public school enrollment:
Students in private schools in grades 1 to 8 (elementary and middle school): 469 Students in private schools in grades 9 to 12 (high school): 156 Students in private undergraduate colleges: 522