Stamford, CT (Connecticut) Houses and Residents
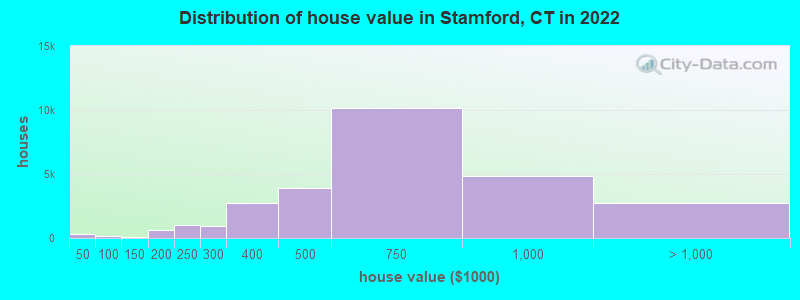
Estimated median house or condo value in 2022: $555,700 (it was $306,700 in 2000 )
Stamford:
$555,700Connecticut:
$347,200
Lower value quartile - upper value quartile: $374,100 - $758,100Mean price in 2022: Detached houses: $866,629 Here:
$866,629State:
$503,946
Townhouses or other attached units: $558,504 Here:
$558,504State:
$304,959
In 2-unit structures: $510,111 Here:
$510,111State:
$304,133
In 3-to-4-unit structures: $478,778 Here:
$478,778State:
$272,970
In 5-or-more-unit structures: $314,788 Here:
$314,788State:
$249,308
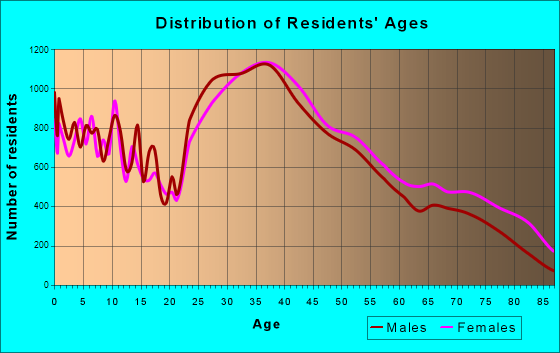
Total population: 128,278 (Urban population: 116,404, Rural population: 679 (all nonfarm) )
Houses: 61,802 (59,138 occupied: 28,851 owner occupied, 30,287 renter occupied )
% of renters here:
51%State:
34%
Housing density: 1,637 houses/condos per square mile
Median price asked for vacant for-sale houses and condos in 2022: $722,055.
Median contract rent in 2022: $1,910 (lower quartile is $1,312, upper quartile is over $2,000)
Median rent asked for vacant for-rent units in 2022: $1,780
Median gross rent in Stamford, CT in 2022: $2,000
Housing units in Stamford with a mortgage: 20,273 (2,112 second mortgage, 328 home equity loan, 1,513 both second mortgage and home equity loan )Houses without a mortgage: 455
Median household income for houses/condos with a mortgage: $153,139
Median household income for apartments without a mortgage: $94,323
Median monthly housing costs: $2,195
Data:
Median house or condo value ($)
Median house or condo value ($ change since 2000)
Median house or condo value ($) - White
Median house or condo value ($) - Black or African American
Median house or condo value ($) - Asian
Median house or condo value ($) - Hispanic or Latino
Median house or condo value ($) - American Indian and Alaska Native
Median house or condo value ($) - Multirace
Median house or condo value ($) - Other Race
Median price asked for mobile homes ($)
Household density (households per square mile)
Mean house or condo value by units in structure - 1, detached ($)
Mean house or condo value by units in structure - 1, attached ($)
Mean house or condo value by units in structure - 2 ($)
Mean house or condo value by units in structure by units in structure - 3 or 4 ($)
Mean house or condo value by units in structure - 5 or more ($)
Mean house or condo value by units in structure - Boat, RV, van, etc. ($)
Mean house or condo value by units in structure - Mobile home ($)
Median contract rent ($)
Median contract rent - Lower quartile ($)
Median contract rent - Upper quartile ($)
Median gross rent ($)
Urban houses (%)
Rural houses (%)
Houses occupied (%)
Houses occupied (% change since 2000)
Houses owner occupied (%)
Houses owner occupied (% change since 2000)
Houses renter occupied (%)
Houses renter occupied (% change since 2000)
Vacant housing units - For rent (%)
Vacant housing units - For rent (% change since 2000)
Vacant housing units - For sale only (%)
Vacant housing units - For sale only (% change since 2000)
Vacant housing units - Rented or sold, not occupied (%)
Vacant housing units - Rented or sold, not occupied (% change since 2000)
Vacant housing units - For seasonal, recreational, or occasional use (%)
Vacant housing units - For seasonal, recreational, or occasional use (% change since 2000)
Vacant housing units - For migrant workers (%)
Vacant housing units - For migrant workers (% change since 2000)
Vacant housing units - Other vacant (%)
Vacant housing units - Other vacant (% change since 2000)
Median monthly housing costs ($)
Median household income for houses/condos with a mortgage ($)
Median household income for houses/condos without a mortgage ($)
Median household income ($)
Median household income ($) - White
Median household income ($) - Black or African American
Median household income ($) - Asian
Median household income ($) - Hispanic or Latino
Median household income ($) - American Indian and Alaska Native
Median household income ($) - Multirace
Median household income ($) - Other Race
Mortgage status - with mortgage (%)
Mortgage status - with second mortgage (%)
Mortgage status - with home equity loan (%)
Mortgage status - with both second mortgage and home equity loan (%)
Mortgage status - without a mortgage (%)
Median year house/condo built
Median year apartment built
Household type by relationship - Male householder living alone (%)
Household type by relationship - Male householder not living alone (%)
Household type by relationship - Female householder living alone (%)
Household type by relationship - Female householder not living alone (%)
Household type by relationship - Opposite-Sex spouse (%)
Household type by relationship - Same-Sex spouse (%)
Household type by relationship - Opposite-Sex unmarried partner (%)
Household type by relationship - Same-Sex unmarried partner (%)
Household type by relationship - In group quarters (%)
Size of family households - 2-person household (%)
Size of family households - 3-person household (%)
Size of family households - 4-person household (%)
Size of family households - 5-person household (%)
Size of family households - 6-person household (%)
Size of family households - 7-or-more-person household (%)
Size of nonfamily households - 1-person household (%)
Size of nonfamily households - 2-person household (%)
Size of nonfamily households - 3-person household (%)
Size of nonfamily households - 4-person household (%)
Size of nonfamily households - 5-person household (%)
Size of nonfamily households - 6-person household (%)
Size of nonfamily households - 7-or-moreperson household (%)
Year house built - Built 2010 or later (%)
Year house built - Built 2000 to 2009 (%)
Year house built - Built 1990 to 1999 (%)
Year house built - Built 1980 to 1989 (%)
Year house built - Built 1970 to 1979 (%)
Year house built - Built 1960 to 1969 (%)
Year house built - Built 1950 to 1959 (%)
Year house built - Built 1940 to 1949 (%)
Year house built - Built 1939 or earlier (%)
Median number of rooms in houses and condos
Median number of rooms in apartments
Median number of bedrooms in owner occupied houses
Mean number of bedrooms in owner occupied houses
Median number of bedrooms in renter occupied houses
Mean number of bedrooms in renter occupied houses
Median number of vehichles in owner occupied houses
Mean number of vehichles in owner occupied houses
Median number of vehichles in renter occupied houses
Mean number of vehichles in renter occupied houses
Rooms in owner-occupied houses - 1 room (%)
Rooms in owner-occupied houses - 2 rooms (%)
Rooms in owner-occupied houses - 3 rooms (%)
Rooms in owner-occupied houses - 4 rooms (%)
Rooms in owner-occupied houses - 5 rooms (%)
Rooms in owner-occupied houses - 6 rooms (%)
Rooms in owner-occupied houses - 7 rooms (%)
Rooms in owner-occupied houses - 8 rooms (%)
Rooms in owner-occupied houses - 9+ rooms (%)
Rooms in renter-occupied houses - 1 room (%)
Rooms in renter-occupied houses - 2 rooms (%)
Rooms in renter-occupied houses - 3 rooms (%)
Rooms in renter-occupied houses - 4 rooms (%)
Rooms in renter-occupied houses - 5 rooms (%)
Rooms in renter-occupied houses - 6 rooms (%)
Rooms in renter-occupied houses - 7 rooms (%)
Rooms in renter-occupied houses - 8 rooms (%)
Rooms in renter-occupied houses - 9+ rooms (%)
Bedrooms in owner-occupied houses - no bedrooms (%)
Bedrooms in owner-occupied houses - 1 bedroom (%)
Bedrooms in owner-occupied houses - 2 bedrooms (%)
Bedrooms in owner-occupied houses - 3 bedrooms (%)
Bedrooms in owner-occupied houses - 4 bedrooms (%)
Bedrooms in owner-occupied houses - 5+ bedrooms (%)
Bedrooms in renter-occupied houses - no bedrooms (%)
Bedrooms in renter-occupied houses - 1 bedroom (%)
Bedrooms in renter-occupied houses - 2 bedrooms (%)
Bedrooms in renter-occupied houses - 3 bedrooms (%)
Bedrooms in renter-occupied houses - 4 bedrooms (%)
Bedrooms in renter-occupied houses - 5+ bedrooms (%)
Vehicles available in owner-occupied houses - no vehicle available (%)
Vehicles available in owner-occupied houses - 1 vehicle available(%)
Vehicles available in owner-occupied houses - 2 Vehicles available (%)
Vehicles available in owner-occupied houses - 3 Vehicles available (%)
Vehicles available in owner-occupied houses - 4 Vehicles available (%)
Vehicles available in owner-occupied houses - 5+ Vehicles available (%)
Vehicles available in renter-occupied houses - no vehicle available (%)
Vehicles available in renter-occupied houses - 1 vehicle available (%)
Vehicles available in renter-occupied houses - 2 Vehicles available (%)
Vehicles available in renter-occupied houses - 3 Vehicles available (%)
Vehicles available in renter-occupied houses - 4 Vehicles available (%)
Vehicles available in renter-occupied houses - 5+ Vehicles available (%)
Housing units in structures - 1, detached (%)
Housing units in structures - 1, attached (%)
Housing units in structures - 2 (%)
Housing units in structures - 3 or 4 (%)
Housing units in structures - 5 to 9 (%)
Housing units in structures - 10 to 19 (%)
Housing units in structures - 20 to 49 (%)
Housing units in structures - 50 or more (%)
Housing units in structures - Mobile home (%)
Housing units in structures - Boat, RV, van, etc. (%)
Housing units in structures - Owners - 1, detached (%)
Housing units in structures - Owners - 1, attached (%)
Housing units in structures - Owners - 2 (%)
Housing units in structures - Owners - 3 or 4 (%)
Housing units in structures - Owners - 5 to 9 (%)
Housing units in structures - Owners - 10 to 19 (%)
Housing units in structures - Owners - 20 to 49 (%)
Housing units in structures - Owners - 50 or more (%)
Housing units in structures - Owners - Mobile home (%)
Housing units in structures - Owners - Boat, RV, van, etc. (%)
Housing units in structures - Renters - 1, detached (%)
Housing units in structures - Renters - 1, attached (%)
Housing units in structures - Renters - 2 (%)
Housing units in structures - Renters - 3 or 4 (%)
Housing units in structures - Renters - 5 to 9 (%)
Housing units in structures - Renters - 10 to 19 (%)
Housing units in structures - Renters - 20 to 49 (%)
Housing units in structures - Renters - 50 or more (%)
Housing units in structures - Renters - Mobile home (%)
Housing units in structures - Renters - Boat, RV, van, etc. (%)
House/condo owner moved in on average (years ago)
Renter moved in on average (years ago)
Year householder moved into unit - Moved in 1999 to March 2000 (%)
Year householder moved into unit - Moved in 1999 to March 2000 (%) - White
Year householder moved into unit - Moved in 1999 to March 2000 (%) - Black or African American
Year householder moved into unit - Moved in 1999 to March 2000 (%) - Asian
Year householder moved into unit - Moved in 1999 to March 2000 (%) - Hispanic or Latino
Year householder moved into unit - Moved in 1999 to March 2000 (%) - American Indian and Alaska Native
Year householder moved into unit - Moved in 1999 to March 2000 (%) - Multirace
Year householder moved into unit - Moved in 1999 to March 2000 (%) - Other Race
Year householder moved into unit - Moved in 1995 to 1998 (%)
Year householder moved into unit - Moved in 1995 to 1998 (%) - White
Year householder moved into unit - Moved in 1995 to 1998 (%) - Black or African American
Year householder moved into unit - Moved in 1995 to 1998 (%) - Asian
Year householder moved into unit - Moved in 1995 to 1998 (%) - Hispanic or Latino
Year householder moved into unit - Moved in 1995 to 1998 (%) - American Indian and Alaska Native
Year householder moved into unit - Moved in 1995 to 1998 (%) - Multirace
Year householder moved into unit - Moved in 1995 to 1998 (%) - Other Race
Year householder moved into unit - Moved in 1990 to 1994 (%)
Year householder moved into unit - Moved in 1990 to 1994 (%) - White
Year householder moved into unit - Moved in 1990 to 1994 (%) - Black or African American
Year householder moved into unit - Moved in 1990 to 1994 (%) - Asian
Year householder moved into unit - Moved in 1990 to 1994 (%) - Hispanic or Latino
Year householder moved into unit - Moved in 1990 to 1994 (%) - American Indian and Alaska Native
Year householder moved into unit - Moved in 1990 to 1994 (%) - Multirace
Year householder moved into unit - Moved in 1990 to 1994 (%) - Other Race
Year householder moved into unit - Moved in 1980 to 1989 (%)
Year householder moved into unit - Moved in 1980 to 1989 (%) - White
Year householder moved into unit - Moved in 1980 to 1989 (%) - Black or African American
Year householder moved into unit - Moved in 1980 to 1989 (%) - Asian
Year householder moved into unit - Moved in 1980 to 1989 (%) - Hispanic or Latino
Year householder moved into unit - Moved in 1980 to 1989 (%) - American Indian and Alaska Native
Year householder moved into unit - Moved in 1980 to 1989 (%) - Multirace
Year householder moved into unit - Moved in 1980 to 1989 (%) - Other Race
Year householder moved into unit - Moved in 1970 to 1979 (%)
Year householder moved into unit - Moved in 1970 to 1979 (%) - White
Year householder moved into unit - Moved in 1970 to 1979 (%) - Black or African American
Year householder moved into unit - Moved in 1970 to 1979 (%) - Asian
Year householder moved into unit - Moved in 1970 to 1979 (%) - Hispanic or Latino
Year householder moved into unit - Moved in 1970 to 1979 (%) - American Indian and Alaska Native
Year householder moved into unit - Moved in 1970 to 1979 (%) - Multirace
Year householder moved into unit - Moved in 1970 to 1979 (%) - Other Race
Year householder moved into unit - Moved in 1969 or earlier (%)
Year householder moved into unit - Moved in 1969 or earlier (%) - White
Year householder moved into unit - Moved in 1969 or earlier (%) - Black or African American
Year householder moved into unit - Moved in 1969 or earlier (%) - Asian
Year householder moved into unit - Moved in 1969 or earlier (%) - Hispanic or Latino
Year householder moved into unit - Moved in 1969 or earlier (%) - American Indian and Alaska Native
Year householder moved into unit - Moved in 1969 or earlier (%) - Multirace
Year householder moved into unit - Moved in 1969 or earlier (%) - Other Race
Housing units lacking complete plumbing facilities (%)
Housing units lacking complete kitchen facilities (%)
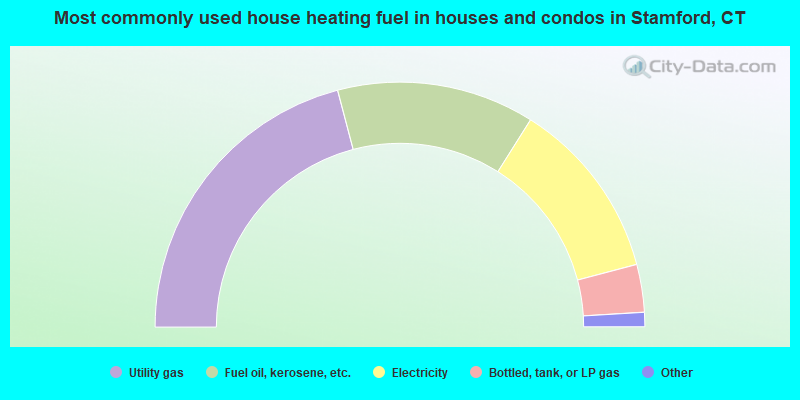
House heating fuel used in houses and condos - Utility gas (%)
House heating fuel used in houses and condos - Bottled, tank, or LP gas (%)
House heating fuel used in houses and condos - Electricity (%)
House heating fuel used in houses and condos - Fuel oil, kerosene, etc. (%)
House heating fuel used in houses and condos - Coal or coke (%)
House heating fuel used in houses and condos - Wood (%)
House heating fuel used in houses and condos - Solar energy (%)
House heating fuel used in houses and condos - Other fuel (%)
House heating fuel used in houses and condos - No fuel used (%)
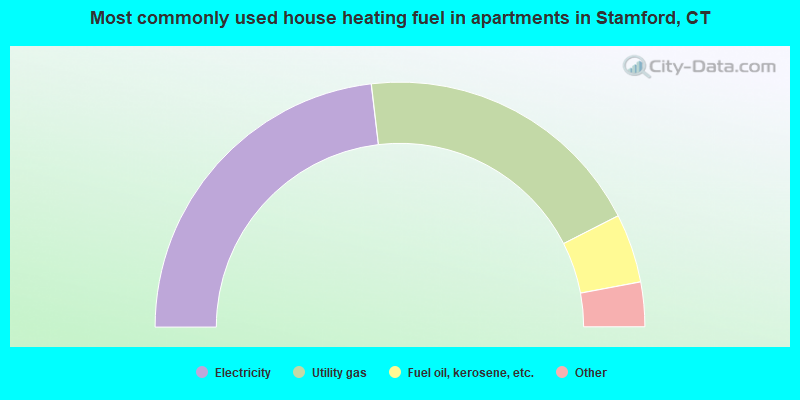
House heating fuel used in apartments - Utility gas (%)
House heating fuel used in apartments - Bottled, tank, or LP gas (%)
House heating fuel used in apartments - Electricity (%)
House heating fuel used in apartments - Fuel oil, kerosene, etc. (%)
House heating fuel used in apartments - Coal or coke (%)
House heating fuel used in apartments - Wood (%)
House heating fuel used in apartments - Solar energy (%)
House heating fuel used in apartments - Other fuel (%)
House heating fuel used in apartments - No fuel used (%)
Latest news about housing in Stamford, CT collected exclusively by city-data.com from local newspapers, TV, and radio stations
Median year house/condo built: 1963Median year apartment built: 1988Household type by relationship:
Households: 136,197
Male householders: 28,399 (9,676 living alone ), Female householders: 30,739 (13,251 living alone )22,043 spouses (21,923 opposite-sex spouses ), 3,636 unmarried partners , (3,202 opposite-sex unmarried partners ), 32,791 children (30,799 natural , 688 adopted , 1,304 stepchildren ), 1,604 grandchildren , 2,332 brothers or sisters , 2,839 parents , 0 foster children , 2,836 other relatives , 6,836 non-relatives In group quarters: 2,142
Size of family households: 12,185 2-persons , 10,572 3-persons , 4,927 4-persons , 2,600 5-persons , 1,066 6-persons , 454 7-or-more-persons .
Size of nonfamily households: 22,927 1-person , 3,288 2-persons , 644 3-persons , 176 4-persons , 104 6-persons , 195 7-or-more-persons .
12,545 married couples with children. single-parent households (1,727 men , 4,161 women ).
57.3% of residents of Stamford speak English at home. of residents speak Spanish at home (48% speak English very well , 21% speak English well , 21% speak English not well , 11% don't speak English at all ).of residents speak other Indo-European language at home (67% speak English very well , 22% speak English well , 10% speak English not well , 2% don't speak English at all ).of residents speak Asian or Pacific Island language at home (59% speak English very well , 27% speak English well , 12% speak English not well , 1% don't speak English at all ).of residents speak other language at home (76% speak English very well , 6% speak English well , 18% speak English not well ).
Foreign born population: 45,714 (33.6%)of them are naturalized citizens )
Median number of rooms in houses and condos:
Median number of rooms in apartments
Owner-occupied Renter-occupied
Bedrooms in owner-occupied houses and condos in Stamford, Connecticut
236 no bedroom 1,411 1 bedroom 9,366 2 bedrooms 8,839 3 bedrooms 6,595 4 bedrooms 2,404 5+ bedrooms
Bedrooms in renter-occupied apartments in Stamford, Connecticut
3,688 no bedroom 12,533 1 bedroom 9,028 2 bedrooms 3,583 3 bedrooms 1,275 4 bedrooms 180 5+ bedrooms
Owner-occupied Renter-occupied
Rooms in owner-occupied houses in Stamford, Connecticut
168 1 room 111 2 rooms 2,435 3 rooms 4,951 4 rooms 4,197 5 rooms 3,746 6 rooms 3,766 7 rooms 3,892 8 rooms 5,585 9+ rooms
Rooms in renter-occupied apartments in Stamford, Connecticut
3,451 1 room 4,926 2 rooms 9,639 3 rooms 5,443 4 rooms 3,232 5 rooms 1,744 6 rooms 1,341 7 rooms 243 8 rooms 268 9+ rooms
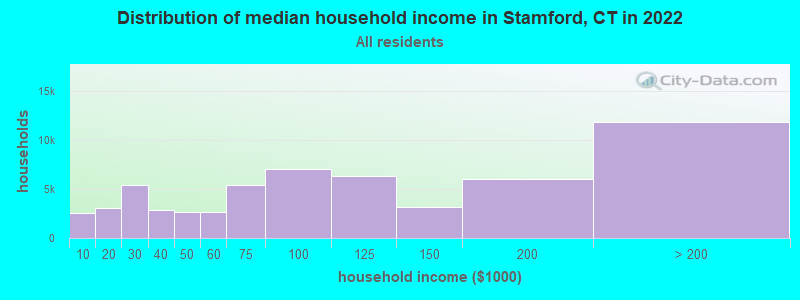
Stamford, CT household income distribution 2,576 Less than $10,0003,031 $10,000 to $19,9995,468 $20,000 to $29,9992,844 $30,000 to $39,9992,689 $40,000 to $49,9992,663 $50,000 to $59,9995,436 $60,000 to $74,9997,022 $75,000 to $99,9996,335 $100,000 to $124,9993,166 $125,000 to $149,9996,048 $150,000 to $199,99911,860 $200,000 or more
Home value of owner - occupied houses in 2022 in Stamford, CT 146 Less than $10,00027 $10,000 to $14,99930 $15,000 to $19,99939 $20,000 to $24,99911 $25,000 to $29,99935 $40,000 to $49,99949 $50,000 to $59,99914 $60,000 to $69,99917 $70,000 to $79,99916 $80,000 to $89,99929 $90,000 to $99,99926 $100,000 to $124,99941 $125,000 to $149,999286 $150,000 to $174,999362 $175,000 to $199,999978 $200,000 to $249,999915 $250,000 to $299,9992,730 $300,000 to $399,9993,893 $400,000 to $499,99910,177 $500,000 to $749,9994,878 $750,000 to $999,9991,685 $1,000,000 to $1,499,999485 $1,500,000 to $1,999,999546 $2,000,000 or moreRent paid by renters in 2022 in Stamford, CT 55 Less than $10024 $100 to $149276 $150 to $19969 $200 to $249205 $250 to $299342 $300 to $349416 $350 to $399364 $400 to $44971 $450 to $499495 $500 to $549563 $550 to $599202 $600 to $64982 $650 to $699339 $700 to $749124 $750 to $799316 $800 to $899441 $900 to $9992,151 $1,000 to $1,2492,226 $1,250 to $1,4996,492 $1,500 to $1,9995,990 $2,000 to $2,4993,580 $2,500 to $2,9991,454 $3,000 to $3,4992,184 $3,500 or more783 No cash rent
Percentage of workers working in this county: 78.1%Number of people working at home: 18,759 (23.9% of all workers )
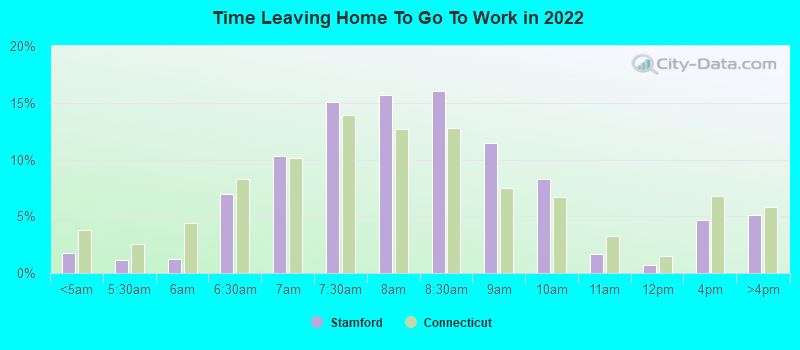
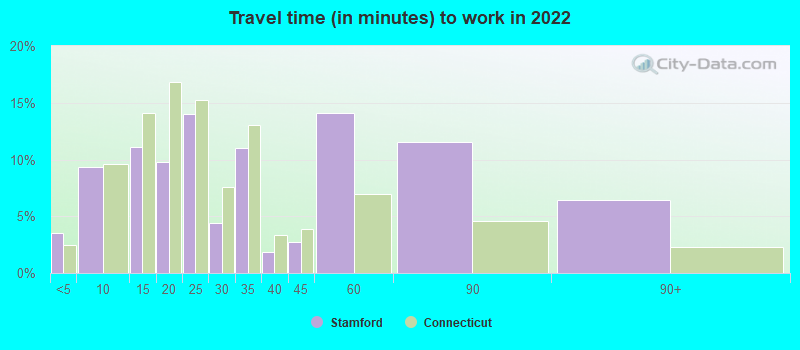
Travel time to work (commute)
Less than 5 minutes: 1,6845 to 9 minutes: 6,56310 to 14 minutes: 6,66615 to 19 minutes: 8,53520 to 24 minutes: 10,00325 to 29 minutes: 3,46530 to 34 minutes: 7,17035 to 39 minutes: 1,51440 to 44 minutes: 2,40645 to 59 minutes: 4,14360 to 89 minutes: 4,97990 or more minutes: 2,573
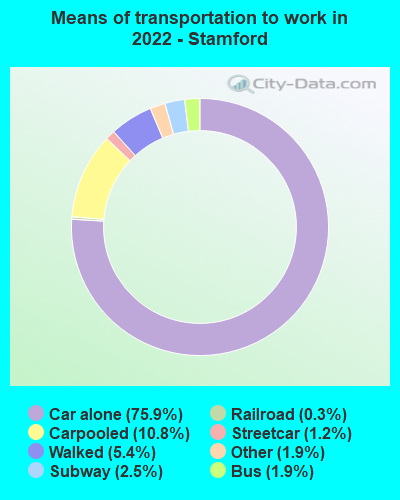
Means of transportation to work:
Drove a car alone: 48,929 (58.8%)Carpooled: 6,996 (8.4%)Bus : 1,251 (1.5%)Subway or elevated rail : 804 (1.0%)Long-distance train or commuter rail : 1,631 (2.0%)Light rail, streetcar or trolley : 191 (0.2%)Taxi: 1,194 (1.4%)Bicycle: 53 (0.1%)Walked: 3,458 (4.2%)Worked at home: 18,759 (22.5%)
Unemployment by race in 2022
Unemployment rate for White non-Hispanic residents 4.2% Males3.9% FemalesUnemployment rate for Black residents 2.7% Males9.3% FemalesUnemployment rate for American Indian and Alaska Native residents 14.0% FemalesUnemployment rate for Asian residents 2.3% Males11.3% FemalesUnemployment rate for other race residents 6.4% Males9.6% FemalesUnemployment rate for two or more race residents 2.7% Males1.0% FemalesUnemployment rate for Hispanic or Latino residents 0.9% Males3.2% Females
Year of entry for the foreign-born population in Stamford, Connecticut
15,079 2010 or later 10,067 2000 to 2009 9,951 1990 to 1999 9,003 1980 to 1989 3,516 1970 to 1979 5,147 Before 1970
First ancestries reported:
Italian: 6,876 (9.0%)
Haitian: 3,972 (5.2%)
American: 3,063 (4.0%)
Irish: 2,500 (3.3%)
Jamaican: 2,341 (3.1%)
Polish: 1,913 (2.5%)
English: 1,692 (2.2%)
German: 1,149 (1.5%)
Ukrainian: 1,125 (1.5%)
Ghanaian: 1,084 (1.4%)
European: 948 (1.2%)
Russian: 943 (1.2%)
Eastern European: 802 (1.1%)
Greek: 610 (0.8%)
Bulgarian: 536 (0.7%)
Nigerian: 482 (0.6%)
Brazilian: 410 (0.5%)
British: 361 (0.5%)
Albanian: 316 (0.4%)
French: 315 (0.4%)
South African: 269 (0.4%)
Scottish: 266 (0.3%)
African: 186 (0.2%)
Trinidadian and Tobagonian: 181 (0.2%)
Portuguese: 157 (0.2%)
Hungarian: 132 (0.2%)
Austrian: 130 (0.2%)
Latvian: 126 (0.2%)
French Canadian: 125 (0.2%)
Swedish: 117 (0.2%)
West Indian: 105 (0.1%)
Cape Verdean: 91 (0.1%)
Romanian: 91 (0.1%)
Dutch: 84 (0.1%)
Scotch-Irish: 83 (0.1%)
Norwegian: 82 (0.1%)
Guyanese: 80 (0.1%)
Armenian: 79 (0.1%)
Canadian: 78 (0.1%)
Moroccan: 78 (0.1%)
Arab: 72 (0.09%)
Iranian: 58 (0.08%)
Danish: 56 (0.07%)
Ugandan: 46 (0.06%)
Barbadian: 46 (0.06%)
Serbian: 46 (0.06%)
Northern European: 43 (0.06%)
Lithuanian: 42 (0.06%)
Turkish: 40 (0.05%)
Slovak: 39 (0.05%)
Palestinian: 38 (0.05%)
Lebanese: 31 (0.04%)
Scandinavian: 26 (0.03%)
Israeli: 26 (0.03%)
Finnish: 25 (0.03%)
Czech: 22 (0.03%)
Egyptian: 18 (0.02%)
Iraqi: 14 (0.02%)
Swiss: 12 (0.02%)
Syrian: 11 (0.01%)
Maltese: 10 (0.01%)
Belizean: 10 (0.01%)
Welsh: 9 (0.01%)
Belgian: 8 (0.01%)
Pennsylvania German: 6 (0.01%)
Croatian: 5 (0.01%)
Slovene: 5 (0.01%)
Most common places of birth for foreign-born residents (%): Guatemala Stamford:
18.5% (8,519)Connecticut:
3.2% (17,617)
Haiti Stamford:
7.9% (3,658)Connecticut:
2.4% (12,881)
Colombia Stamford:
6.4% (2,933)Connecticut:
3.3% (18,124)
Ecuador Stamford:
6.2% (2,844)Connecticut:
4.4% (24,026)
India Stamford:
5.7% (2,613)Connecticut:
7.3% (39,879)
China, excluding Hong Kong and Taiwan Stamford:
4.6% (2,142)Connecticut:
4.4% (24,001)
Dominican Republic Stamford:
4.6% (2,123)Connecticut:
5.0% (27,361)
Jamaica Stamford:
4.0% (1,828)Connecticut:
7.5% (40,568)
Peru Stamford:
3.6% (1,681)Connecticut:
2.5% (13,591)
Honduras Stamford:
2.9% (1,328)Connecticut:
1.3% (7,220)
Mexico Stamford:
2.8% (1,272)Connecticut:
4.8% (25,802)
Italy Stamford:
2.4% (1,106)Connecticut:
2.8% (15,141)
Ukraine Stamford:
2.2% (1,008)Connecticut:
0.9% (5,088)
Ghana Stamford:
2.0% (936)Connecticut:
1.0% (5,651)
Poland Stamford:
1.8% (838)Connecticut:
4.0% (21,729)
Place of birth for U.S.-born residents:
This state: 40,602Other state: 46,410Northeast: 34,770Midwest: 3,092South: 6,306West: 2,242 83.6% of Stamford residents lived in the same house 1 years ago.
Out of people who lived in different houses, 36.6% lived in this county.
Out of people who lived in different counties, 23.3% lived in Connecticut.
Stamford:
83.6%State average:
88.4%
Education attainment for males 25 years and older:
No schooling: 2,154Nursery to 4th grade: 4845th and 6th grade: 6167th and 8th grade: 3399th grade: 58810th grade: 79711th grade: 15612th grade, no diploma: 1,354High school graduate (or equivalency): 8,010Less than 1 year of college: 2,539Some college more than 1 year, no degree: 4,418Associate degree: 1,810Bachelor's degree: 13,724Master's degree: 6,606Professional school degree: 2,545Doctorate degree: 655
Education attainment for females 25 years and older:
No schooling: 1,687Nursery to 4th grade: 1455th and 6th grade: 8337th and 8th grade: 5219th grade: 57410th grade: 19711th grade: 24312th grade, no diploma: 943High school graduate (or equivalency): 8,199Less than 1 year of college: 2,602Some college more than 1 year, no degree: 4,616Associate degree: 3,101Bachelor's degree: 16,402Master's degree: 8,113Professional school degree: 2,093Doctorate degree: 1,057
Housing units in structures:
One, detached: 19,910One, attached: 4,380Two: 4,3333 or 4: 5,0845 to 9: 1,85010 to 19: 3,04220 to 49: 5,07050 or more: 17,909Mobile homes: 224Housing units lacking complete plumbing facilities in 2022: 0.7%Housing units lacking complete kitchen facilities in 2022: 0.5%House/condo owner moved in on average 12 years ago
Renter moved in on average 2 years ago
Private vs. public school enrollment:
Students in private schools in grades 1 to 8 (elementary and middle school): 2,880 Here:
31.8%Connecticut:
9.5%
Students in private schools in grades 9 to 12 (high school): 1,417 Here:
30.1%Connecticut:
12.9%
Students in private undergraduate colleges: 1,654 Here:
22.0%Connecticut:
35.5%