St. Peters, MO (Missouri) Houses and Residents
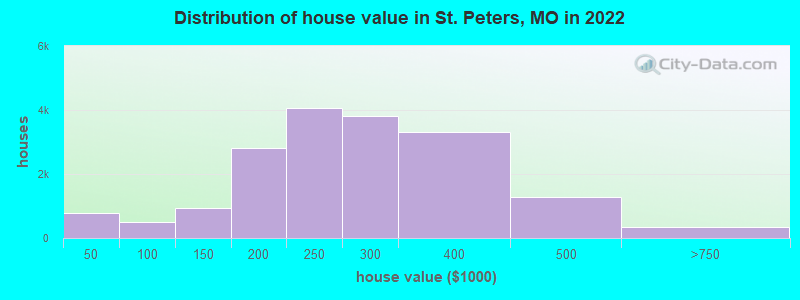
Estimated median house or condo value in 2022: $256,269 (it was $113,000 in 2000 )
St. Peters:
$256,269Missouri:
$221,200
Lower value quartile - upper value quartile: $198,080 - $316,371Mean price in 2022: Detached houses: $291,281 Here:
$291,281State:
$278,068
Townhouses or other attached units: $204,989 Here:
$204,989State:
$260,773
In 2-unit structures: $335,943 Here:
$335,943State:
$172,667
In 3-to-4-unit structures: $156,347 Here:
$156,347State:
$181,162
In 5-or-more-unit structures: $100,766 Here:
$100,766State:
$263,082
Mobile homes: $31,187 Here:
$31,187State:
$95,912
Total population: 56,076 (Urban population: 51,202, Rural population: 130 (32 farm, 98 nonfarm ))
Houses: 25,365 (24,482 occupied: 20,002 owner occupied, 4,709 renter occupied )
% of renters here:
19%State:
32%
Housing density: 1,197 houses/condos per square mile
Median price asked for vacant for-sale houses and condos in 2022: $92,103.
Median contract rent in 2022: $1,092 (lower quartile is $787, upper quartile is $1,311)
Median rent asked for vacant for-rent units in 2022: $1,386
Median gross rent in St. Peters, MO in 2022: $1,186
Housing units in St. Peters with a mortgage: 13,541 (1,224 second mortgage, 2 home equity loan, 1,140 both second mortgage and home equity loan )Houses without a mortgage: 215
Median household income for houses/condos with a mortgage: $106,307
Median household income for apartments without a mortgage: $70,615
Median monthly housing costs: $1,251
Data:
Median house or condo value ($)
Median house or condo value ($ change since 2000)
Median house or condo value ($) - White
Median house or condo value ($) - Black or African American
Median house or condo value ($) - Asian
Median house or condo value ($) - Hispanic or Latino
Median house or condo value ($) - American Indian and Alaska Native
Median house or condo value ($) - Multirace
Median house or condo value ($) - Other Race
Median price asked for mobile homes ($)
Household density (households per square mile)
Mean house or condo value by units in structure - 1, detached ($)
Mean house or condo value by units in structure - 1, attached ($)
Mean house or condo value by units in structure - 2 ($)
Mean house or condo value by units in structure by units in structure - 3 or 4 ($)
Mean house or condo value by units in structure - 5 or more ($)
Mean house or condo value by units in structure - Boat, RV, van, etc. ($)
Mean house or condo value by units in structure - Mobile home ($)
Median contract rent ($)
Median contract rent - Lower quartile ($)
Median contract rent - Upper quartile ($)
Median gross rent ($)
Urban houses (%)
Rural houses (%)
Houses occupied (%)
Houses occupied (% change since 2000)
Houses owner occupied (%)
Houses owner occupied (% change since 2000)
Houses renter occupied (%)
Houses renter occupied (% change since 2000)
Vacant housing units - For rent (%)
Vacant housing units - For rent (% change since 2000)
Vacant housing units - For sale only (%)
Vacant housing units - For sale only (% change since 2000)
Vacant housing units - Rented or sold, not occupied (%)
Vacant housing units - Rented or sold, not occupied (% change since 2000)
Vacant housing units - For seasonal, recreational, or occasional use (%)
Vacant housing units - For seasonal, recreational, or occasional use (% change since 2000)
Vacant housing units - For migrant workers (%)
Vacant housing units - For migrant workers (% change since 2000)
Vacant housing units - Other vacant (%)
Vacant housing units - Other vacant (% change since 2000)
Median monthly housing costs ($)
Median household income for houses/condos with a mortgage ($)
Median household income for houses/condos without a mortgage ($)
Median household income ($)
Median household income ($) - White
Median household income ($) - Black or African American
Median household income ($) - Asian
Median household income ($) - Hispanic or Latino
Median household income ($) - American Indian and Alaska Native
Median household income ($) - Multirace
Median household income ($) - Other Race
Mortgage status - with mortgage (%)
Mortgage status - with second mortgage (%)
Mortgage status - with home equity loan (%)
Mortgage status - with both second mortgage and home equity loan (%)
Mortgage status - without a mortgage (%)
Median year house/condo built
Median year apartment built
Household type by relationship - Male householder living alone (%)
Household type by relationship - Male householder not living alone (%)
Household type by relationship - Female householder living alone (%)
Household type by relationship - Female householder not living alone (%)
Household type by relationship - Opposite-Sex spouse (%)
Household type by relationship - Same-Sex spouse (%)
Household type by relationship - Opposite-Sex unmarried partner (%)
Household type by relationship - Same-Sex unmarried partner (%)
Household type by relationship - In group quarters (%)
Size of family households - 2-person household (%)
Size of family households - 3-person household (%)
Size of family households - 4-person household (%)
Size of family households - 5-person household (%)
Size of family households - 6-person household (%)
Size of family households - 7-or-more-person household (%)
Size of nonfamily households - 1-person household (%)
Size of nonfamily households - 2-person household (%)
Size of nonfamily households - 3-person household (%)
Size of nonfamily households - 4-person household (%)
Size of nonfamily households - 5-person household (%)
Size of nonfamily households - 6-person household (%)
Size of nonfamily households - 7-or-moreperson household (%)
Year house built - Built 2010 or later (%)
Year house built - Built 2000 to 2009 (%)
Year house built - Built 1990 to 1999 (%)
Year house built - Built 1980 to 1989 (%)
Year house built - Built 1970 to 1979 (%)
Year house built - Built 1960 to 1969 (%)
Year house built - Built 1950 to 1959 (%)
Year house built - Built 1940 to 1949 (%)
Year house built - Built 1939 or earlier (%)
Median number of rooms in houses and condos
Median number of rooms in apartments
Median number of bedrooms in owner occupied houses
Mean number of bedrooms in owner occupied houses
Median number of bedrooms in renter occupied houses
Mean number of bedrooms in renter occupied houses
Median number of vehichles in owner occupied houses
Mean number of vehichles in owner occupied houses
Median number of vehichles in renter occupied houses
Mean number of vehichles in renter occupied houses
Rooms in owner-occupied houses - 1 room (%)
Rooms in owner-occupied houses - 2 rooms (%)
Rooms in owner-occupied houses - 3 rooms (%)
Rooms in owner-occupied houses - 4 rooms (%)
Rooms in owner-occupied houses - 5 rooms (%)
Rooms in owner-occupied houses - 6 rooms (%)
Rooms in owner-occupied houses - 7 rooms (%)
Rooms in owner-occupied houses - 8 rooms (%)
Rooms in owner-occupied houses - 9+ rooms (%)
Rooms in renter-occupied houses - 1 room (%)
Rooms in renter-occupied houses - 2 rooms (%)
Rooms in renter-occupied houses - 3 rooms (%)
Rooms in renter-occupied houses - 4 rooms (%)
Rooms in renter-occupied houses - 5 rooms (%)
Rooms in renter-occupied houses - 6 rooms (%)
Rooms in renter-occupied houses - 7 rooms (%)
Rooms in renter-occupied houses - 8 rooms (%)
Rooms in renter-occupied houses - 9+ rooms (%)
Bedrooms in owner-occupied houses - no bedrooms (%)
Bedrooms in owner-occupied houses - 1 bedroom (%)
Bedrooms in owner-occupied houses - 2 bedrooms (%)
Bedrooms in owner-occupied houses - 3 bedrooms (%)
Bedrooms in owner-occupied houses - 4 bedrooms (%)
Bedrooms in owner-occupied houses - 5+ bedrooms (%)
Bedrooms in renter-occupied houses - no bedrooms (%)
Bedrooms in renter-occupied houses - 1 bedroom (%)
Bedrooms in renter-occupied houses - 2 bedrooms (%)
Bedrooms in renter-occupied houses - 3 bedrooms (%)
Bedrooms in renter-occupied houses - 4 bedrooms (%)
Bedrooms in renter-occupied houses - 5+ bedrooms (%)
Vehicles available in owner-occupied houses - no vehicle available (%)
Vehicles available in owner-occupied houses - 1 vehicle available(%)
Vehicles available in owner-occupied houses - 2 Vehicles available (%)
Vehicles available in owner-occupied houses - 3 Vehicles available (%)
Vehicles available in owner-occupied houses - 4 Vehicles available (%)
Vehicles available in owner-occupied houses - 5+ Vehicles available (%)
Vehicles available in renter-occupied houses - no vehicle available (%)
Vehicles available in renter-occupied houses - 1 vehicle available (%)
Vehicles available in renter-occupied houses - 2 Vehicles available (%)
Vehicles available in renter-occupied houses - 3 Vehicles available (%)
Vehicles available in renter-occupied houses - 4 Vehicles available (%)
Vehicles available in renter-occupied houses - 5+ Vehicles available (%)
Housing units in structures - 1, detached (%)
Housing units in structures - 1, attached (%)
Housing units in structures - 2 (%)
Housing units in structures - 3 or 4 (%)
Housing units in structures - 5 to 9 (%)
Housing units in structures - 10 to 19 (%)
Housing units in structures - 20 to 49 (%)
Housing units in structures - 50 or more (%)
Housing units in structures - Mobile home (%)
Housing units in structures - Boat, RV, van, etc. (%)
Housing units in structures - Owners - 1, detached (%)
Housing units in structures - Owners - 1, attached (%)
Housing units in structures - Owners - 2 (%)
Housing units in structures - Owners - 3 or 4 (%)
Housing units in structures - Owners - 5 to 9 (%)
Housing units in structures - Owners - 10 to 19 (%)
Housing units in structures - Owners - 20 to 49 (%)
Housing units in structures - Owners - 50 or more (%)
Housing units in structures - Owners - Mobile home (%)
Housing units in structures - Owners - Boat, RV, van, etc. (%)
Housing units in structures - Renters - 1, detached (%)
Housing units in structures - Renters - 1, attached (%)
Housing units in structures - Renters - 2 (%)
Housing units in structures - Renters - 3 or 4 (%)
Housing units in structures - Renters - 5 to 9 (%)
Housing units in structures - Renters - 10 to 19 (%)
Housing units in structures - Renters - 20 to 49 (%)
Housing units in structures - Renters - 50 or more (%)
Housing units in structures - Renters - Mobile home (%)
Housing units in structures - Renters - Boat, RV, van, etc. (%)
House/condo owner moved in on average (years ago)
Renter moved in on average (years ago)
Year householder moved into unit - Moved in 1999 to March 2000 (%)
Year householder moved into unit - Moved in 1999 to March 2000 (%) - White
Year householder moved into unit - Moved in 1999 to March 2000 (%) - Black or African American
Year householder moved into unit - Moved in 1999 to March 2000 (%) - Asian
Year householder moved into unit - Moved in 1999 to March 2000 (%) - Hispanic or Latino
Year householder moved into unit - Moved in 1999 to March 2000 (%) - American Indian and Alaska Native
Year householder moved into unit - Moved in 1999 to March 2000 (%) - Multirace
Year householder moved into unit - Moved in 1999 to March 2000 (%) - Other Race
Year householder moved into unit - Moved in 1995 to 1998 (%)
Year householder moved into unit - Moved in 1995 to 1998 (%) - White
Year householder moved into unit - Moved in 1995 to 1998 (%) - Black or African American
Year householder moved into unit - Moved in 1995 to 1998 (%) - Asian
Year householder moved into unit - Moved in 1995 to 1998 (%) - Hispanic or Latino
Year householder moved into unit - Moved in 1995 to 1998 (%) - American Indian and Alaska Native
Year householder moved into unit - Moved in 1995 to 1998 (%) - Multirace
Year householder moved into unit - Moved in 1995 to 1998 (%) - Other Race
Year householder moved into unit - Moved in 1990 to 1994 (%)
Year householder moved into unit - Moved in 1990 to 1994 (%) - White
Year householder moved into unit - Moved in 1990 to 1994 (%) - Black or African American
Year householder moved into unit - Moved in 1990 to 1994 (%) - Asian
Year householder moved into unit - Moved in 1990 to 1994 (%) - Hispanic or Latino
Year householder moved into unit - Moved in 1990 to 1994 (%) - American Indian and Alaska Native
Year householder moved into unit - Moved in 1990 to 1994 (%) - Multirace
Year householder moved into unit - Moved in 1990 to 1994 (%) - Other Race
Year householder moved into unit - Moved in 1980 to 1989 (%)
Year householder moved into unit - Moved in 1980 to 1989 (%) - White
Year householder moved into unit - Moved in 1980 to 1989 (%) - Black or African American
Year householder moved into unit - Moved in 1980 to 1989 (%) - Asian
Year householder moved into unit - Moved in 1980 to 1989 (%) - Hispanic or Latino
Year householder moved into unit - Moved in 1980 to 1989 (%) - American Indian and Alaska Native
Year householder moved into unit - Moved in 1980 to 1989 (%) - Multirace
Year householder moved into unit - Moved in 1980 to 1989 (%) - Other Race
Year householder moved into unit - Moved in 1970 to 1979 (%)
Year householder moved into unit - Moved in 1970 to 1979 (%) - White
Year householder moved into unit - Moved in 1970 to 1979 (%) - Black or African American
Year householder moved into unit - Moved in 1970 to 1979 (%) - Asian
Year householder moved into unit - Moved in 1970 to 1979 (%) - Hispanic or Latino
Year householder moved into unit - Moved in 1970 to 1979 (%) - American Indian and Alaska Native
Year householder moved into unit - Moved in 1970 to 1979 (%) - Multirace
Year householder moved into unit - Moved in 1970 to 1979 (%) - Other Race
Year householder moved into unit - Moved in 1969 or earlier (%)
Year householder moved into unit - Moved in 1969 or earlier (%) - White
Year householder moved into unit - Moved in 1969 or earlier (%) - Black or African American
Year householder moved into unit - Moved in 1969 or earlier (%) - Asian
Year householder moved into unit - Moved in 1969 or earlier (%) - Hispanic or Latino
Year householder moved into unit - Moved in 1969 or earlier (%) - American Indian and Alaska Native
Year householder moved into unit - Moved in 1969 or earlier (%) - Multirace
Year householder moved into unit - Moved in 1969 or earlier (%) - Other Race
Housing units lacking complete plumbing facilities (%)
Housing units lacking complete kitchen facilities (%)
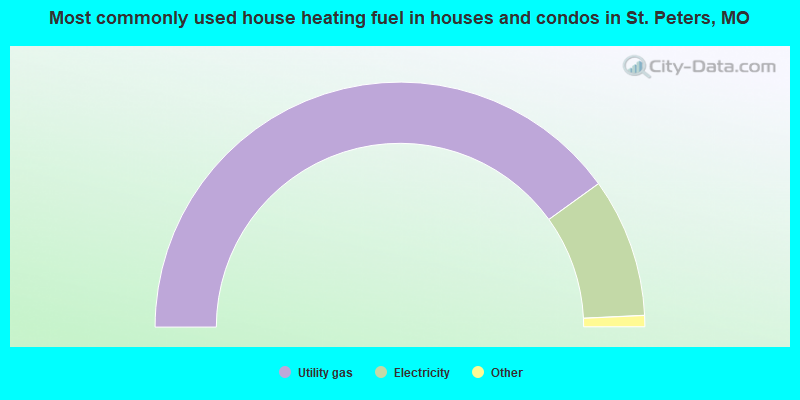
House heating fuel used in houses and condos - Utility gas (%)
House heating fuel used in houses and condos - Bottled, tank, or LP gas (%)
House heating fuel used in houses and condos - Electricity (%)
House heating fuel used in houses and condos - Fuel oil, kerosene, etc. (%)
House heating fuel used in houses and condos - Coal or coke (%)
House heating fuel used in houses and condos - Wood (%)
House heating fuel used in houses and condos - Solar energy (%)
House heating fuel used in houses and condos - Other fuel (%)
House heating fuel used in houses and condos - No fuel used (%)
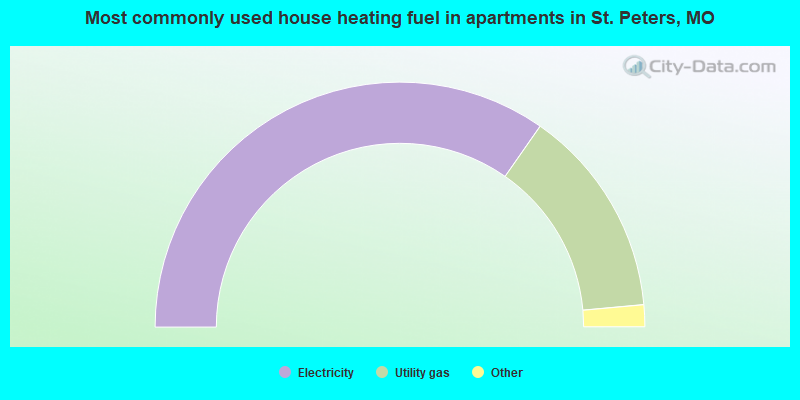
House heating fuel used in apartments - Utility gas (%)
House heating fuel used in apartments - Bottled, tank, or LP gas (%)
House heating fuel used in apartments - Electricity (%)
House heating fuel used in apartments - Fuel oil, kerosene, etc. (%)
House heating fuel used in apartments - Coal or coke (%)
House heating fuel used in apartments - Wood (%)
House heating fuel used in apartments - Solar energy (%)
House heating fuel used in apartments - Other fuel (%)
House heating fuel used in apartments - No fuel used (%)
Median year house/condo built: 1988Median year apartment built: 1988Household type by relationship:
Households: 58,762
Male householders: 11,541 (2,526 living alone ), Female householders: 12,578 (4,778 living alone )12,646 spouses (12,522 opposite-sex spouses ), 1,533 unmarried partners , (1,470 opposite-sex unmarried partners ), 16,240 children (14,727 natural , 347 adopted , 1,166 stepchildren ), 1,079 grandchildren , 285 brothers or sisters , 388 parents , 170 foster children , 739 other relatives , 1,227 non-relatives In group quarters: 332
Size of family households: 7,279 2-persons , 3,334 3-persons , 3,274 4-persons , 1,215 5-persons , 363 6-persons , 445 7-or-more-persons .
Size of nonfamily households: 7,266 1-person , 1,360 2-persons , 89 3-persons , 44 4-persons , 18 5-persons .
9,797 married couples with children. single-parent households (767 men , 991 women ).
95.6% of residents of St. Peters speak English at home. of residents speak Spanish at home (60% speak English very well , 38% speak English well , 3% don't speak English at all ).of residents speak other Indo-European language at home (88% speak English very well , 11% speak English well , 1% speak English not well ).of residents speak Asian or Pacific Island language at home (46% speak English very well , 31% speak English well , 13% speak English not well , 10% don't speak English at all ).of residents speak other language at home (70% speak English very well , 23% speak English well , 7% don't speak English at all ).
Foreign born population: 1,622 (2.8%)of them are naturalized citizens )
Median number of rooms in houses and condos:
Median number of rooms in apartments
Owner-occupied Renter-occupied
Rooms in owner-occupied houses in St. Peters, Missouri
0 1 room 31 2 rooms 459 3 rooms 1,774 4 rooms 4,076 5 rooms 3,875 6 rooms 3,411 7 rooms 3,111 8 rooms 3,264 9+ rooms
Rooms in renter-occupied apartments in St. Peters, Missouri
174 1 room 266 2 rooms 1,133 3 rooms 1,734 4 rooms 672 5 rooms 372 6 rooms 212 7 rooms 93 8 rooms 53 9+ rooms
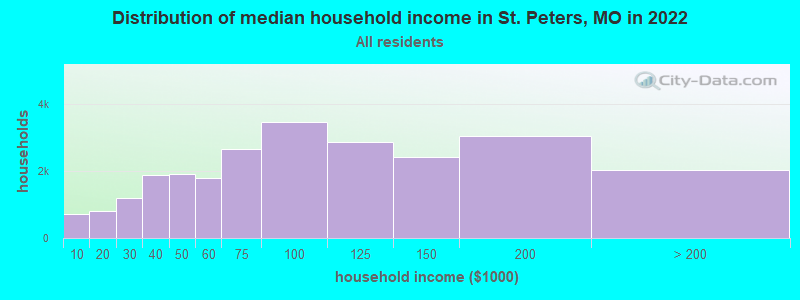
St. Peters, MO household income distribution 720 Less than $10,000792 $10,000 to $19,9991,199 $20,000 to $29,9991,877 $30,000 to $39,9991,897 $40,000 to $49,9991,781 $50,000 to $59,9992,644 $60,000 to $74,9993,463 $75,000 to $99,9992,856 $100,000 to $124,9992,423 $125,000 to $149,9993,054 $150,000 to $199,9992,031 $200,000 or more
Home value of owner - occupied houses in 2022 in St. Peters, MO 294 Less than $10,00065 $10,000 to $14,99992 $15,000 to $19,99989 $20,000 to $24,99959 $25,000 to $29,999102 $30,000 to $34,99936 $35,000 to $39,99951 $40,000 to $49,99947 $50,000 to $59,99960 $60,000 to $69,99952 $70,000 to $79,999220 $80,000 to $89,99964 $90,000 to $99,999536 $100,000 to $124,999399 $125,000 to $149,9991,166 $150,000 to $174,9991,639 $175,000 to $199,9994,077 $200,000 to $249,9993,815 $250,000 to $299,9993,326 $300,000 to $399,9991,270 $400,000 to $499,999259 $500,000 to $749,99936 $750,000 to $999,9996 $1,000,000 to $1,499,99925 $2,000,000 or moreRent paid by renters in 2022 in St. Peters, MO 49 $200 to $2497 $250 to $29971 $350 to $39940 $400 to $4498 $450 to $49947 $500 to $54928 $550 to $599230 $600 to $649358 $650 to $699305 $700 to $749115 $750 to $799248 $800 to $899483 $900 to $9991,553 $1,000 to $1,249916 $1,250 to $1,499334 $1,500 to $1,99964 $2,000 to $2,49929 $2,500 to $2,99923 $3,000 to $3,49919 $3,500 or more234 No cash rent
Percentage of workers working in this county: 60.7%Number of people working at home: 5,248 (16.9% of all workers )
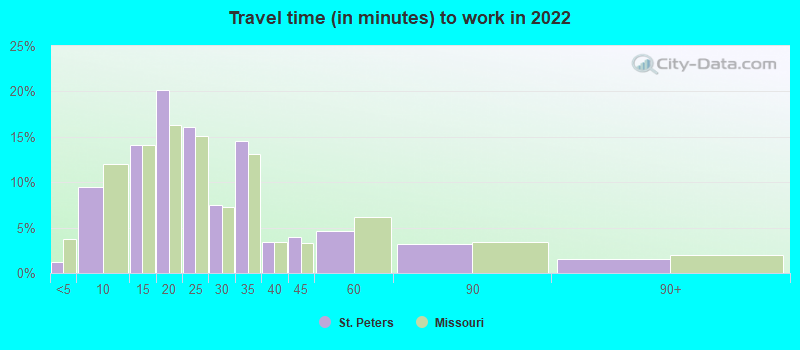
Travel time to work (commute)
Less than 5 minutes: 2355 to 9 minutes: 2,63410 to 14 minutes: 3,16115 to 19 minutes: 4,21620 to 24 minutes: 5,16625 to 29 minutes: 2,67630 to 34 minutes: 3,60735 to 39 minutes: 96840 to 44 minutes: 1,27345 to 59 minutes: 1,17060 to 89 minutes: 44990 or more minutes: 491
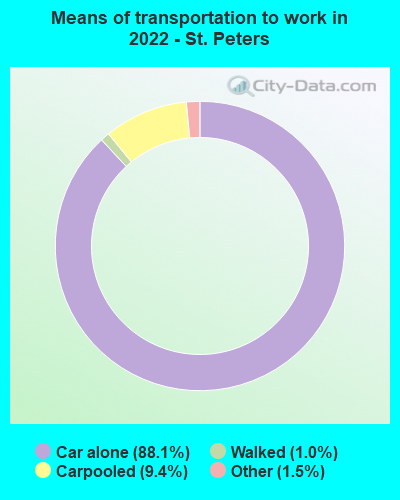
Means of transportation to work:
Drove a car alone: 25,451 (72.8%)Carpooled: 3,116 (8.9%)Long-distance train or commuter rail : 7 (0.0%)Light rail, streetcar or trolley : 8 (0.0%)Taxi: 400 (1.1%)Walked: 406 (1.2%)Worked at home: 5,180 (14.8%)
Unemployment by race in 2022
Unemployment rate for White non-Hispanic residents 1.9% Males2.0% FemalesUnemployment rate for Black residents 1.2% Males2.1% FemalesUnemployment rate for other race residents 7.8% MalesUnemployment rate for two or more race residents 3.0% Males9.3% FemalesUnemployment rate for Hispanic or Latino residents 5.8% Males4.4% Females
Year of entry for the foreign-born population in St. Peters, Missouri
588 2010 or later 392 2000 to 2009 397 1990 to 1999 256 1980 to 1989 178 1970 to 1979 184 Before 1970
First ancestries reported:
German: 7,118 (29.3%)
American: 3,076 (12.6%)
Irish: 2,371 (9.7%)
English: 1,934 (8.0%)
Italian: 1,458 (6.0%)
European: 754 (3.1%)
Polish: 279 (1.1%)
Ethiopian: 256 (1.1%)
Scottish: 224 (0.9%)
Scandinavian: 195 (0.8%)
Swedish: 164 (0.7%)
French: 131 (0.5%)
Romanian: 101 (0.4%)
Norwegian: 98 (0.4%)
Scotch-Irish: 93 (0.4%)
Dutch: 73 (0.3%)
Welsh: 69 (0.3%)
French Canadian: 63 (0.3%)
Lebanese: 59 (0.2%)
British: 58 (0.2%)
Swiss: 37 (0.2%)
Belgian: 31 (0.1%)
Greek: 26 (0.1%)
Ukrainian: 26 (0.1%)
Hungarian: 26 (0.1%)
Russian: 24 (0.10%)
Austrian: 23 (0.09%)
Northern European: 18 (0.07%)
Slovene: 17 (0.07%)
Australian: 15 (0.06%)
Nigerian: 15 (0.06%)
Canadian: 14 (0.06%)
Slovak: 12 (0.05%)
Eastern European: 10 (0.04%)
Czechoslovakian: 10 (0.04%)
Danish: 9 (0.04%)
Cajun: 9 (0.04%)
Bulgarian: 4 (0.02%) Most common places of birth for foreign-born residents (%): Philippines St. Peters:
13.7% (239)Missouri:
4.2% (10,873)
Mexico St. Peters:
13.6% (237)Missouri:
14.9% (38,568)
India St. Peters:
10.3% (180)Missouri:
8.9% (22,932)
Germany St. Peters:
9.4% (164)Missouri:
3.0% (7,803)
China, excluding Hong Kong and Taiwan St. Peters:
9.1% (159)Missouri:
6.6% (17,002)
Ethiopia St. Peters:
6.1% (106)Missouri:
1.1% (2,751)
Guatemala St. Peters:
5.4% (95)Missouri:
2.8% (7,146)
Brazil St. Peters:
3.9% (68)Missouri:
0.7% (1,861)
Romania St. Peters:
3.6% (63)Missouri:
0.6% (1,481)
Japan St. Peters:
2.5% (44)Missouri:
0.7% (1,818)
Belarus St. Peters:
2.4% (42)Missouri:
0.3% (852)
United Kingdom, excluding England and Scotland St. Peters:
1.7% (30)Missouri:
0.8% (2,138)
Korea St. Peters:
1.7% (29)Missouri:
2.9% (7,525)
Canada St. Peters:
1.7% (29)Missouri:
1.9% (4,806)
Indonesia St. Peters:
1.5% (27)Missouri:
0.2% (494)
Place of birth for U.S.-born residents:
This state: 42,857Other state: 13,887Northeast: 1,658Midwest: 6,779South: 3,597West: 1,839 90.5% of St. Peters residents lived in the same house 1 years ago.
Out of people who lived in different houses, 29.6% lived in this county.
Out of people who lived in different counties, 75.0% lived in Missouri.
St. Peters:
90.5%State average:
87.1%
Education attainment for males 25 years and older:
No schooling: 59Nursery to 4th grade: 05th and 6th grade: 457th and 8th grade: 1599th grade: 5910th grade: 5511th grade: 18212th grade, no diploma: 192High school graduate (or equivalency): 4,587Less than 1 year of college: 1,910Some college more than 1 year, no degree: 3,068Associate degree: 1,922Bachelor's degree: 4,797Master's degree: 2,022Professional school degree: 153Doctorate degree: 262
Education attainment for females 25 years and older:
No schooling: 196Nursery to 4th grade: 235th and 6th grade: 1377th and 8th grade: 579th grade: 3010th grade: 13511th grade: 17112th grade, no diploma: 300High school graduate (or equivalency): 5,154Less than 1 year of college: 1,731Some college more than 1 year, no degree: 4,378Associate degree: 1,827Bachelor's degree: 5,050Master's degree: 2,650Professional school degree: 258Doctorate degree: 300
Housing units in structures:
One, detached: 17,552One, attached: 2,537Two: 2323 or 4: 1,5215 to 9: 77710 to 19: 1,36220 to 49: 38950 or more: 473Mobile homes: 517Median worth of mobile homes: $35,735
Housing units lacking complete plumbing facilities in 2022: 0.0%Housing units lacking complete kitchen facilities in 2022: 0.4%House/condo owner moved in on average 12 years ago
Renter moved in on average 3 years ago
Private vs. public school enrollment:
Students in private schools in grades 1 to 8 (elementary and middle school): 1,163 Students in private schools in grades 9 to 12 (high school): 364 Students in private undergraduate colleges: 371